
 Every five years, farmers from across the U.S. complete detailed questionnaires that provide the best statistical information available about the farming industry in this country. State and county data from the 2017 US Census of Agriculture was released in April 2019.
–
U.S. Farm Facts
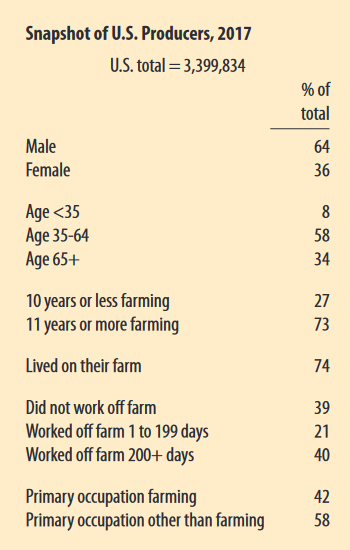
In 2017, there 3.4 million farmers (producers involved in decision making) on 2 million farms in the U.S., that farmed 900 million acres and sold $388 billion worth of agricultural products. There were 2.4 million hired workers on farms, so a total of 5.8 million people were actively engaged in American farming in 2017. The total population of the United States was estimated to be 327 million on July 1 of 2018, so that means that 1% of Americans are farmers, and only 1.8% of the people in this country are actively engaged on working farms. With so few people actually working on farms, it is important that everyone involved in agriculture be able to share the story of this vital industry of our country.
There are a lot of key points that this data highlights about the changes in modern farming. Like every other industry, women are more involved than ever before with 1.2 million women engaged in some form of decision making on U.S. farms, a 27% increase from just five years ago. American farmers are getting older. The average age of the U.S. farmer in 2017 was 57.5 (56.3 in 2012), with 34% over the age of 65, and just 8% under the age of 35. Of the 2 million farmers in the U.S., only 42% said that their primary occupation was farming (44% in 2012).
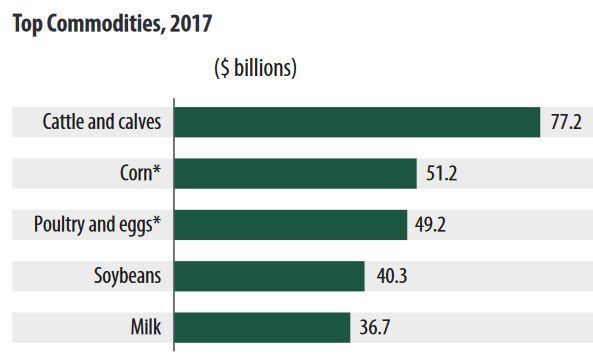 Cattle are still king in the U.S. with over $77 billion in farm gate sales, up only 1% from 2012. Corn fell off 24%, from $67 billion in 2012 to $51 million in 2017. In total, crop values were down 9%, while livestock sale values were up 7%, bringing the two back in balance again making up equal parts of farm production income (50/50).
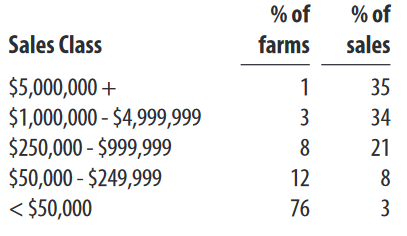
Large farms continue to dominate the value of total agricultural production in the U.S. While only 4% of U.S. farms had annual sales of over $1 million, they represented 69% of total products sold (66% in 2012), as compared to 76% of U.S. farms with less than $50 thousand in annual sales, representing only 3% of the total product value sold.
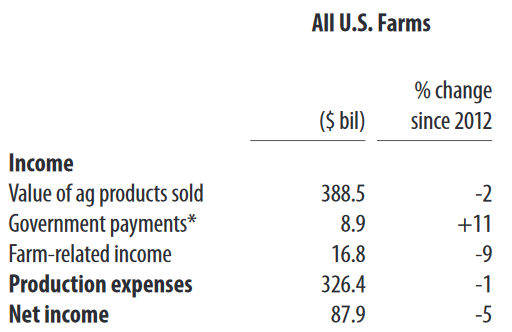
Unfortunately the value of farm products dropped 2% as compared to 2012, and farm income dropped 5% over the past five years. Looking at the chart above the need is clear for the Farm Bill Programs that keep food costs down, yet also keeping farmers in business.
–
Florida Farm Facts
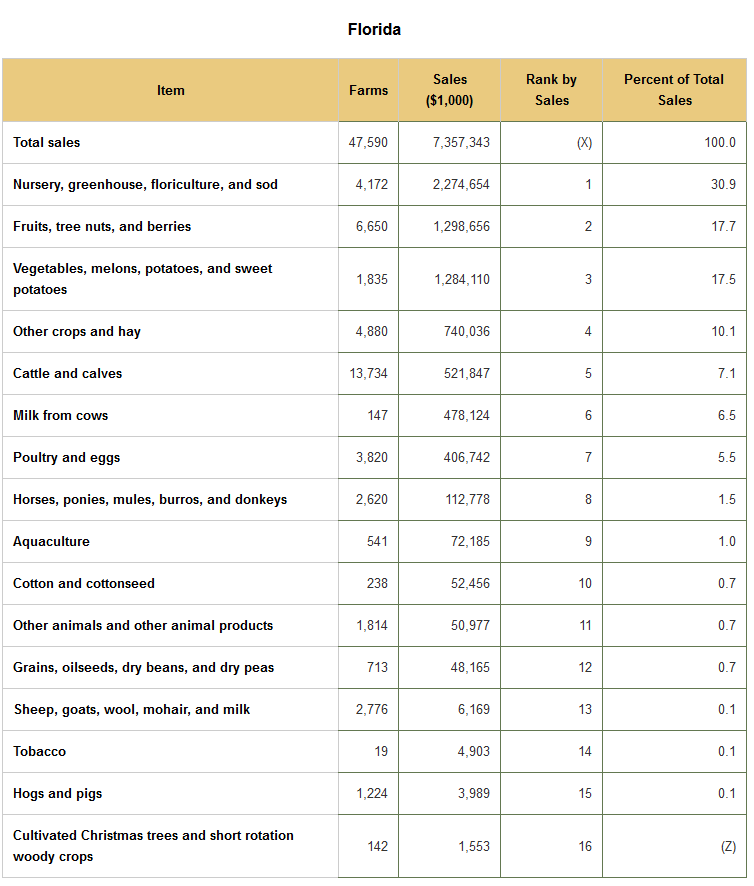
In 2017, Florida had 47,590 farms that managed 9.7 million acres, and produced a total market value for all products sold of $7.4 billion. The largest farm category by sales was the $2.3 billion ornamental industry (nursery, greenhouse, flowers, and sod). The second largest category by sales was the citrus, strawberry, blueberry and pecans with $2.2 billion, followed by the vegetable crops in third with 1.3 billion. Our Florida row crops don’t fit neatly in the national categories, and were divided up somewhat, so it is much harder to see the impact of the row crop industry in Florida. Peanuts were included in the “other crops” category that also includes hay sales. But if you add together cotton, other crops, grains,and tobacco the total market value of product sold was $845 million, which would have been ranked 4th. Florida cattle operations brought in $521 million in sales in 2017, ranking 5th.
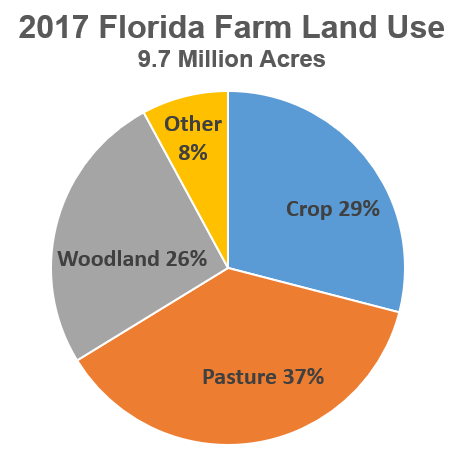
Pasture (37%) was the largest land use on Florida farms in 2017, followed by crops (29%), woods (26%) and other uses 8%.
Panhandle Farm Facts
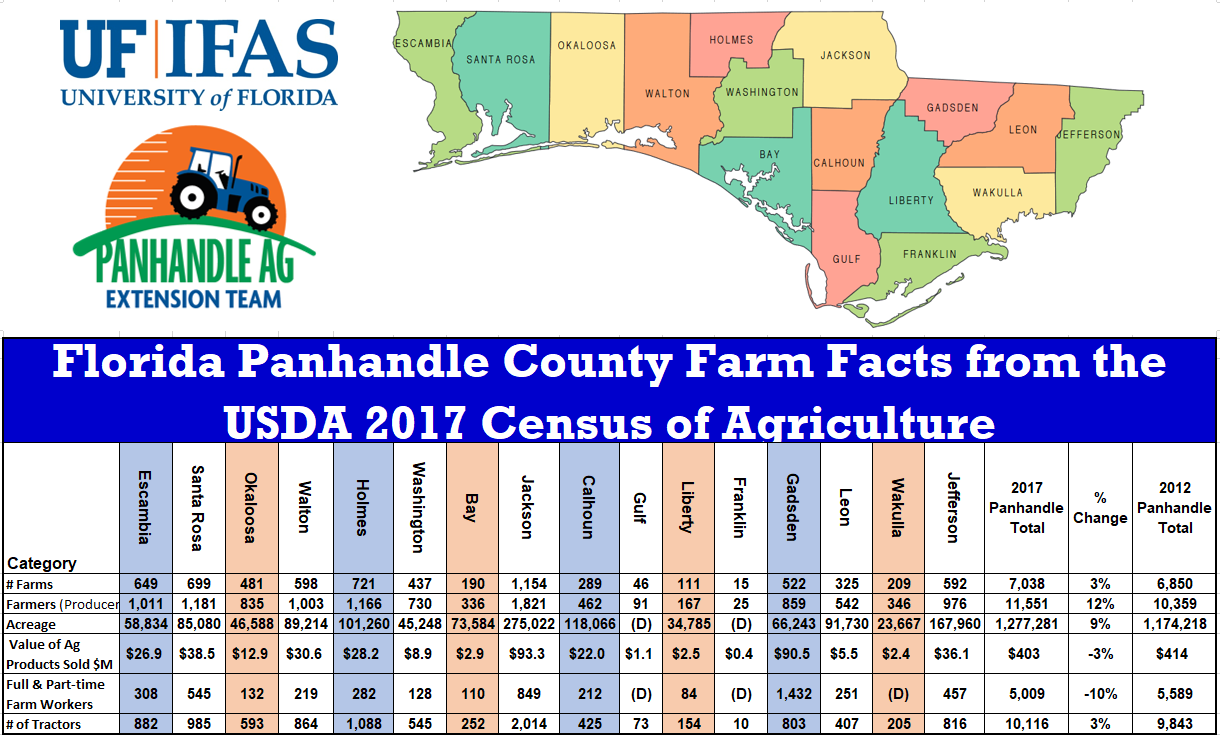
Source: 2017 Census of Agriculture. Click on image for full screen viewing.
Over the past five years, farms in the Panhandle actually increased in all categories: +3% number of farms, +12% farmers (decision making producers) and +9% acreage. These farms also purchased 10K tractors, up 3% over 2012. Unfortunately, the value of the crops and livestock sold dropped 3%, and there were also 10% fewer hired workers than five years ago. Of the 16 counties in the Florida Panhandle, Jackson County had the most agricultural land in production with 275K acres, followed by Jefferson (167K), Calhoun (118K), Holmes (101K), Leon (92K), Walton (89K), and Santa Rosa (85K). All total, there were 7,038 farms that sold $403 million worth of farm products, produced by 11.5K farmers on 1.3 million acres in 2017 from all 16 Panhandle counties.
–

Source: 2017 Census of Agriculture. Click on image for full screen viewing.
Crop production declined over the past five years, except that there were a few more farms (+3%), but harvested acreage declined by 8,510 acres (-3%). The biggest change was a drastic drop off in wheat (-78%) and soybean (-30%) production from 2012 .
–
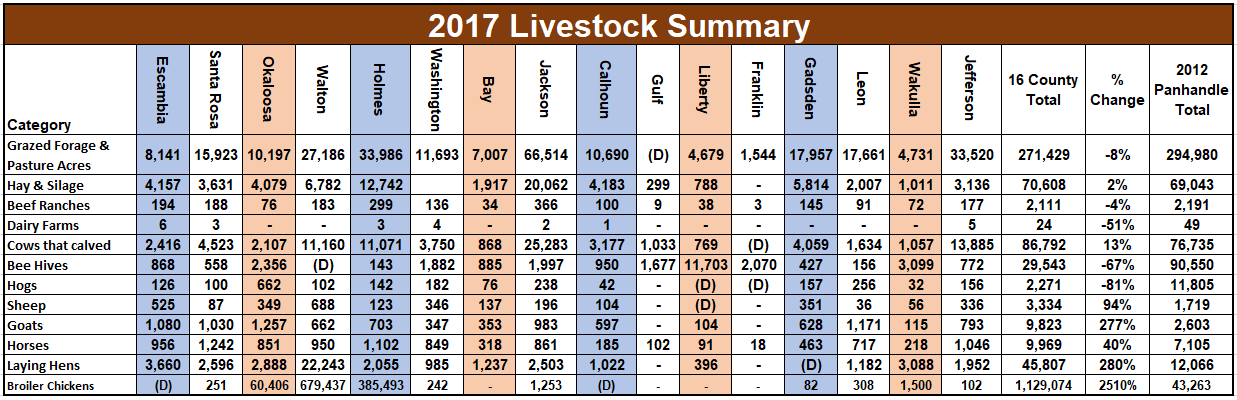
Source: 2017 Census of Agriculture. Click on image for full screen viewing.
Livestock Production from 2017 was compared to the figures in the 2012 Ag Census. Pasture acreage declined (-8%), but hay acreage increased slightly (+2%). While there were more cows that calved (+13%), the big changes were with the increase in the number of broilers (+2510%), laying hens (+280%), goats (+277%), and horses (+40%). The greatest decline were the number of hogs (-81%) bee hives (-67%) and dairy farms (-51%).
–
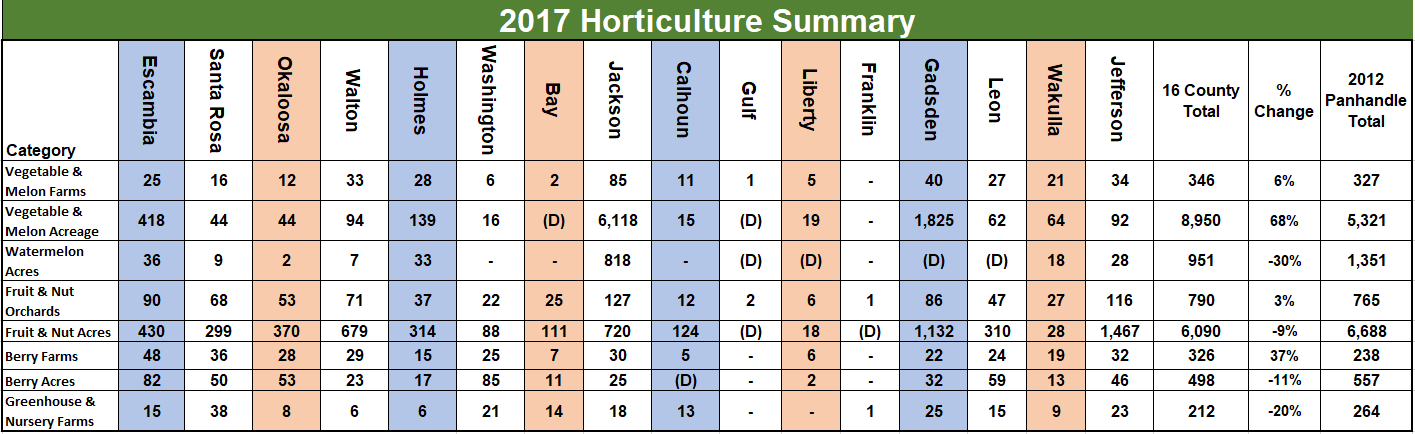
Source: 2017 Census of Agriculture. Click on image for full screen viewing.
The number of vegetable and melon farms (+6%) increased in 2017, on almost 9K acres (+68%). The number of blueberry and strawberry farms increased significantly (+37%), but the total number of acres declined (111%). There was a small increase in citrus/pecan orchards (+3%), but total acreage declined (-9%). There were fewer nurseries (-20%) than five years ago, but the largest decline was in watermelon acreage (-30%).
–
Want more details on the information from your home county?
Florida County Data from the 2017 Census of Agriculture
2017 Census of Agriculture Home Page
demayo@ufl.edu - 850-482-9620
Follow me on Twitter
@UFCowman