Released May 2013 | by Dr. Yvan Philippe Luxembourg
Executive Summary
The Successful SAM series presents crucial aspects of Software Asset Management – from decision-making to implementation.
This report is aimed at those in management faced with the challenges of Software Asset Management (SAM). We give valuable advice for understanding the cost structure and mechanisms of software assets, and arriving at a sound decision regarding Software Asset Management in your organization.
The report is split into four chapters:
- Chapter (I.) examines the weight of software assets in IT costs. Software assets contribute up to 30% to the average IT budget. They are usually partially hidden within other cost categories, such as hardware, external support and personnel costs. Knowing software asset costs is a prerequisite to targeting the root of these costs – the software assets themselves.
- Chapter (II.) analyzes the growth of software asset costs. Fueled by endogenous and exogenous growth, software assets grow faster than any other IT costs, with an average of 9% CAGR p.a.
- Chapter (III.) explains the multiplier effect of side-by-side license costs and maintenance costs. For corporations, software licensed from third-party vendors makes up the largest part of software asset costs. Vendors have increased their maintenance rates, shortened release cycles and differentiated support in order to increase their revenues.
- Chapter (IV.) deals with the vicious circles of licensing costs and incompliance financial risk. Customers face unexpected costs due to license purchases: 100 EUR in CAPEX expenses from license purchases will eventually generate a total of 436 EUR for license maintenance (OPEX), reinstatement (CAPEX), audit settlement penalty (CAPEX & OPEX), etc.
In the appendix we provide a detailed IT cost breakdown, outlining main cost categories. Customers may use this cost breakdown to compare with their own cost structure or build one specifically relating to their own business.
In further publications we will provide ready-to-use information and data for building your own SAM business case, with advice ranging from conception all the way to implementation. In the meantime, for those executives interested in sharing their thoughts on Software Asset Management or licensing, we welcome your feedback and comments.
Introduction
The total money spent on IT worldwide, most recently estimated as US $3.5 trillion, is currently growing at 5% p.a. – doubling every 15 years. IT costs, as a percentage of corporate revenue, have grown 50% since 2002, putting a strain on IT budgets. Today, when looking at companies’ IT budgets, 75% are recurrent costs, used to “keep the lights on” in the IT department.
Many have resorted to accepting that these costs cannot be avoided. Fortunately, however, one major portion of these costs may be influenced – software assets.
In the following report, we give advice which is useful in understanding software asset costs – vital if a company is to target and reduce them. We will disclose how software asset costs are hidden in other categories, such as hardware and personnel, leading to a distorted value compared to the true figure. We will then provide some average figures for the endogenous and exogenous growth of software asset costs and explain the multiplier effect of side-by-side license and maintenance costs. Finally, we will explain the vicious circle of licensing costs and audit financial risk – and its little-known implications on organizations with license, maintenance, reinstatement and audit penalty costs.
I.) IT Cost Breakdown – The Costs Of Software Assets
Researchers from McKinsey and the Sand-Hill Group estimate that, all-in-all, 30% of the average IT budget is consumed by software assets, putting this cost category in the top league of IT costs.
Targeting the costs of software assets assumes that these costs are detected and allocated to the correct cost categories. However, the costs for software assets are often unknown and hidden within other costs.
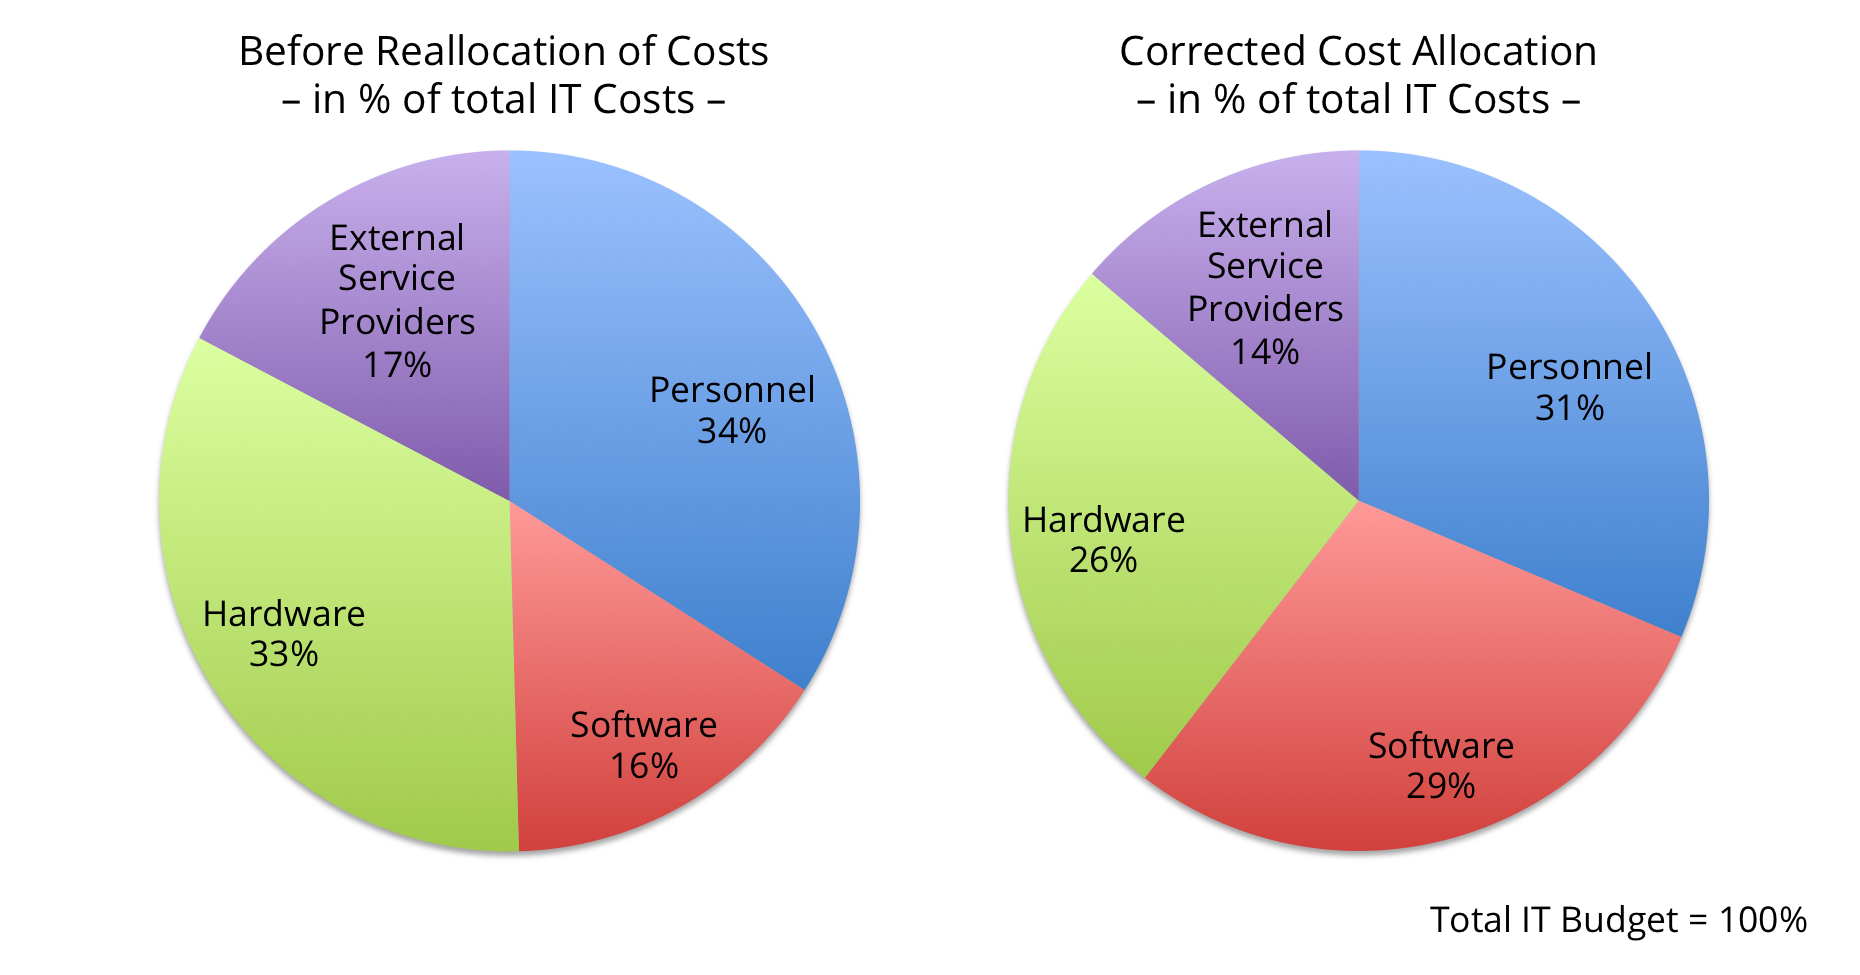
The average IT budget has the following breakdown:
- 34% – personnel costs (internal),
- 33% – hardware costs (external/purchasing category),
- 17% – costs of external service providers (external/services), and
- 16% – software costs (external/purchasing category).
The aforementioned low software asset costs – normally stated in the range of 15% to 20% of IT budgets – do not represent the true cost.
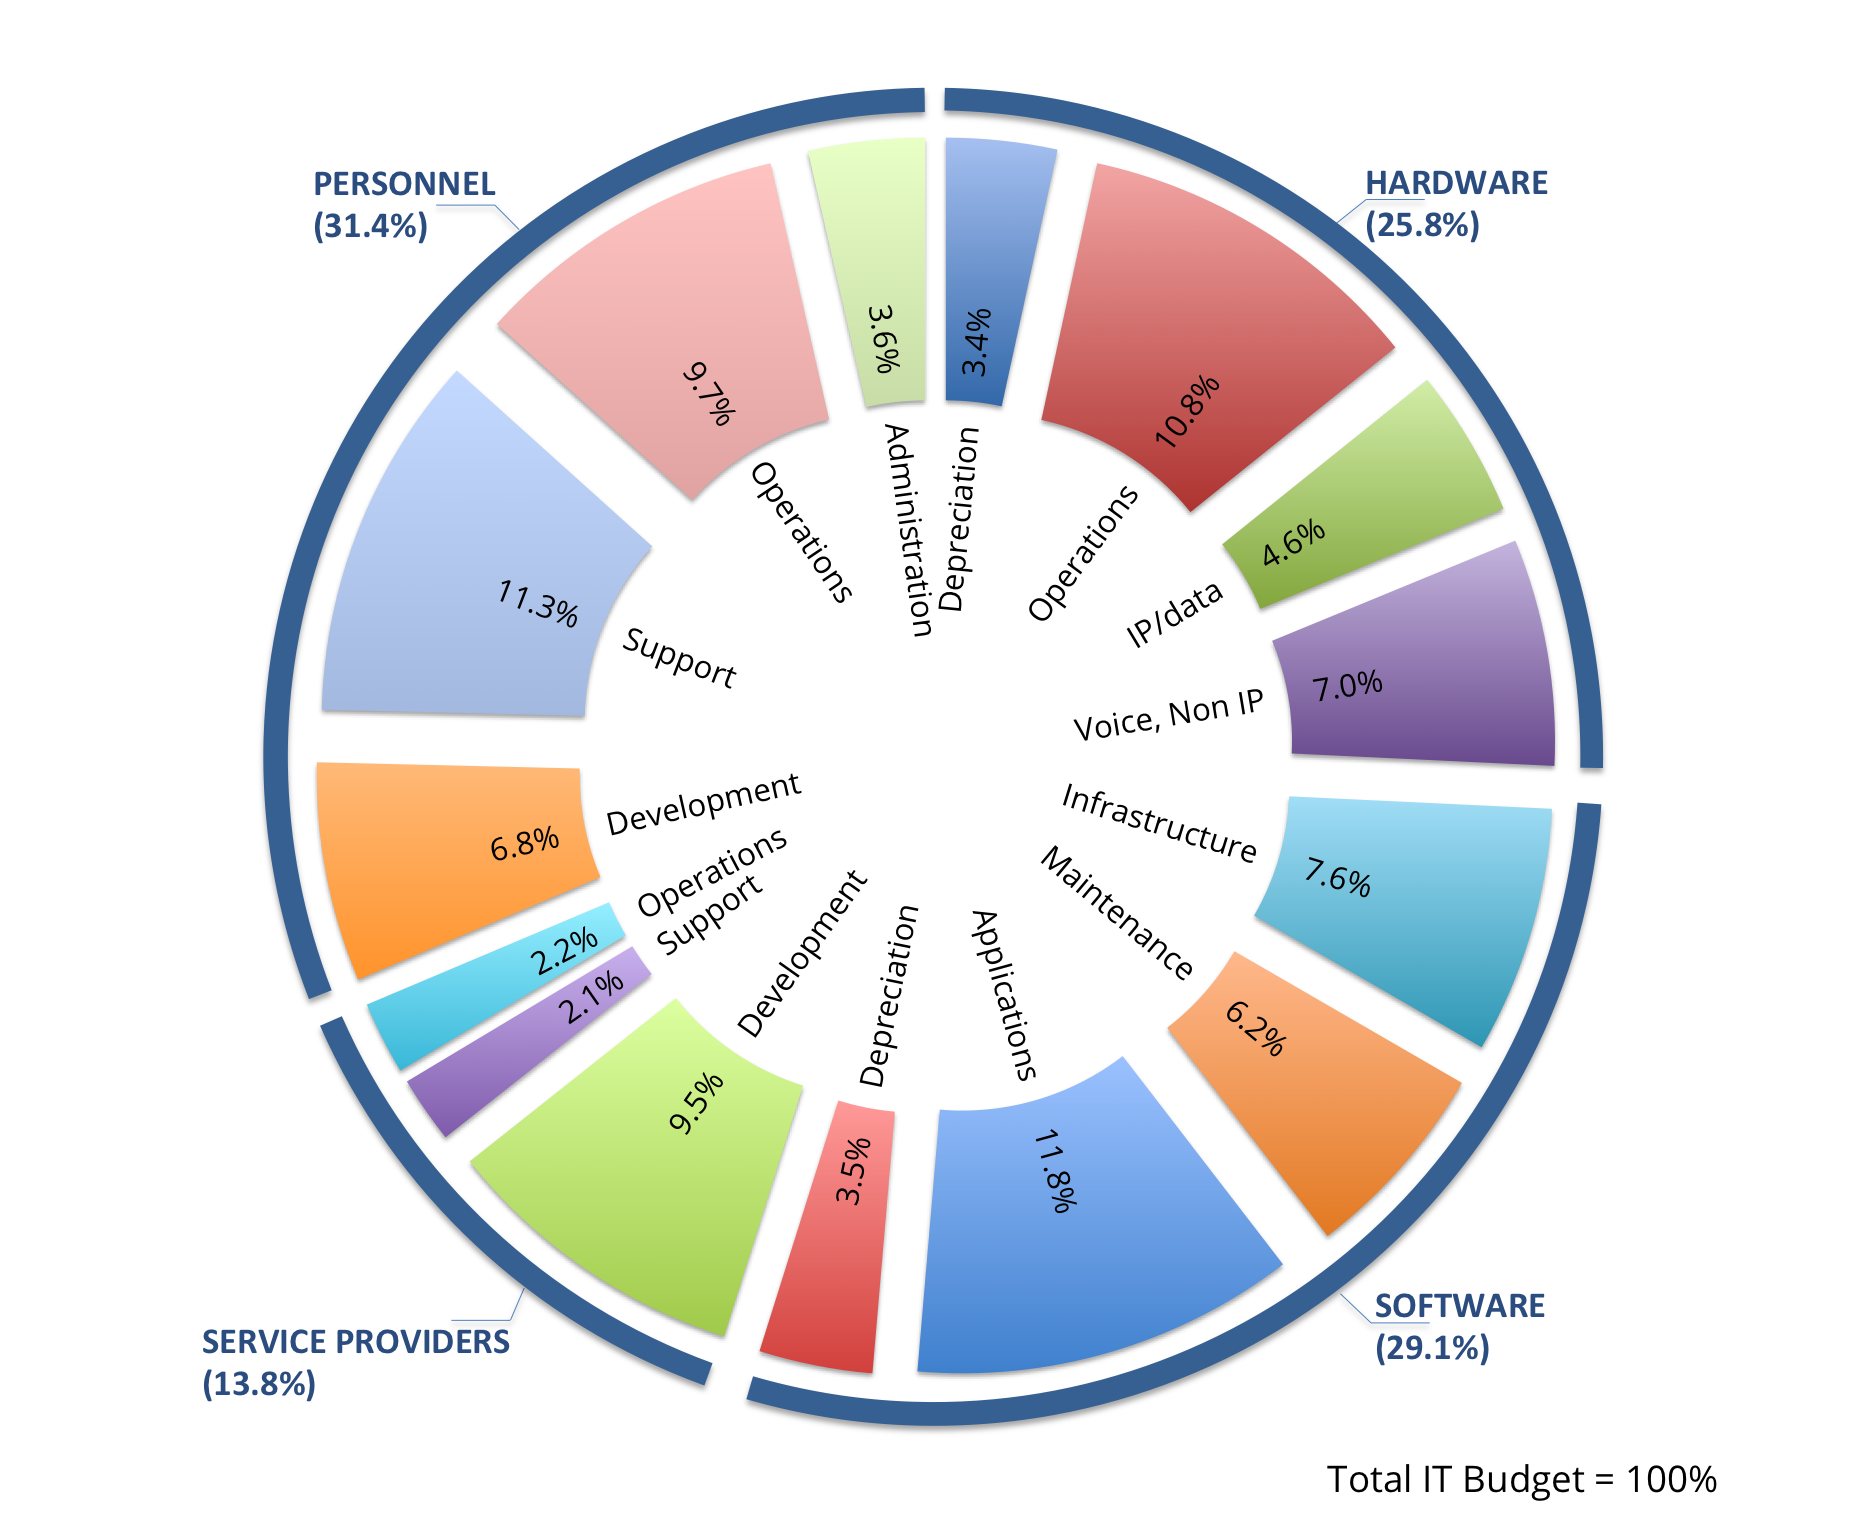
A simple cost allocation analysis usually shows that various costs associated with software assets are improperly recorded under other cost categories, such as under personnel (e.g. software support, helpdesk, software catalogue management), hardware (e.g. Citrix licensing servers and FLEX servers used exclusively to monitor software), or external service providers (e.g. external/technical support for software).
A corrected cost allocation re-establishes the transparency of software assets. As a result of this correction, OMTCO calculates the average software asset costs as being 28% of total IT costs – confirming the McKinsey and Sand-Hill Group opinions mentioned before.
This shows why cost-cutting initiatives directed at the consequences of software assets (hardware, personnel), but not at the root cause of the costs (the software assets themselves), have little impact. In order to control and cut software asset costs, software assets themselves must be targeted.
Recommendation:
Get to know your software asset costs – they represent a much higher proportion than usually expected, usually 30% of IT costs. They are most likely obscured within other cost categories, such as hardware, external support and personnel costs. Knowing software asset costs is a prerequisite to targeting the root of these costs – the software assets themselves.
II.) The Growth Of Software Asset Costs
In addition to the considerations above about the current volume of software asset costs, even more important is their growth – their absolute growth (in EUR) and relative growth (relative to growth of other costs in the IT budget).
Software asset costs are growing, endogenously and exogenously:
- Endogenous growth – Recent technology shifts and IT cost reduction initiatives, e.g. server virtualization, remote desktops and cloud computing, have delivered flexibility and security in operations and a cost advantage on the hardware/infrastructure side – but have generated increased software demand, and thus supplementary costs, on the software asset side.
- Exogenous growth – Software vendors have transformed the process of discovering incompliance into a business model. The technology shift to virtualized/cloud environments has provided the right platform. Nowadays, most vendors have increased the complexity licensing requirements, taking into account more attributes for more licensing metrics. They have accelerated the pace of change and created more pitfalls, thus increasing the level of software licensing expertise required in order to remain compliant.
For the purpose of forecasting and budgeting, the specificities of each organization’s infrastructure should be considered. However, should your software cost trend analysis not yet be available, we suggest that you cast a first draft version relating to your own business case with the following hypothesis: We forecast an average of 9% year-to-year growth of software asset costs for the period 2013-2016 (estimated from our market experience):
- Endogenous growth – 4% per year (2% inflation + 2% demand increase)
- Exogenous growth – 5% per year, strongly depending however on your product portfolio and compliance profile (see more detailed explanations in the next chapter – contact OMTCO for a customized calculation).
This 9% growth takes into account endogenous and exogenous growth, and is to be accounted for in planned budgets and budget overrun.
Recommendation:
Take into account the endogenous and exogenous growth of software asset costs – if unknown, use an average of 9% p.a. growth.
III.) How A One Euro Purchase Becomes Two Euros In Costs
Let us consider an organization for which software assets make up 30% of IT costs. Software licensed from third-party vendors makes up the highest portion of software asset costs. We will thus only consider costs related to software licensed from third party vendors.
How One (License) Becomes Two (License And Maintenance)
In this chapter we will consider side-by-side license costs and maintenance costs. The main costs of software licensed from third-party vendors are the costs of goods and services (for the purposes of this explanation, we will disregard other costs, such as overheads, management costs, transaction costs, etc.):
- License purchases (CAPEX) – Purchases lead to depreciation (CAPEX) on investment. We take into account here all types of licenses: base-licenses, reinstatements, migration licenses for products, editions or metrics, trade-ups on products, metric trade-ins and settlement licenses (compliance audit settlements). These costs are usually booked as capital expenditure (CAPEX) and depreciated over five years.
- License Maintenance (OPEX) – such as subscription and support (cash out to software vendors), support only (from non-vendors), internal costs (personnel) for support, various levels of service and support (internal/external), including maintenance on settlement licenses and reinstatements.
Using the example of third-party licenses, the initial investment for the license purchase (CAPEX) used to be the highest portion of the costs. OPEX would have been only the maintenance costs (on average, 18% of the base license), applied only to the licenses under maintenance (on average, 60% of licenses) – that is, 10% per year (=18% x 60%). Customers would carefully select which software was to be kept under active maintenance, in order to get support, version updates and security patches where they needed them.
These times are gone: vendors have increased their maintenance rate (18% -> 22% for Oracle). They have also shortened release cycles and differentiated support (bronze/silver/gold) in order to increase the asset base under maintenance (60% -> 80% -> 100%). Furthermore, other changes in licensing requirements, such as Matching Support Level for Oracle or IPAA §3.5.1 for IBM, are obliging customers to keep unwanted licenses under active maintenance. As we will see in the following example, all these measures are boosting the value of OPEX, which may even overtake CAPEX (see the example below for which OPEX = 110% x CAPEX).
How One Euro Becomes Two Euros
Let us consider the example of the costs generated by software licenses: these costs cover the purchase and maintenance of software licenses (we will disregard other costs such as overheads, transaction costs, etc.).
Hypotheses:
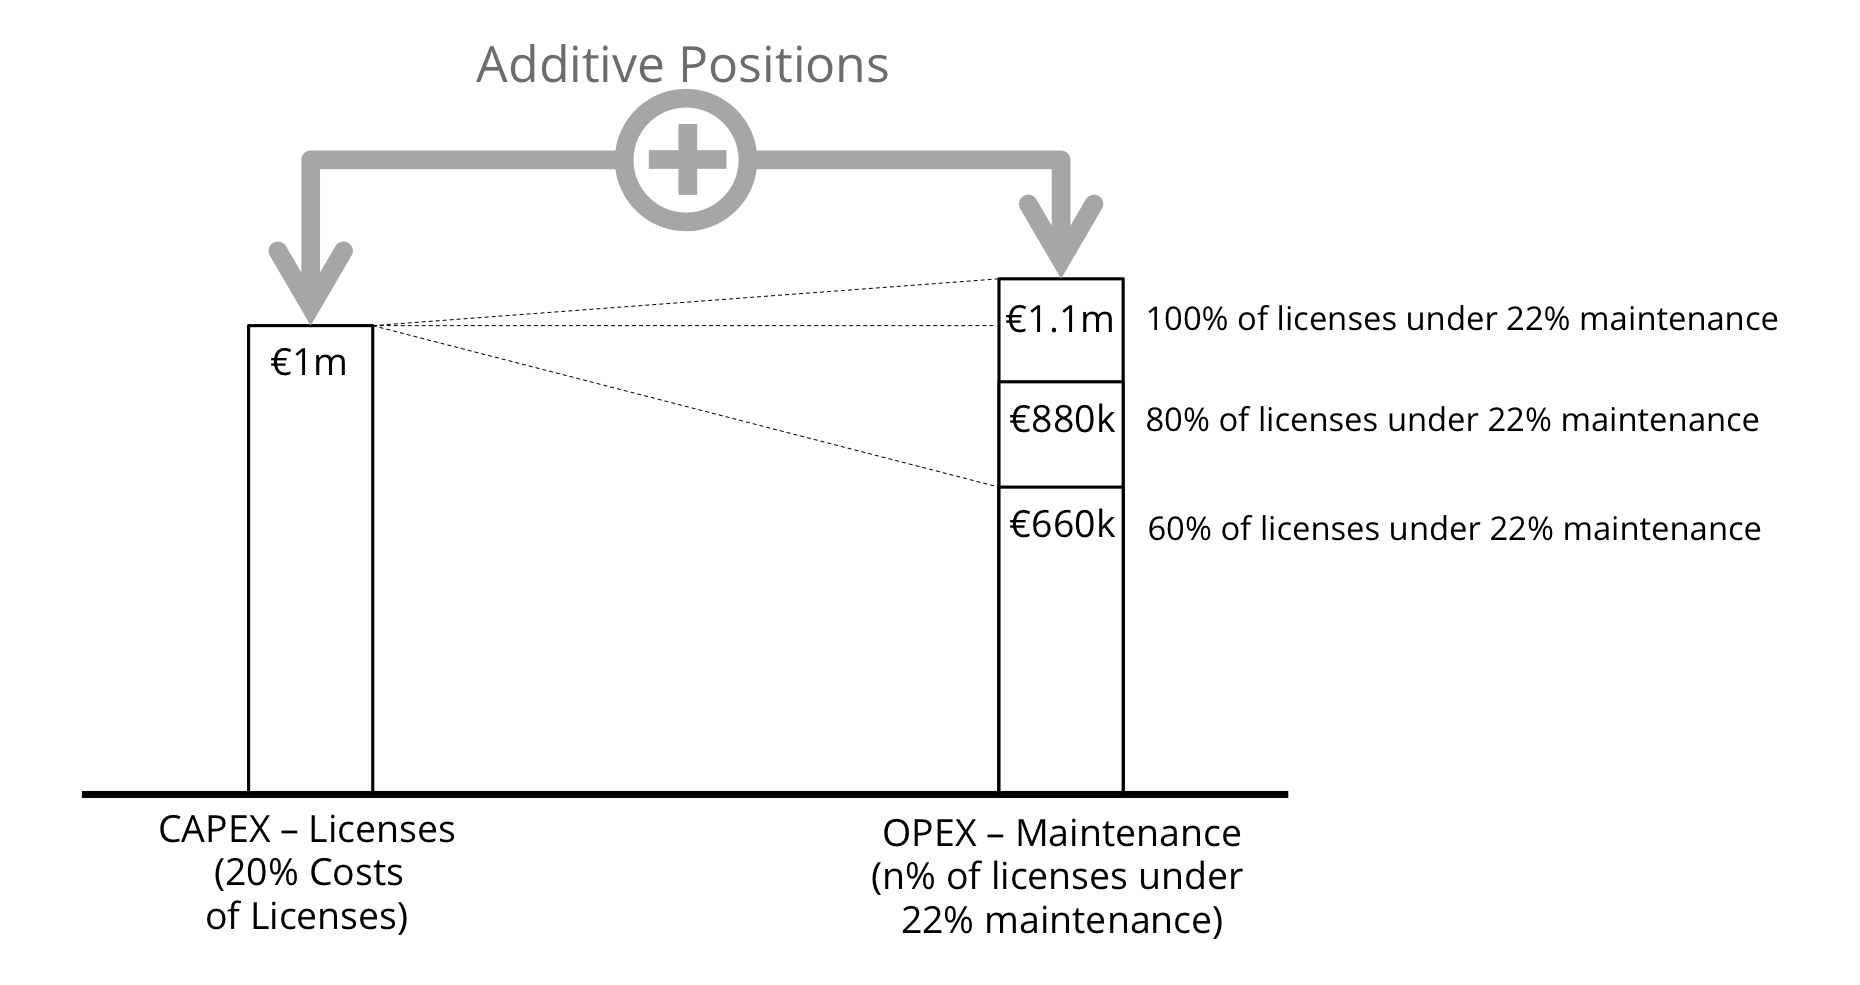
- An organization with €5m license costs, depreciating linearly over five years. This purchase is considered a one-time investment. In case customers consider repeated, yearly purchases, all numbers should be considered as additive.
- 60% (alternatively 80% or 100%) of license estates are under 22% maintenance (Note: this is Oracle’s maintenance rate).
Cost calculation:
- Capital Expenditure (CAPEX) – €1m CAPEX yearly (€1m x 20% yearly)
- Operational Expenditure (OPEX) – OPEX ranges from €660k to €1.2m yearly. (€5m x (60% or 80% or 100%) x 22% yearly).
As it stands, the maintenance part of the license is far from negligible: it increases yearly licensing costs by between 66% and 110% (a multiplier of 1.66 to 2.1). Software vendors have realized this and are often tempted to increase both sides of the multiplication: the calculation base (volume of licenses under maintenance) and the maintenance rate (% of license purchase price).
Vendors Are Increasing Maintenance Volumes And Maintenance Rates
For example:
- Increasing the calculation base – Oracle does not allow for partial maintenance termination (because of Oracle Matching Support Level), so volumes must be kept under maintenance. Oracle does not allow for low-cost support or no maintenance when adding new licenses to a license pool under maintenance. In 2011, IBM invented the IPAA 3.5.1 (International Passport Advantage Agreement) rule, increasing the ratio of licenses under maintenance from an average of 60% to 80% across all products.
- Boosting the maintenance rate – in 2011, Oracle increased maintenance costs from 18% to 22% of the license base price (an increase of +22.2%).
These rules generate new, supplementary OPEX revenue streams for vendors, based on former investment decisions and “old” CAPEX – even when investments (licenses) have depreciated and CAPEX is zeroed.
Recommendation:
Vendors are increasing maintenance volumes and maintenance rates. Be aware that you may no longer be able to selectively choose which software is to be kept under active maintenance to get support, version updates and security patches – the clock on the volume of your payments is triggered.
IV.) The Vicious Circles Of Software Asset Costs And Incompliance Financial Risk
There is more to this: a corporation purchasing licenses (CAPEX) will be exposed to further costs which are very difficult to avoid.
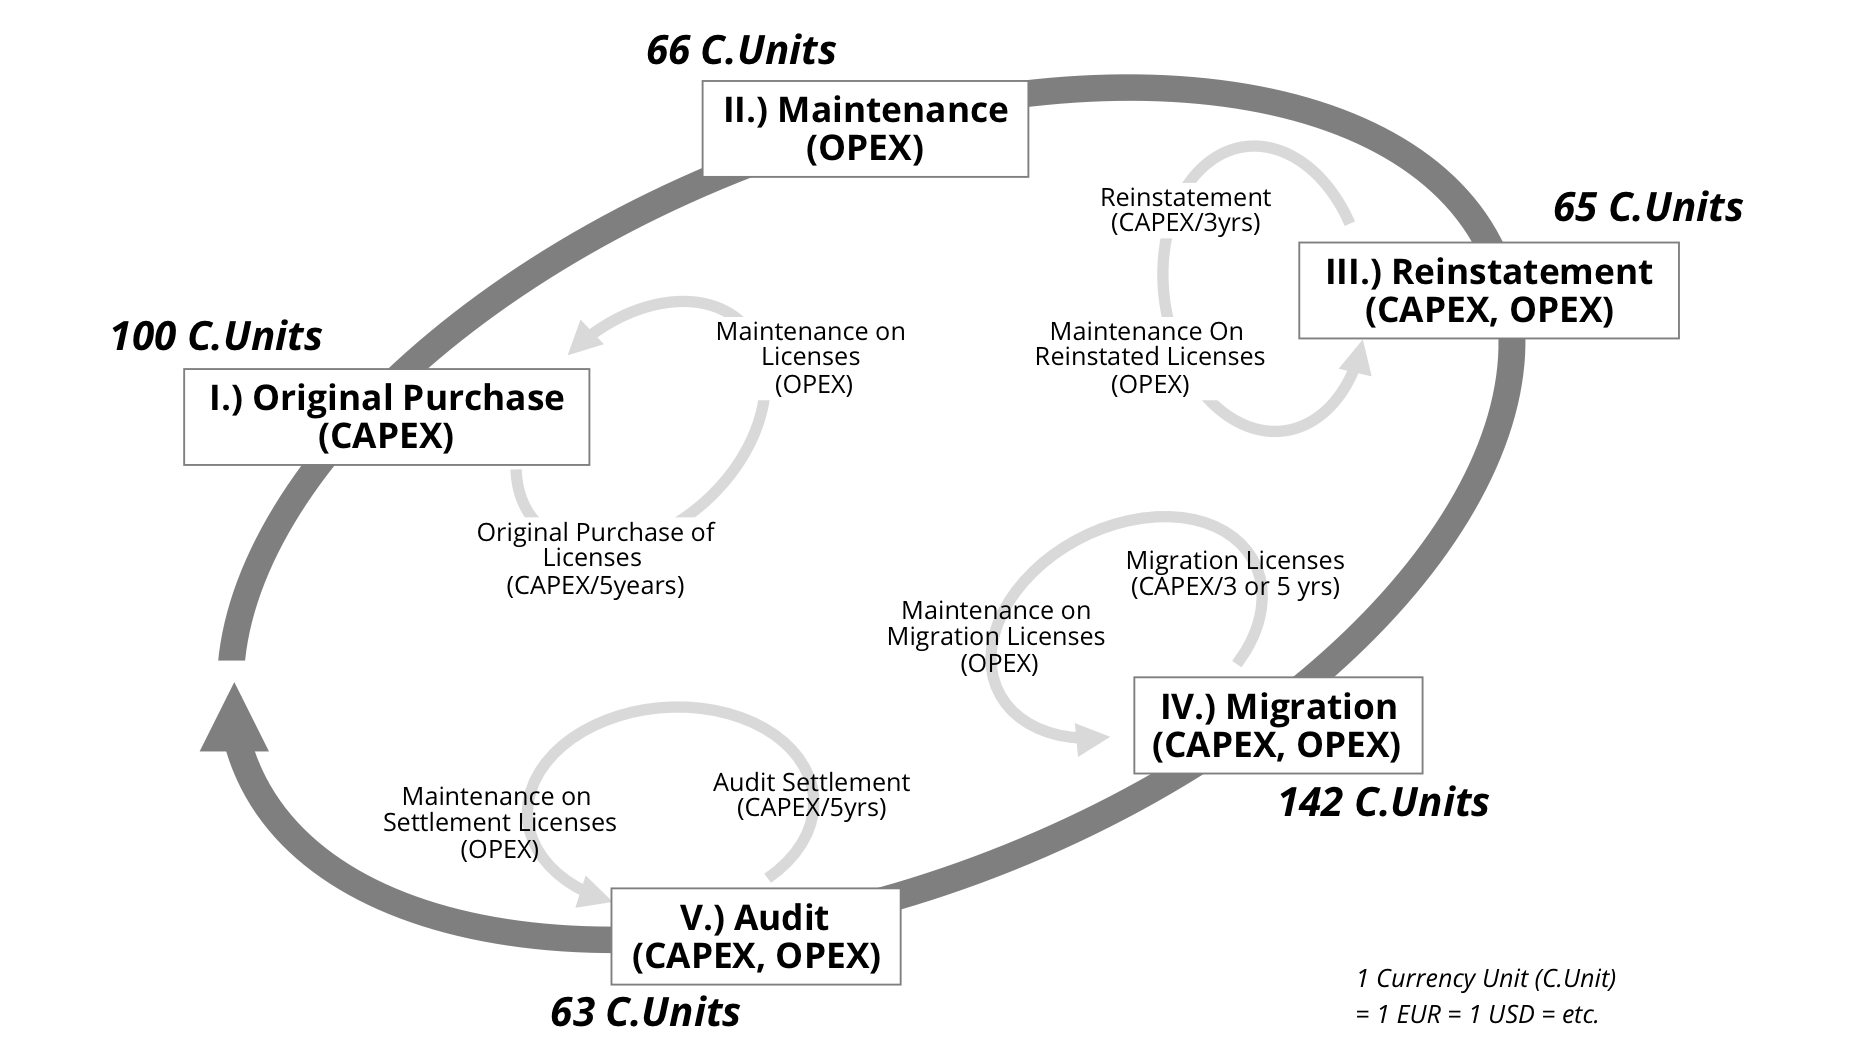
Introducing the vicious circles of licensing costs, let us consider a corporation purchasing 500 units (stage I) of licenses, depreciating over five years. The following mechanisms detail how further costs are generated in four additional stages, II, III, IV and V. All in all, software assets of 100 units of CAPEX (5 years depreciation) will be increased by a multiplier of 436%.
Mechanisms:
- (I.) The purchase of 500 units of licenses generates license costs (CAPEX) of 100 units (unit = any currency, EUR, USD, etc.). Hypothesis: depreciation over five years.
- (II.) On average, a further value of 66 units will be spent on maintenance costs (OPEX) in order to keep a portion of these licenses under maintenance. Hypothesis: 60% of licenses under active maintenance with a maintenance rate of 22%.
- (III.) On average, a value of 65 units will be spent by customers on reinstatements (CAPEX + OPEX for renewals), as customers will inevitably implement a technical upgrade for some licenses not kept under maintenance or having experienced a discontinuity in maintenance (1 day suffices).
- (IV.) On average, 142 units will be spent by customers on migrations (CAPEX for migration licenses + OPEX for maintenance), as software vendors regularly introduce product/technological/marketing changes, a migration from Product A to Product B, associated with a change in licensing.
- (V.) On average, 63 units will be spent by customers on settling their incompliance (CAPEX, then OPEX for maintenance of settlement licenses).
These numbers are averaged from a pool of data from specific software vendors. Hypotheses for custom data models are available on request.
Recommendation:
Take into consideration the vicious circles of licensing costs and incompliance financial risk: A 100 EUR purchase of CAPEX licenses will be increased by an average factor of 4.36 due to maintenance, reinstatement, migrations, and audit penalties.
Conclusion And Outlook
Software Asset Management (SAM) is a very complex topic with a high impact on profitability.
Most organizations have started defining and implementing Software Asset Management in the form of SAM processes, SAM tools and licensing expertise. However, while SAM is understood as a core enabler of competence in IT, many organizations are still confronted with incomplete or inaccurate information about their own software assets.
We recommend organizations to decide and design their SAM based on the impact of SAM on software asset costs and financial risk from compliance audits. Should you not have adequate data to build your own business case, we recommend you use the figures provided in this report for a first draft.
In further publications, we will analyze expected cost and risk reductions, providing ready-to-use elements and information to help you build your own SAM business case.
OMTCO has extensive experience in Software Asset Management and licensing. Should you wish for advice tailored to your specific needs, please call your OMTCO representative directly or contact OMTCO at sam@omtco.de
(Released May 2013)
Appendix
An average IT cost breakdown after the reallocation of software asset costs. Values are averaged from a pool of cost analyses from the years 2010-2013. For an adaptation to your organization’s own data and your business case, please contact OMTCO.
– CONFIDENTIALITY NOTICE –
OMTCO does not disclose clients’ names, client projects or data. The case study and data published in this report is generic and derived from years of compliance reviews. All analysis presented and information disclosed in this document are exclusively based on public information. Should you wish to learn more about our confidentiality practice or about this case study, please contact an OMTCO representative.
IT Costs – The Costs, Growth And Financial Risk Of Software Assets
THIS REPORT IS AIMED AT THOSE IN MANAGEMENT FACED WITH THE CHALLENGES OF SOFTWARE ASSET MANAGEMENT (SAM). WE GIVE VALUABLE ADVICE FOR UNDERSTANDING THE COST STRUCTURE AND MECHANISMS OF SOFTWARE ASSETS, AND ARRIVING AT A SOUND DECISION REGARDING SOFTWARE ASSET MANAGEMENT IN YOUR ORGANIZATION.
is a consultant
at OMTCO Munich Office.
Contact:
00 49 170 6003451
ypl@omtco.de
 Tim Sommer, MBA
is a consultant
at OMTCO Vienna Office.
Contact:
00 43 699 15007391
tim.sommer@omtco.de
OMTCO provides its clients with the best, thought-out advisory and line services, ranging from design-stage to implementation in Operations, Management, Technology and Consulting.
OMTCO works with the highest possible level of expertise – taking into account our know-how and our pragmatic experience from market analysis, competitive projects and professional references.
OMTCO has Oracle licensing expertise at its disposal, in addition to extensive experience in Oracle compliance reviews and customer-sided counter-audits.
Should you wish for advice tailored to your specific needs, raise comments or ask questions, please contact OMTCO at info@omtco.de or call your OMTCO representative directly.
For Software Asset Management, visit:
http://omtco.eu/references/SAM/
For counter-audit experience, visit:
http://omtco.eu/references/counteraudit/
For licensing expertise, visit:
http://omtco.eu/references/licensing/
For further references, visit:
http://www.omtco.eu/references/
This document is current as of the initial date of publication and may be changed by OMTCO at any time. Not all offerings are available in every country in which OMTCO operates. THE INFORMATION IN THIS DOCUMENT IS PROVIDED “AS IS” WITHOUT ANY WARRANTY, EXPRESS OR IMPLIED, INCLUDING NO WARRANTIES OF MERCHANTABILITY, FITNESS FOR A PARTICULAR PURPOSE AND ANY WARRANTY OR CONDITION OF NON-INFRINGEMENT. This report is for information and illustration purposes only. It is not an advisory document and does not take into account your specific customer situation. Please refer to the disclaimer published at http://omtco.eu/disclaimer.

