This is the Version History page. Go back to the CHARTS page to download the latest version.
2011
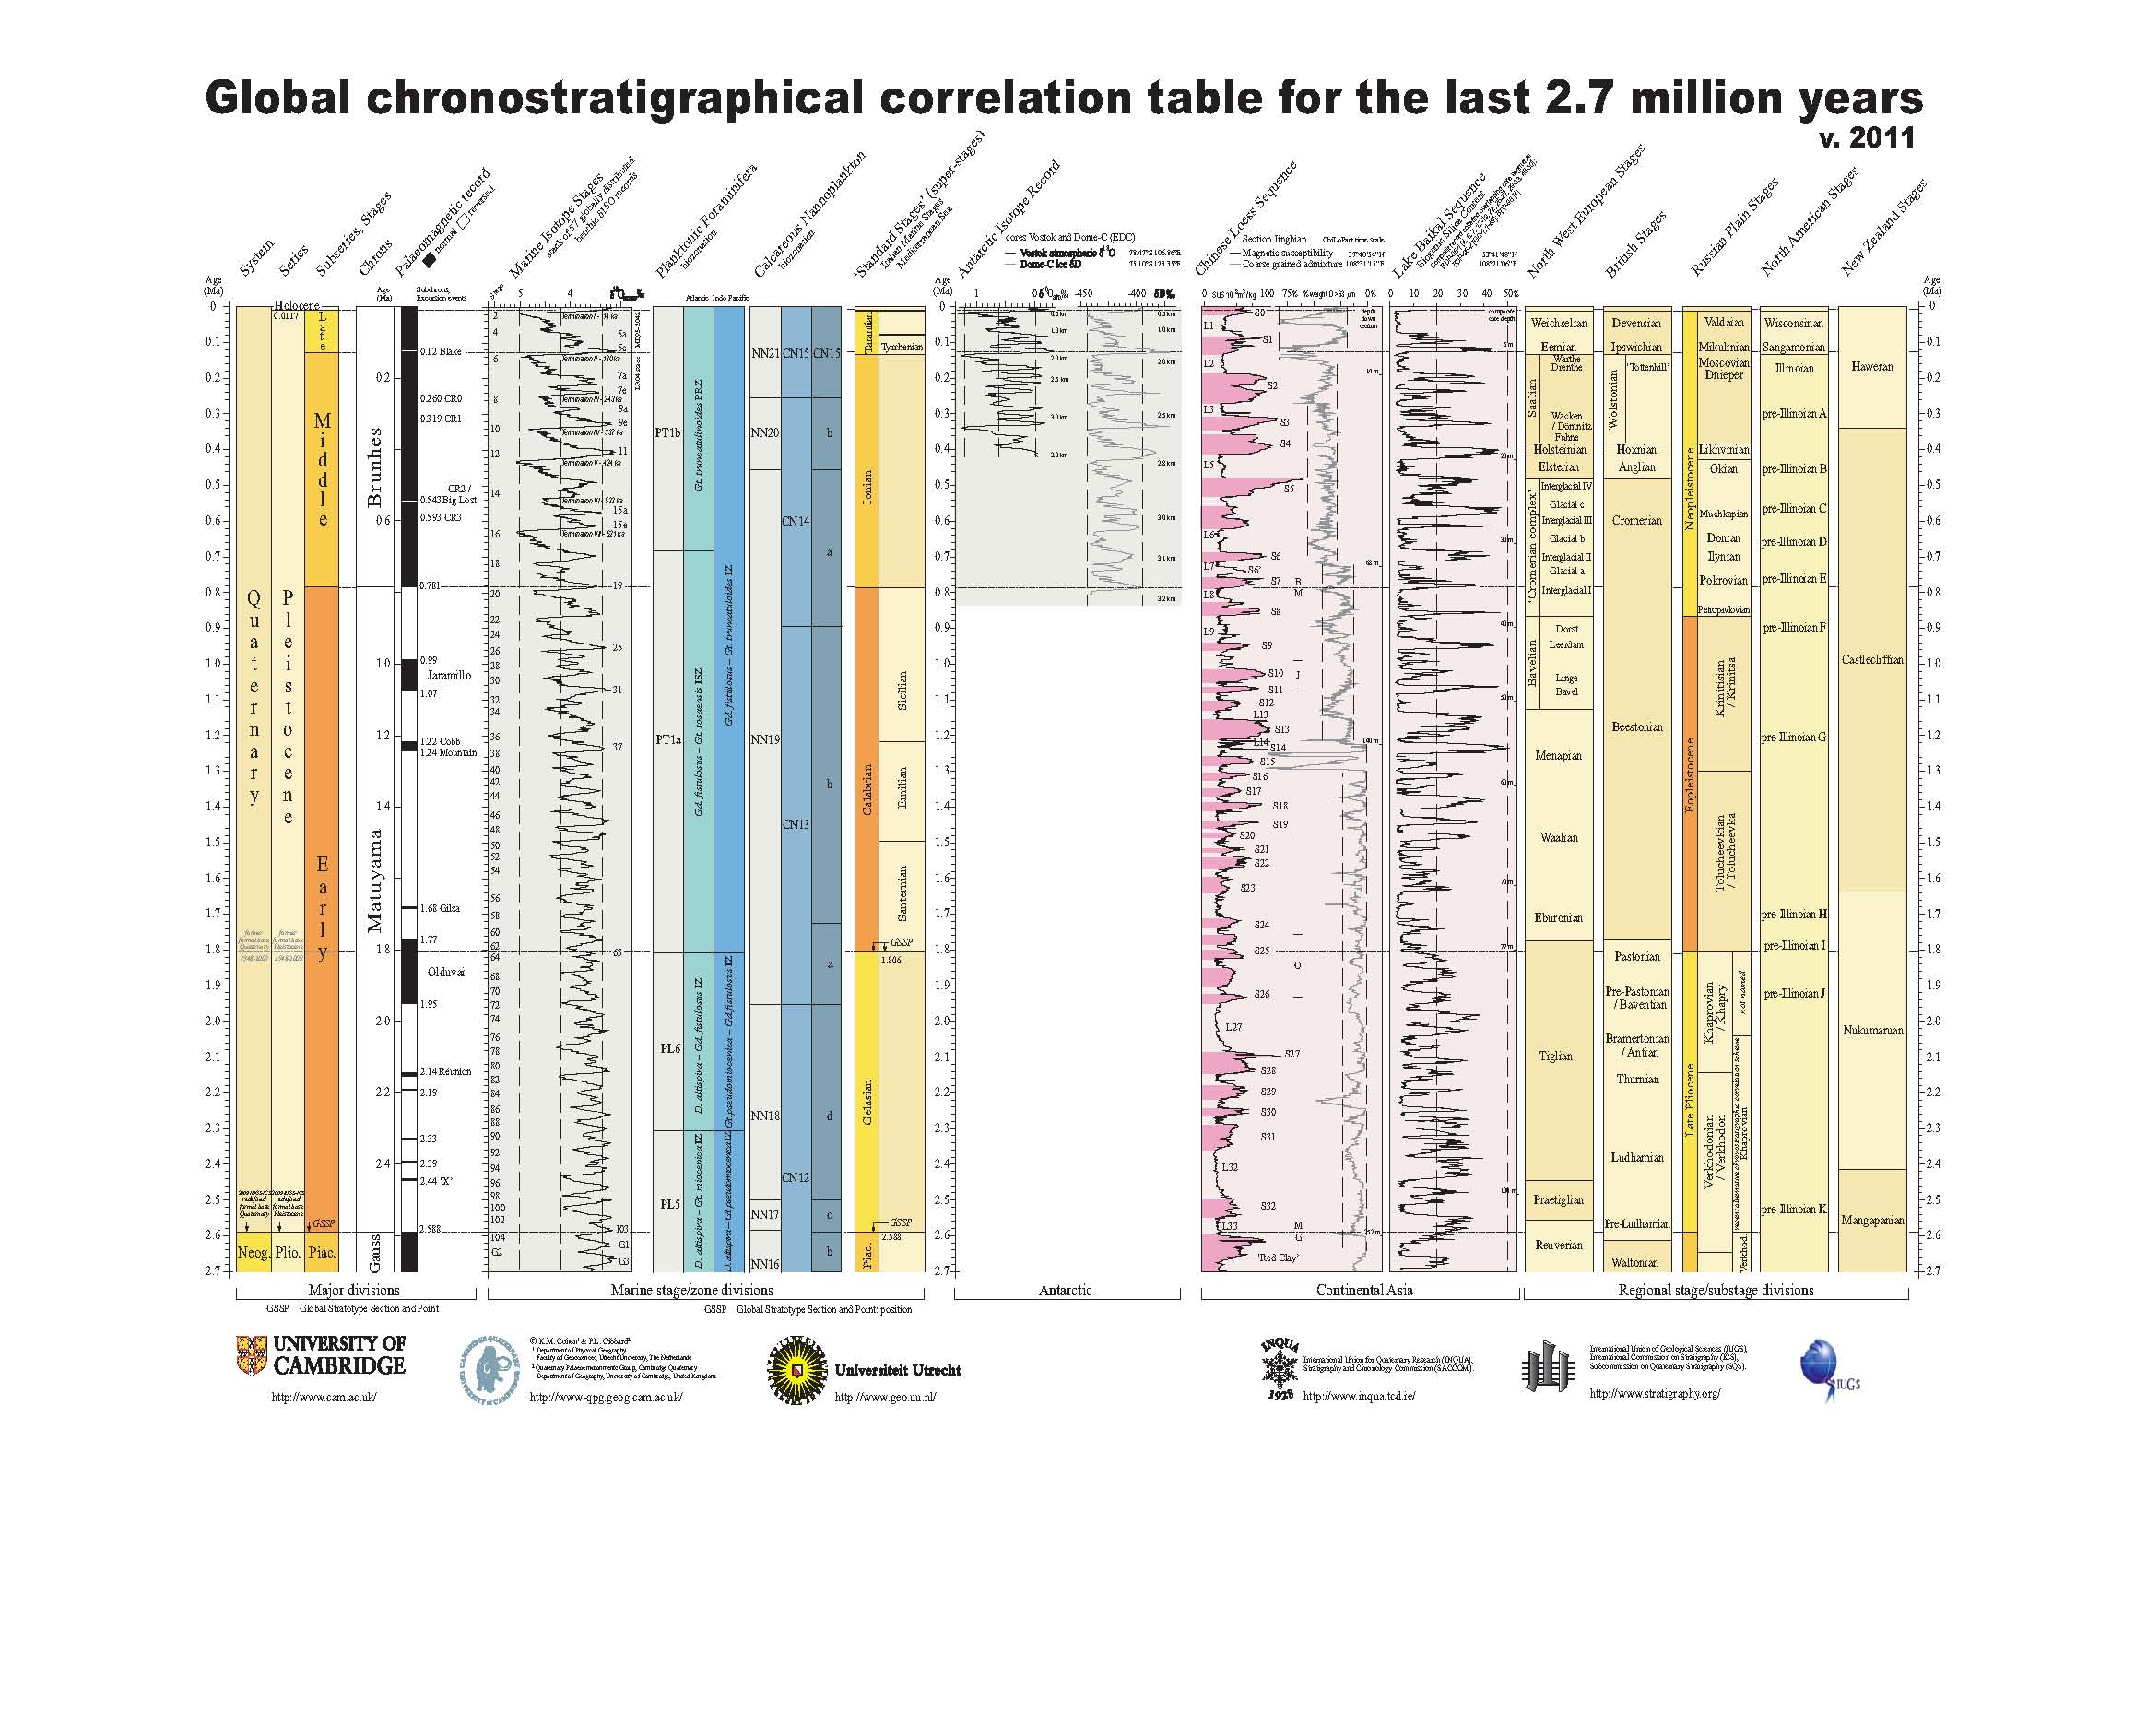
An updated version was produced. Main change:
- An updated plot for Lake Baikal record from Prokopenko et al. (2010) for the period 1.2 to 2.7 Ma was added.
2010
An updated version was produced. Main changes:
- Marine Isotope Stratigraphy curve replaced with the Lisiecki & Raymo (2005) LR04 Stack [was a curve of Crowhurst (2002), modified Tzedakis et al. (2006)].
- Magnetostratigraphic events within Brunhes replaced by Lourens (2004).
- Swapping of author order.

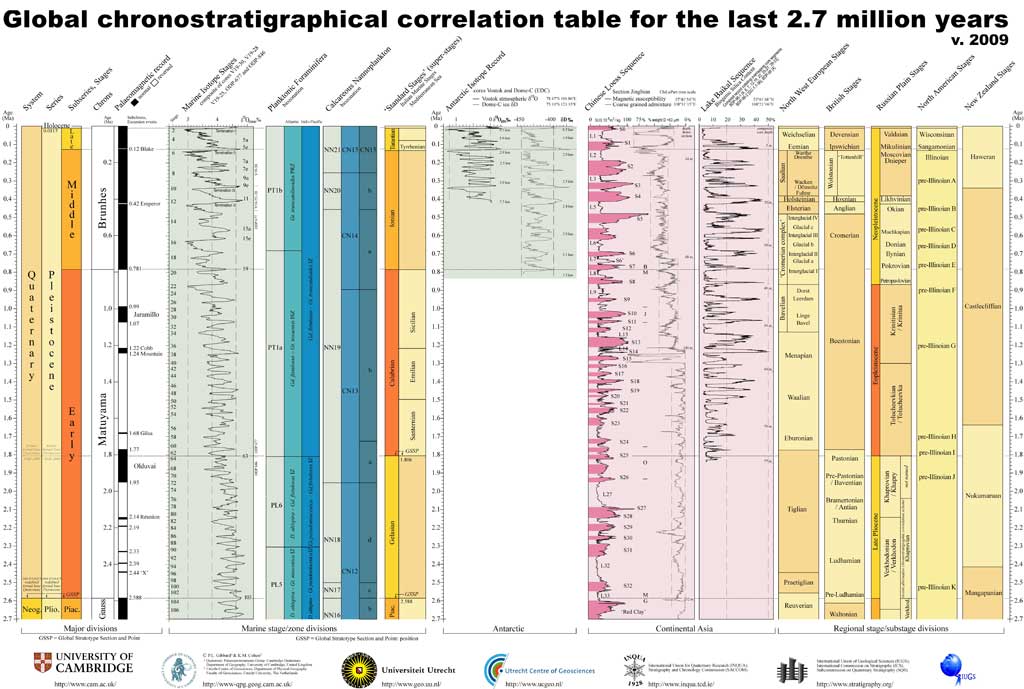
2009
An updated version was produced. Main changes:
- Base Quaternary and Pleistocene cf. IUGS-ratified definitions.
- Chinese Loess sequence updated: grain size record added, mag. susc. record replaced, section location and sequence thickness updated.
2008
A version was produced for the Episodes special issue on the Quaternary (Gibbard & Cohen, 2008). Main changes:
- Lake Baikal biosilica record added.
- In the NW Europe column, Tiglian substages were removed.
- Documentation and referencing updated.
Available for download is: the Episodes article as a PDF (contains chart, documentation and full references)
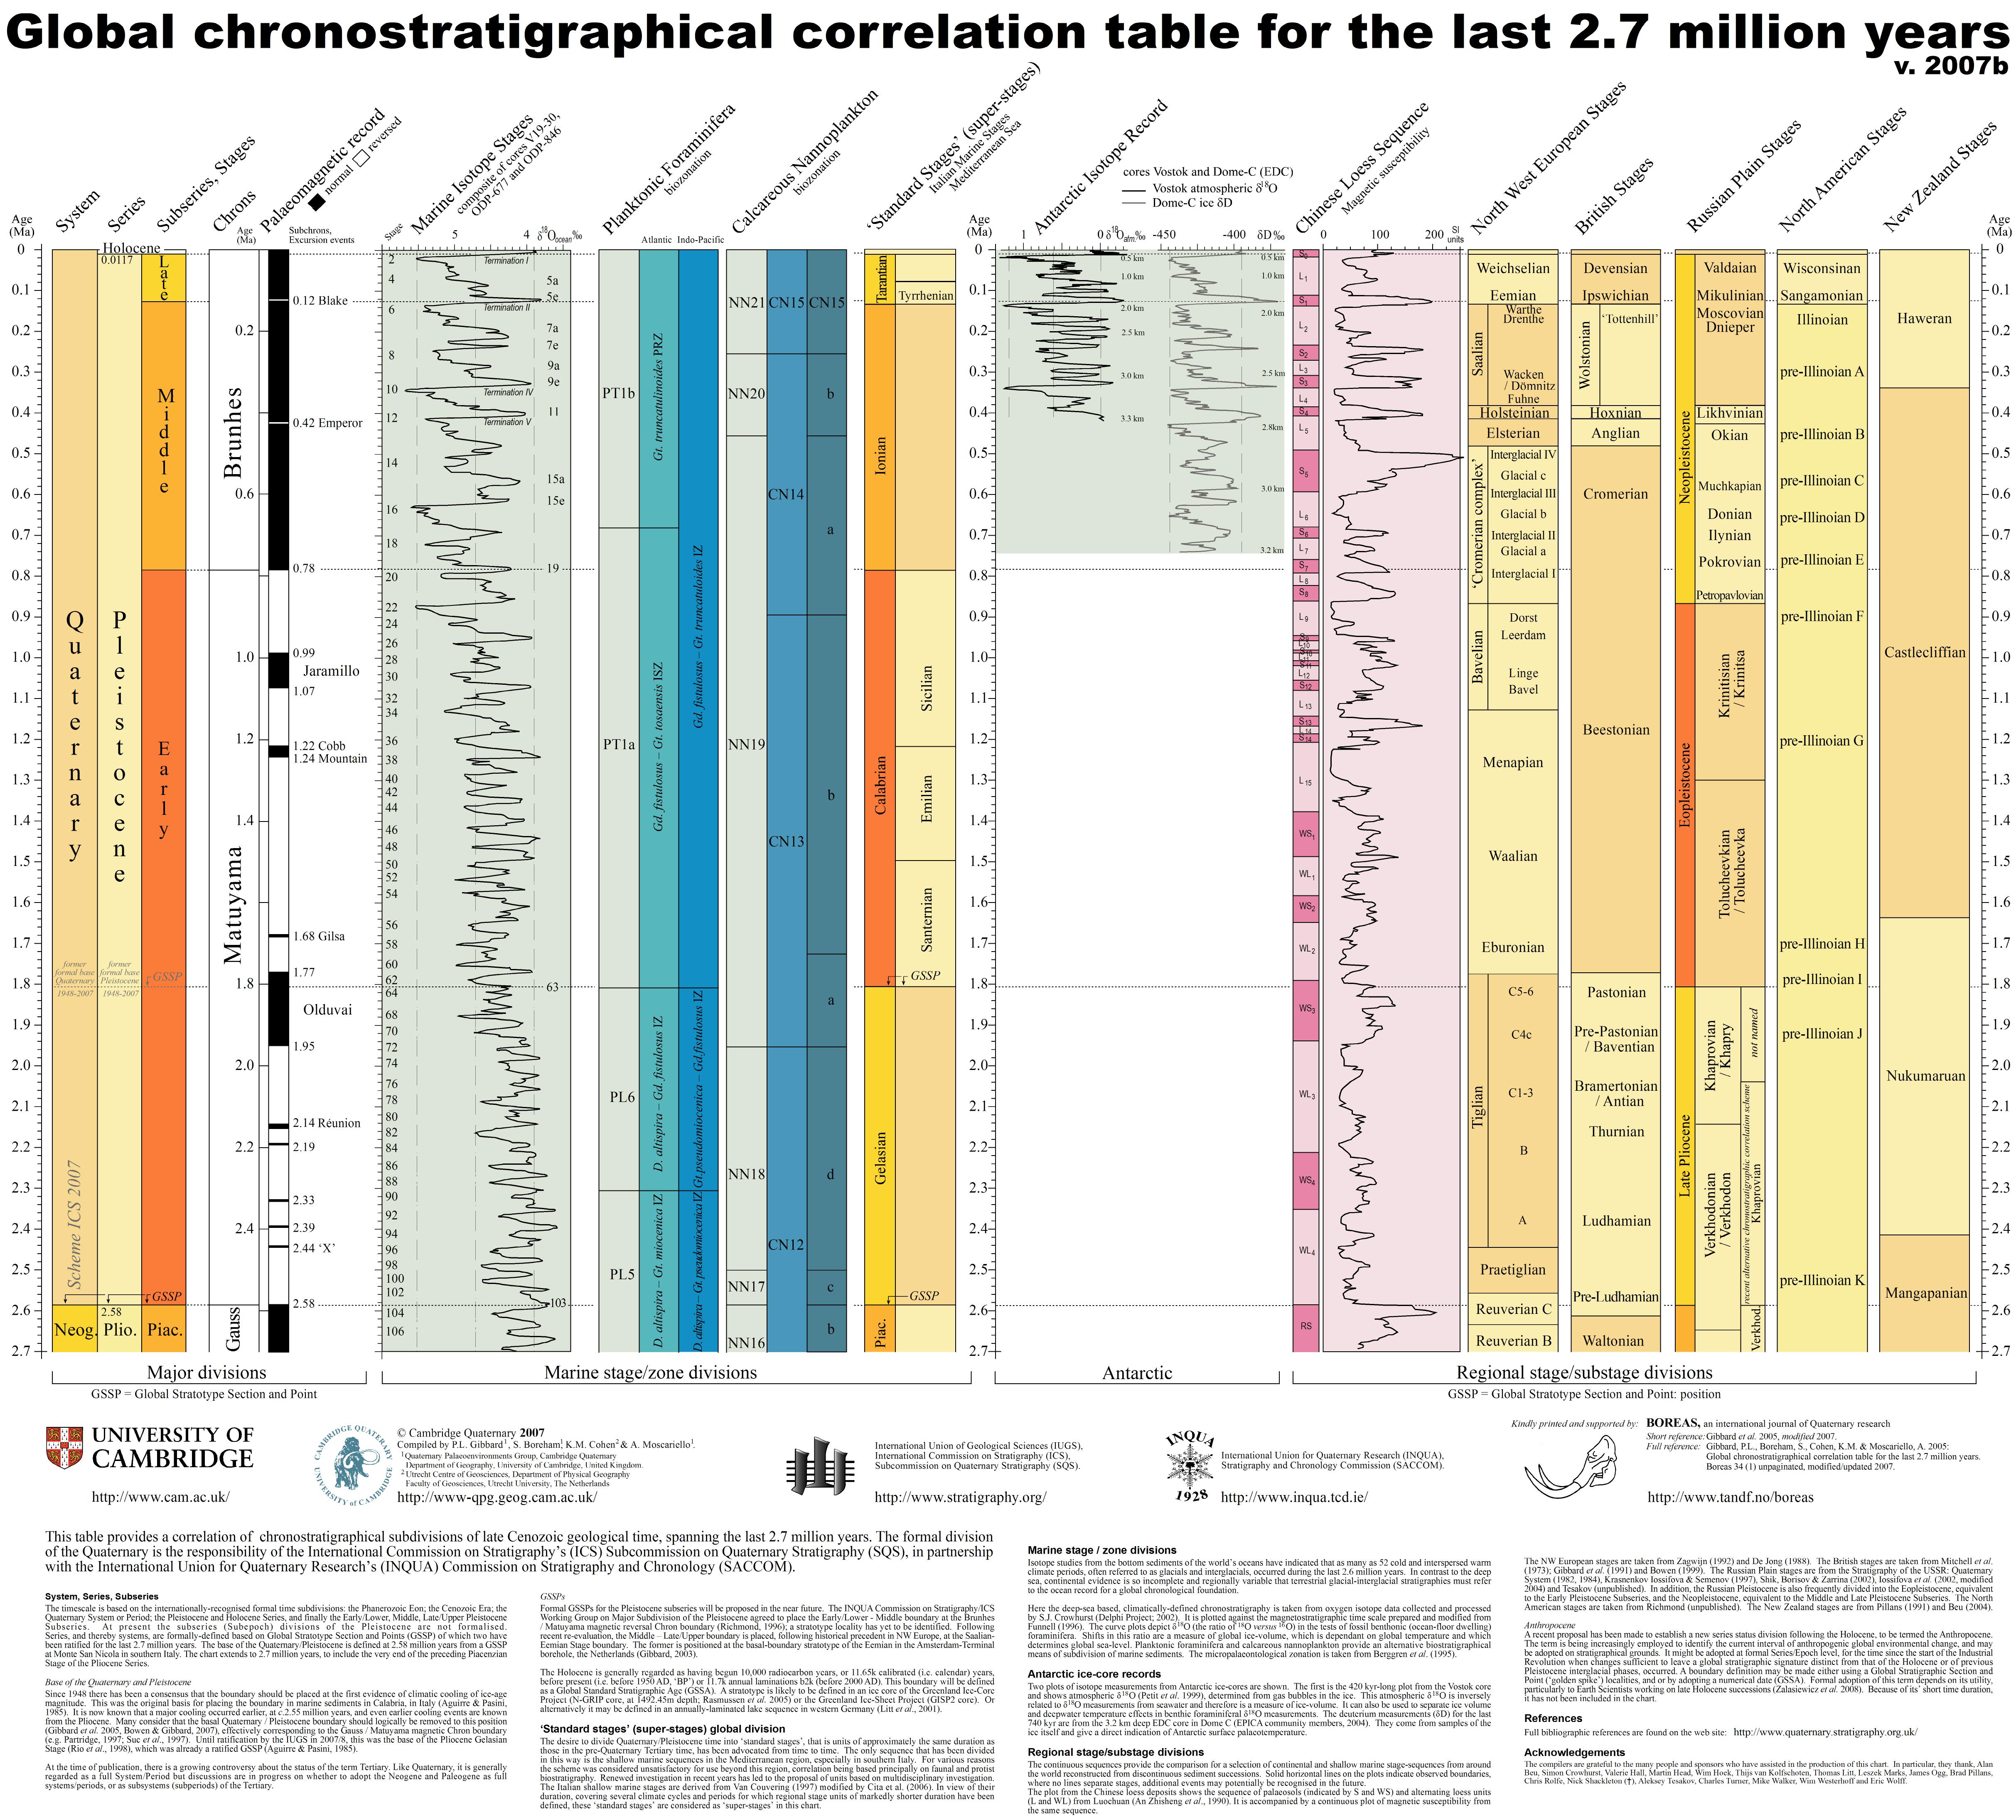
2007
An intermediate version was web-published. Main changes:
- Systems/Series columns show the nomenclature following the ICS formal voting (14.4.07).
- Marine oxygen-isostope curves updated to a new standard composite curve.
- Position of the Italian / Mediterranean ‘Standard Stages’ column moved.
Displayed below is v.2007b in low resolution. For download are: a bigger jpg version (2.4 Mb) | a printable version (PDF).
2005
The 2005 version of the chart was published as an unpaginated inclusion with Boreas volume 34 (1) and web-published on this site.
- In this version some minor errors were fixed (misspelling, numbering of soil-loess complexes skipped a beat).
- Depth down core in the Antarctic ice core records added.
Displayed below is v. 2005c in low resolution. Also available are: bigger JPG version (896 Kb) | a PDF version | Documentation PDF.

2004
The chart was first produced and web-published on this site. It intended to provide a simple pictorial guide to correlation of the chronostratigraphical subdivisions of geological time during the late Cenozoic, to fulfill Task C of the SQS Science Plan. The chart was compiled by P.L. Gibbard, S. Boreham, K.M. Cohen & A. Moscariello.
The printing and distribution of a poster version was supported by Royal Dutch Shell BV. These privately published hard copies ( v. 2004 ) of the chart contained a serious error: the depicted Vostok curve is not the data of Petit et al. 1999, but in fact a benthic foram deep sea marine curve. Version v. 2004b has this corrected.