Briefing Paper #381
Executive Summary
While the rate of short-term unemployment (joblessness lasting less than 27 weeks) has fallen to almost pre-Great Recession levels, the rate of long-term unemployment (joblessness lasting for 27 weeks or more) is still significantly elevated from its pre-Great Recession levels. This has led some economic observers to infer that there is actually less labor market slack in the U.S. economy than the overall rate of unemployment would suggest. This argument hypothesizes that movements in the short-term unemployment (STU) rate are largely cyclically determined, but that the long-term unemployment (LTU) rate is now essentially a component of “structural” unemployment. Structural unemployment is when workers don’t have the skills that employers are currently demanding, do not live where jobs using their skills are located, or face some other barrier to finding work that cannot be solved by an increase in aggregate demand relative to potential supply. Cyclical unemployment, conversely, can be addressed by boosting aggregate demand relative to potential supply.
This briefing paper examines competing explanations for the still-elevated long-term unemployment rate (LTUR) and assesses what if anything the elevated LTUR means for estimates of how much slack remains in the U.S. labor market. Following are the key findings of the paper:
- Evidence from outside of labor market indicators strongly suggests that there is still a continuing, large shortfall of aggregate demand relative to potential supply.
- Measures of core inflation remain extraordinarily low even in the face of historically expansionary monetary policy, signaling substantial economic slack.
- Interest rates remain extraordinarily low, even following years of historically large federal budget deficits, signaling that desired savings remain large relative to planned investments—another sign of economic slack.
- Profit margins are at their highest levels since the 1960s and show little sign of having peaked. If economic slack were falling, we would see increasing downward pressure on profit margins as labor’s share of compensation increases.
- Evidence indicating a rise in structural barriers to finding employment is scarce.
- There is no evidence of an increasing skills mismatch that may be reducing the exit rate from unemployment and therefore increasing the share of the labor force that is long-term unemployed.
- The weight of the evidence shows that the long-term unemployed as a group have put downward pressure on wages, which indicates that they are a meaningful component of remaining cyclical weakness and have not “hardened” into structural unemployment. (In other words, they have not moved from being employable if demand picks up to being unemployable because they no longer have the right skills.)
- Currently, the long-term unemployment rate is almost exactly what would be expected given the historical relationship between the long-term unemployment rate and the overall unemployment rate, and since late 2011, the long-term unemployment rate has in fact fallen faster than what would be predicted. What was unusual was the large increase in the LTUR relative to the overall unemployment rate during the Great Recession and its immediate aftermath. But the timing of this rise alone (i.e., during and immediately after the sharpest and longest economic contraction in seven decades) argues strongly for cyclical causes.
Background
Figure A shows the short-term unemployment rate and the long-term unemployment rate since 1979. As the figure shows, the STUR—the share of workers who have been jobless for less than 27 weeks—has fallen to almost pre-Great Recession levels. But the LTUR—the share of workers who have been jobless for 27 weeks or more—is still significantly elevated from its pre–Great Recession levels. This has people debating why long-term unemployment remains so high.
Short-term and long-term unemployment rates, 1979–2014
| Date | Short-term unemployment rate | Long-term unemployment rate |
|---|---|---|
| 1979/01/01 | 5.3% | 0.5% |
| 1979/02/01 | 5.4% | 0.5% |
| 1979/03/01 | 5.3% | 0.6% |
| 1979/04/01 | 5.3% | 0.5% |
| 1979/05/01 | 5.2% | 0.5% |
| 1979/06/01 | 5.2% | 0.5% |
| 1979/07/01 | 5.3% | 0.4% |
| 1979/08/01 | 5.5% | 0.5% |
| 1979/09/01 | 5.3% | 0.5% |
| 1979/10/01 | 5.4% | 0.5% |
| 1979/11/01 | 5.3% | 0.5% |
| 1979/12/01 | 5.4% | 0.5% |
| 1980/01/01 | 5.7% | 0.5% |
| 1980/02/01 | 5.8% | 0.5% |
| 1980/03/01 | 5.8% | 0.6% |
| 1980/04/01 | 6.3% | 0.6% |
| 1980/05/01 | 6.9% | 0.7% |
| 1980/06/01 | 6.8% | 0.7% |
| 1980/07/01 | 6.9% | 0.8% |
| 1980/08/01 | 6.8% | 0.9% |
| 1980/09/01 | 6.6% | 0.9% |
| 1980/10/01 | 6.5% | 1.0% |
| 1980/11/01 | 6.4% | 1.1% |
| 1980/12/01 | 6.1% | 1.1% |
| 1981/01/01 | 6.3% | 1.2% |
| 1981/02/01 | 6.3% | 1.2% |
| 1981/03/01 | 6.3% | 1.1% |
| 1981/04/01 | 6.2% | 1.0% |
| 1981/05/01 | 6.5% | 1.1% |
| 1981/06/01 | 6.3% | 1.0% |
| 1981/07/01 | 6.3% | 1.0% |
| 1981/08/01 | 6.3% | 1.1% |
| 1981/09/01 | 6.6% | 1.0% |
| 1981/10/01 | 6.9% | 1.0% |
| 1981/11/01 | 7.2% | 1.0% |
| 1981/12/01 | 7.5% | 1.1% |
| 1982/01/01 | 7.5% | 1.1% |
| 1982/02/01 | 7.7% | 1.2% |
| 1982/03/01 | 7.9% | 1.2% |
| 1982/04/01 | 8.0% | 1.4% |
| 1982/05/01 | 8.0% | 1.5% |
| 1982/06/01 | 7.9% | 1.6% |
| 1982/07/01 | 8.1% | 1.6% |
| 1982/08/01 | 8.2% | 1.7% |
| 1982/09/01 | 8.4% | 1.8% |
| 1982/10/01 | 8.4% | 2.0% |
| 1982/11/01 | 8.7% | 2.1% |
| 1982/12/01 | 8.5% | 2.3% |
| 1983/01/01 | 8.1% | 2.4% |
| 1983/02/01 | 8.0% | 2.5% |
| 1983/03/01 | 7.7% | 2.5% |
| 1983/04/01 | 7.5% | 2.5% |
| 1983/05/01 | 7.5% | 2.5% |
| 1983/06/01 | 7.3% | 2.6% |
| 1983/07/01 | 7.2% | 2.3% |
| 1983/08/01 | 7.3% | 2.3% |
| 1983/09/01 | 7.1% | 2.2% |
| 1983/10/01 | 6.8% | 2.0% |
| 1983/11/01 | 6.6% | 1.9% |
| 1983/12/01 | 6.5% | 1.8% |
| 1984/01/01 | 6.3% | 1.8% |
| 1984/02/01 | 6.2% | 1.6% |
| 1984/03/01 | 6.2% | 1.6% |
| 1984/04/01 | 6.1% | 1.6% |
| 1984/05/01 | 5.9% | 1.5% |
| 1984/06/01 | 5.8% | 1.4% |
| 1984/07/01 | 6.1% | 1.4% |
| 1984/08/01 | 6.2% | 1.3% |
| 1984/09/01 | 6.1% | 1.3% |
| 1984/10/01 | 6.1% | 1.3% |
| 1984/11/01 | 5.9% | 1.2% |
| 1984/12/01 | 6.1% | 1.2% |
| 1985/01/01 | 6.2% | 1.1% |
| 1985/02/01 | 6.1% | 1.2% |
| 1985/03/01 | 6.1% | 1.2% |
| 1985/04/01 | 6.1% | 1.2% |
| 1985/05/01 | 6.2% | 1.1% |
| 1985/06/01 | 6.2% | 1.1% |
| 1985/07/01 | 6.2% | 1.1% |
| 1985/08/01 | 6.1% | 1.1% |
| 1985/09/01 | 6.1% | 1.1% |
| 1985/10/01 | 6.1% | 1.0% |
| 1985/11/01 | 5.9% | 1.1% |
| 1985/12/01 | 6.0% | 1.0% |
| 1986/01/01 | 5.8% | 0.9% |
| 1986/02/01 | 6.2% | 1.0% |
| 1986/03/01 | 6.2% | 1.0% |
| 1986/04/01 | 6.2% | 1.0% |
| 1986/05/01 | 6.2% | 1.0% |
| 1986/06/01 | 6.1% | 1.1% |
| 1986/07/01 | 6.0% | 1.0% |
| 1986/08/01 | 5.9% | 1.0% |
| 1986/09/01 | 6.0% | 1.0% |
| 1986/10/01 | 5.9% | 1.0% |
| 1986/11/01 | 5.9% | 1.0% |
| 1986/12/01 | 5.7% | 1.0% |
| 1987/01/01 | 5.7% | 1.0% |
| 1987/02/01 | 5.7% | 0.9% |
| 1987/03/01 | 5.6% | 0.9% |
| 1987/04/01 | 5.4% | 0.9% |
| 1987/05/01 | 5.3% | 0.9% |
| 1987/06/01 | 5.3% | 0.9% |
| 1987/07/01 | 5.3% | 0.8% |
| 1987/08/01 | 5.1% | 0.9% |
| 1987/09/01 | 5.1% | 0.8% |
| 1987/10/01 | 5.2% | 0.8% |
| 1987/11/01 | 5.1% | 0.8% |
| 1987/12/01 | 5.0% | 0.7% |
| 1988/01/01 | 5.0% | 0.7% |
| 1988/02/01 | 5.0% | 0.7% |
| 1988/03/01 | 5.0% | 0.7% |
| 1988/04/01 | 4.8% | 0.7% |
| 1988/05/01 | 4.9% | 0.7% |
| 1988/06/01 | 4.7% | 0.7% |
| 1988/07/01 | 4.8% | 0.7% |
| 1988/08/01 | 4.9% | 0.7% |
| 1988/09/01 | 4.7% | 0.7% |
| 1988/10/01 | 4.7% | 0.6% |
| 1988/11/01 | 4.8% | 0.6% |
| 1988/12/01 | 4.7% | 0.6% |
| 1989/01/01 | 4.8% | 0.6% |
| 1989/02/01 | 4.7% | 0.5% |
| 1989/03/01 | 4.5% | 0.5% |
| 1989/04/01 | 4.7% | 0.6% |
| 1989/05/01 | 4.7% | 0.5% |
| 1989/06/01 | 4.8% | 0.5% |
| 1989/07/01 | 4.8% | 0.5% |
| 1989/08/01 | 4.7% | 0.5% |
| 1989/09/01 | 4.8% | 0.5% |
| 1989/10/01 | 4.8% | 0.5% |
| 1989/11/01 | 4.9% | 0.5% |
| 1989/12/01 | 4.8% | 0.5% |
| 1990/01/01 | 4.8% | 0.5% |
| 1990/02/01 | 4.8% | 0.5% |
| 1990/03/01 | 4.8% | 0.5% |
| 1990/04/01 | 4.9% | 0.5% |
| 1990/05/01 | 4.9% | 0.5% |
| 1990/06/01 | 4.8% | 0.5% |
| 1990/07/01 | 5.0% | 0.5% |
| 1990/08/01 | 5.1% | 0.6% |
| 1990/09/01 | 5.2% | 0.6% |
| 1990/10/01 | 5.3% | 0.6% |
| 1990/11/01 | 5.5% | 0.7% |
| 1990/12/01 | 5.6% | 0.7% |
| 1991/01/01 | 5.6% | 0.7% |
| 1991/02/01 | 5.8% | 0.7% |
| 1991/03/01 | 6.1% | 0.8% |
| 1991/04/01 | 5.9% | 0.8% |
| 1991/05/01 | 6.1% | 0.8% |
| 1991/06/01 | 6.1% | 0.9% |
| 1991/07/01 | 5.9% | 0.9% |
| 1991/08/01 | 5.9% | 0.9% |
| 1991/09/01 | 5.9% | 0.9% |
| 1991/10/01 | 6.0% | 1.0% |
| 1991/11/01 | 6.0% | 1.1% |
| 1991/12/01 | 6.1% | 1.2% |
| 1992/01/01 | 6.0% | 1.3% |
| 1992/02/01 | 6.1% | 1.3% |
| 1992/03/01 | 6.0% | 1.4% |
| 1992/04/01 | 5.9% | 1.4% |
| 1992/05/01 | 6.0% | 1.5% |
| 1992/06/01 | 6.2% | 1.7% |
| 1992/07/01 | 6.0% | 1.7% |
| 1992/08/01 | 6.0% | 1.6% |
| 1992/09/01 | 6.0% | 1.6% |
| 1992/10/01 | 5.7% | 1.7% |
| 1992/11/01 | 5.9% | 1.6% |
| 1992/12/01 | 5.9% | 1.6% |
| 1993/01/01 | 5.7% | 1.5% |
| 1993/02/01 | 5.7% | 1.5% |
| 1993/03/01 | 5.6% | 1.4% |
| 1993/04/01 | 5.7% | 1.3% |
| 1993/05/01 | 5.7% | 1.4% |
| 1993/06/01 | 5.7% | 1.4% |
| 1993/07/01 | 5.5% | 1.4% |
| 1993/08/01 | 5.4% | 1.4% |
| 1993/09/01 | 5.4% | 1.4% |
| 1993/10/01 | 5.5% | 1.4% |
| 1993/11/01 | 5.2% | 1.4% |
| 1993/12/01 | 5.2% | 1.4% |
| 1994/01/01 | 5.3% | 1.3% |
| 1994/02/01 | 5.2% | 1.3% |
| 1994/03/01 | 5.1% | 1.4% |
| 1994/04/01 | 4.9% | 1.3% |
| 1994/05/01 | 4.8% | 1.3% |
| 1994/06/01 | 4.9% | 1.2% |
| 1994/07/01 | 4.9% | 1.2% |
| 1994/08/01 | 4.9% | 1.2% |
| 1994/09/01 | 4.7% | 1.2% |
| 1994/10/01 | 4.6% | 1.2% |
| 1994/11/01 | 4.5% | 1.1% |
| 1994/12/01 | 4.4% | 1.0% |
| 1995/01/01 | 4.5% | 1.0% |
| 1995/02/01 | 4.5% | 0.9% |
| 1995/03/01 | 4.4% | 1.0% |
| 1995/04/01 | 4.6% | 1.1% |
| 1995/05/01 | 4.7% | 1.0% |
| 1995/06/01 | 4.6% | 0.9% |
| 1995/07/01 | 4.7% | 0.9% |
| 1995/08/01 | 4.8% | 0.9% |
| 1995/09/01 | 4.7% | 1.0% |
| 1995/10/01 | 4.6% | 0.9% |
| 1995/11/01 | 4.7% | 0.9% |
| 1995/12/01 | 4.7% | 0.9% |
| 1996/01/01 | 4.7% | 0.9% |
| 1996/02/01 | 4.6% | 0.9% |
| 1996/03/01 | 4.5% | 1.0% |
| 1996/04/01 | 4.5% | 1.0% |
| 1996/05/01 | 4.6% | 1.0% |
| 1996/06/01 | 4.3% | 1.0% |
| 1996/07/01 | 4.4% | 1.0% |
| 1996/08/01 | 4.2% | 0.9% |
| 1996/09/01 | 4.3% | 0.9% |
| 1996/10/01 | 4.4% | 0.9% |
| 1996/11/01 | 4.5% | 0.8% |
| 1996/12/01 | 4.4% | 0.9% |
| 1997/01/01 | 4.4% | 0.8% |
| 1997/02/01 | 4.4% | 0.8% |
| 1997/03/01 | 4.4% | 0.8% |
| 1997/04/01 | 4.2% | 0.8% |
| 1997/05/01 | 4.2% | 0.8% |
| 1997/06/01 | 4.2% | 0.8% |
| 1997/07/01 | 4.1% | 0.8% |
| 1997/08/01 | 4.1% | 0.8% |
| 1997/09/01 | 4.1% | 0.8% |
| 1997/10/01 | 4.0% | 0.8% |
| 1997/11/01 | 3.9% | 0.7% |
| 1997/12/01 | 3.9% | 0.7% |
| 1998/01/01 | 3.9% | 0.7% |
| 1998/02/01 | 3.9% | 0.7% |
| 1998/03/01 | 4.1% | 0.7% |
| 1998/04/01 | 3.7% | 0.6% |
| 1998/05/01 | 3.8% | 0.6% |
| 1998/06/01 | 4.0% | 0.6% |
| 1998/07/01 | 3.9% | 0.6% |
| 1998/08/01 | 3.9% | 0.6% |
| 1998/09/01 | 3.9% | 0.7% |
| 1998/10/01 | 3.9% | 0.6% |
| 1998/11/01 | 3.8% | 0.6% |
| 1998/12/01 | 3.7% | 0.6% |
| 1999/01/01 | 3.8% | 0.5% |
| 1999/02/01 | 3.8% | 0.6% |
| 1999/03/01 | 3.7% | 0.5% |
| 1999/04/01 | 3.9% | 0.5% |
| 1999/05/01 | 3.7% | 0.5% |
| 1999/06/01 | 3.7% | 0.6% |
| 1999/07/01 | 3.7% | 0.5% |
| 1999/08/01 | 3.7% | 0.5% |
| 1999/09/01 | 3.7% | 0.5% |
| 1999/10/01 | 3.6% | 0.5% |
| 1999/11/01 | 3.6% | 0.5% |
| 1999/12/01 | 3.5% | 0.5% |
| 2000/01/01 | 3.5% | 0.5% |
| 2000/02/01 | 3.6% | 0.4% |
| 2000/03/01 | 3.7% | 0.5% |
| 2000/04/01 | 3.5% | 0.4% |
| 2000/05/01 | 3.6% | 0.5% |
| 2000/06/01 | 3.5% | 0.4% |
| 2000/07/01 | 3.5% | 0.5% |
| 2000/08/01 | 3.6% | 0.5% |
| 2000/09/01 | 3.5% | 0.5% |
| 2000/10/01 | 3.5% | 0.4% |
| 2000/11/01 | 3.5% | 0.4% |
| 2000/12/01 | 3.5% | 0.4% |
| 2001/01/01 | 3.7% | 0.5% |
| 2001/02/01 | 3.8% | 0.5% |
| 2001/03/01 | 3.9% | 0.5% |
| 2001/04/01 | 4.0% | 0.5% |
| 2001/05/01 | 3.9% | 0.4% |
| 2001/06/01 | 3.9% | 0.5% |
| 2001/07/01 | 4.0% | 0.5% |
| 2001/08/01 | 4.3% | 0.6% |
| 2001/09/01 | 4.4% | 0.6% |
| 2001/10/01 | 4.7% | 0.6% |
| 2001/11/01 | 4.8% | 0.8% |
| 2001/12/01 | 5.0% | 0.8% |
| 2002/01/01 | 4.9% | 0.8% |
| 2002/02/01 | 4.8% | 0.8% |
| 2002/03/01 | 4.9% | 0.9% |
| 2002/04/01 | 5.0% | 1.0% |
| 2002/05/01 | 4.7% | 1.1% |
| 2002/06/01 | 4.7% | 1.1% |
| 2002/07/01 | 4.7% | 1.1% |
| 2002/08/01 | 4.7% | 1.1% |
| 2002/09/01 | 4.6% | 1.1% |
| 2002/10/01 | 4.6% | 1.1% |
| 2002/11/01 | 4.7% | 1.2% |
| 2002/12/01 | 4.7% | 1.3% |
| 2003/01/01 | 4.7% | 1.2% |
| 2003/02/01 | 4.6% | 1.3% |
| 2003/03/01 | 4.6% | 1.2% |
| 2003/04/01 | 4.7% | 1.3% |
| 2003/05/01 | 4.8% | 1.3% |
| 2003/06/01 | 4.8% | 1.4% |
| 2003/07/01 | 4.8% | 1.3% |
| 2003/08/01 | 4.8% | 1.4% |
| 2003/09/01 | 4.7% | 1.4% |
| 2003/10/01 | 4.6% | 1.3% |
| 2003/11/01 | 4.5% | 1.4% |
| 2003/12/01 | 4.4% | 1.3% |
| 2004/01/01 | 4.4% | 1.3% |
| 2004/02/01 | 4.3% | 1.3% |
| 2004/03/01 | 4.4% | 1.4% |
| 2004/04/01 | 4.3% | 1.2% |
| 2004/05/01 | 4.4% | 1.2% |
| 2004/06/01 | 4.3% | 1.3% |
| 2004/07/01 | 4.4% | 1.1% |
| 2004/08/01 | 4.4% | 1.1% |
| 2004/09/01 | 4.2% | 1.2% |
| 2004/10/01 | 4.3% | 1.2% |
| 2004/11/01 | 4.2% | 1.1% |
| 2004/12/01 | 4.3% | 1.1% |
| 2005/01/01 | 4.1% | 1.1% |
| 2005/02/01 | 4.3% | 1.1% |
| 2005/03/01 | 4.0% | 1.1% |
| 2005/04/01 | 4.1% | 1.1% |
| 2005/05/01 | 4.1% | 1.0% |
| 2005/06/01 | 4.1% | 0.9% |
| 2005/07/01 | 4.0% | 0.9% |
| 2005/08/01 | 4.0% | 0.9% |
| 2005/09/01 | 4.1% | 1.0% |
| 2005/10/01 | 4.1% | 0.9% |
| 2005/11/01 | 4.1% | 0.9% |
| 2005/12/01 | 3.9% | 0.9% |
| 2006/01/01 | 3.9% | 0.8% |
| 2006/02/01 | 3.9% | 0.9% |
| 2006/03/01 | 3.8% | 0.9% |
| 2006/04/01 | 3.9% | 0.9% |
| 2006/05/01 | 3.8% | 0.9% |
| 2006/06/01 | 3.8% | 0.8% |
| 2006/07/01 | 3.9% | 0.9% |
| 2006/08/01 | 3.8% | 0.9% |
| 2006/09/01 | 3.7% | 0.8% |
| 2006/10/01 | 3.7% | 0.7% |
| 2006/11/01 | 3.8% | 0.7% |
| 2006/12/01 | 3.7% | 0.7% |
| 2007/01/01 | 3.8% | 0.7% |
| 2007/02/01 | 3.7% | 0.8% |
| 2007/03/01 | 3.6% | 0.8% |
| 2007/04/01 | 3.7% | 0.8% |
| 2007/05/01 | 3.8% | 0.7% |
| 2007/06/01 | 3.8% | 0.7% |
| 2007/07/01 | 3.8% | 0.8% |
| 2007/08/01 | 3.8% | 0.8% |
| 2007/09/01 | 3.9% | 0.8% |
| 2007/10/01 | 3.9% | 0.8% |
| 2007/11/01 | 3.8% | 0.9% |
| 2007/12/01 | 4.1% | 0.9% |
| 2008/01/01 | 4.0% | 0.9% |
| 2008/02/01 | 4.0% | 0.9% |
| 2008/03/01 | 4.2% | 0.9% |
| 2008/04/01 | 4.1% | 0.9% |
| 2008/05/01 | 4.5% | 1.0% |
| 2008/06/01 | 4.6% | 1.0% |
| 2008/07/01 | 4.6% | 1.1% |
| 2008/08/01 | 4.9% | 1.2% |
| 2008/09/01 | 4.8% | 1.3% |
| 2008/10/01 | 5.1% | 1.5% |
| 2008/11/01 | 5.4% | 1.4% |
| 2008/12/01 | 5.6% | 1.7% |
| 2009/01/01 | 6.0% | 1.8% |
| 2009/02/01 | 6.4% | 1.9% |
| 2009/03/01 | 6.6% | 2.1% |
| 2009/04/01 | 6.5% | 2.4% |
| 2009/05/01 | 6.9% | 2.6% |
| 2009/06/01 | 6.9% | 2.8% |
| 2009/07/01 | 6.2% | 3.2% |
| 2009/08/01 | 6.3% | 3.3% |
| 2009/09/01 | 6.2% | 3.6% |
| 2009/10/01 | 6.4% | 3.7% |
| 2009/11/01 | 5.9% | 3.8% |
| 2009/12/01 | 5.9% | 4.0% |
| 2010/01/01 | 5.8% | 4.1% |
| 2010/02/01 | 5.8% | 4.0% |
| 2010/03/01 | 5.6% | 4.3% |
| 2010/04/01 | 5.3% | 4.4% |
| 2010/05/01 | 5.3% | 4.3% |
| 2010/06/01 | 5.3% | 4.3% |
| 2010/07/01 | 5.2% | 4.2% |
| 2010/08/01 | 5.4% | 4.0% |
| 2010/09/01 | 5.5% | 4.0% |
| 2010/10/01 | 5.5% | 4.1% |
| 2010/11/01 | 5.6% | 4.1% |
| 2010/12/01 | 5.2% | 4.2% |
| 2011/01/01 | 5.2% | 4.1% |
| 2011/02/01 | 5.1% | 3.9% |
| 2011/03/01 | 4.9% | 4.0% |
| 2011/04/01 | 5.1% | 3.8% |
| 2011/05/01 | 5.0% | 4.0% |
| 2011/06/01 | 5.1% | 4.0% |
| 2011/07/01 | 5.0% | 4.0% |
| 2011/08/01 | 5.1% | 3.9% |
| 2011/09/01 | 5.0% | 4.1% |
| 2011/10/01 | 5.1% | 3.8% |
| 2011/11/01 | 4.9% | 3.7% |
| 2011/12/01 | 4.9% | 3.6% |
| 2012/01/01 | 4.7% | 3.6% |
| 2012/02/01 | 4.8% | 3.5% |
| 2012/03/01 | 4.8% | 3.4% |
| 2012/04/01 | 4.8% | 3.3% |
| 2012/05/01 | 4.7% | 3.5% |
| 2012/06/01 | 4.8% | 3.4% |
| 2012/07/01 | 4.9% | 3.3% |
| 2012/08/01 | 4.9% | 3.2% |
| 2012/09/01 | 4.6% | 3.1% |
| 2012/10/01 | 4.7% | 3.2% |
| 2012/11/01 | 4.6% | 3.1% |
| 2012/12/01 | 4.8% | 3.1% |
| 2013/01/01 | 4.9% | 3.0% |
| 2013/02/01 | 4.6% | 3.1% |
| 2013/03/01 | 4.6% | 3.0% |
| 2013/04/01 | 4.7% | 2.8% |
| 2013/05/01 | 4.7% | 2.8% |
| 2013/06/01 | 4.8% | 2.8% |
| 2013/07/01 | 4.6% | 2.7% |
| 2013/08/01 | 4.5% | 2.7% |
| 2013/09/01 | 4.5% | 2.7% |
| 2013/10/01 | 4.7% | 2.6% |
| 2013/11/01 | 4.4% | 2.6% |
| 2013/12/01 | 4.1% | 2.5% |
| 2014/01/01 | 4.2% | 2.3% |
| 2014/02/01 | 4.2% | 2.5% |
| 2014/03/01 | 4.3% | 2.4% |
| 2014/04/01 | 4.1% | 2.2% |
| 2014/05/01 | 4.1% | 2.2% |
| 2014/06/01 | 4.0% | 2.0% |
Note: Shaded areas denote recessions.
Source: Authors' analysis of the Current Population Survey public data series from the Bureau of Labor Statistics
To understand why, we need to look at the patterns. While both rates clearly move in tandem over the business cycle, the large increase in the LTUR between the spring of 2008 and the spring of 2010 is striking. This very large increase during (and immediately after) the Great Recession has led to an elevated LTUR over an extended period, even as it has largely followed the STUR down over the official recovery.
The simple timing of these patterns suggests that the real discontinuity with historical patterns that needs to be explained is the large rise in the LTUR during the Great Recession and its immediate aftermath and not the behavior of the LTUR today. This is an important insight for current debates over the extent of labor market slack remaining in the U.S. economy. The argument that slack has been substantially reduced hinges largely on believing that the long-term unemployed are so scarred and disconnected from labor markets that they effectively put no downward pressure on wage and price growth (i.e., they have become unemployable so they are essentially not competing for available jobs). This argument implicitly relies on believing that today’s elevated LTUR is largely “structural,” e.g., reflecting mismatches between workers’ skills or location with the skills or location of available jobs. Further, the argument is often presented as if the LTUR has been stubbornly unresponsive to the modest improvements in the overall economy in recent years.
If instead today’s elevated LTUR is simply a legacy of the very large rise in LTU that occurred during (and immediately after) the Great Recession, then this interpretation should not stand. Particularly, if the LTUR has over the course of the recovery actually fallen at a pace that matches or exceeds the pace that would be predicted by the historical relationship between it and other measures of macroeconomic health, this argues strongly against two key ideas: the idea that the long-term unemployed have metastasized into a group that is largely disconnected from labor markets, and the idea that measures to boost aggregate demand would not continue to reduce the long-term unemployment rate.
A key piece of evidence we will return to often in this report regards the behavior of wage and price inflation. The entire debate regarding the actual remaining degree of productive slack in the U.S. economy is a debate about whether or not further boosts to aggregate demand will spur more economic activity and employment or simply lead to an increase in nominal wages and prices. If elevated unemployment (especially long-term unemployment) since the Great Recession has evolved from cyclical to structural unemployment, then measures to boost demand will indeed just put upward pressure on prices and wages without spurring significant increases in activity and employment.
The rest of this report will consist of three sections. The first examines macroeconomic evidence outside of the labor market to assess the hypothesis that there remains a large gap between aggregate demand and potential supply. If evidence from outside the labor market indicates the presence of such a gap, then it seems quite likely that a large part of remaining labor market weakness is due to this demand shortfall. The next section examines whether labor market indicators point to a growing incidence of “structural” factors that are reducing the exit rate from unemployment and therefore increasing the share of the labor force that is long-term unemployed, which would support the notion that the LTU have hardened into a problem that is not solvable simply by boosting demand. The final section looks directly at the behavior of the unemployment rate and the long-term unemployment rate over the Great Recession and recovery to see whether there are changes in the historical relationship between these rates that would suggest that the long-term unemployed no longer constitute a reliable indicator of labor market slack.
Macroeconomic evidence from outside the labor market strongly suggests a large gap between demand and supply
A key reason why observers have begun to focus on the still-elevated LTUR is that they consider it a possible diagnostic for how much productive slack remains in the U.S. economy. This section examines the issue of slack using a number of indicators from outside the labor market.
Direct estimates of productive capacity
Figure B displays the most direct attempt to measure economic slack—the ratio of actual gross domestic product (GDP) to potential GDP (also known as overall capacity utilization) as measured by the Congressional Budget Office (CBO). Potential GDP is an estimate of how much the U.S. economy could produce if the unemployment rate was at the lowest level consistent with stable inflation. The gap between actual and potential GDP (1 minus the ratio of actual to potential GDP) is the “output gap,” the most direct measure of the demand shortfall in the economy. Hence a falling ratio represents a rising output gap.
Ratio of actual/potential GDP, 2000–2014
| Quarter | Actual/potential GDP |
|---|---|
| 2000/01/01 | 1.025 |
| 2000/04/01 | 1.035 |
| 2000/07/01 | 1.027 |
| 2000/10/01 | 1.024 |
| 2001/01/01 | 1.012 |
| 2001/04/01 | 1.008 |
| 2001/07/01 | 0.996 |
| 2001/10/01 | 0.990 |
| 2002/01/01 | 0.991 |
| 2002/04/01 | 0.988 |
| 2002/07/01 | 0.984 |
| 2002/10/01 | 0.977 |
| 2003/01/01 | 0.975 |
| 2003/04/01 | 0.976 |
| 2003/07/01 | 0.986 |
| 2003/10/01 | 0.990 |
| 2004/01/01 | 0.990 |
| 2004/04/01 | 0.991 |
| 2004/07/01 | 0.994 |
| 2004/10/01 | 0.997 |
| 2005/01/01 | 1.001 |
| 2005/04/01 | 1.000 |
| 2005/07/01 | 1.003 |
| 2005/10/01 | 1.003 |
| 2006/01/01 | 1.009 |
| 2006/04/01 | 1.006 |
| 2006/07/01 | 1.001 |
| 2006/10/01 | 1.003 |
| 2007/01/01 | 0.997 |
| 2007/04/01 | 0.999 |
| 2007/07/01 | 0.999 |
| 2007/10/01 | 0.997 |
| 2008/01/01 | 0.984 |
| 2008/04/01 | 0.984 |
| 2008/07/01 | 0.974 |
| 2008/10/01 | 0.949 |
| 2009/01/01 | 0.931 |
| 2009/04/01 | 0.926 |
| 2009/07/01 | 0.926 |
| 2009/10/01 | 0.931 |
| 2010/01/01 | 0.932 |
| 2010/04/01 | 0.938 |
| 2010/07/01 | 0.941 |
| 2010/10/01 | 0.944 |
| 2011/01/01 | 0.937 |
| 2011/04/01 | 0.940 |
| 2011/07/01 | 0.939 |
| 2011/10/01 | 0.946 |
| 2012/01/01 | 0.947 |
| 2012/04/01 | 0.947 |
| 2012/07/01 | 0.949 |
| 2012/10/01 | 0.945 |
| 2013/01/01 | 0.948 |
| 2013/04/01 | 0.948 |
| 2013/07/01 | 0.955 |
| 2013/10/01 | 0.959 |
| 2014/01/01 | 0.950 |
| 2014/04/01 | 0.955 |
Note: Shaded areas denote recessions.
Source: Current Population Survey public data series
The figure shows that only about half of the historically large output gap between actual and potential GDP that developed during the Great Recession has been closed. Further, even this shrinkage of the CBO-measured output gap may understate remaining slack. Traditionally, output gaps following recessions close as actual GDP grows faster than estimates of long-run trend growth that characterize potential GDP. But actual GDP has not grown faster than estimates of long-run trends that prevailed before the Great Recession. Instead, the CBO has progressively marked down its estimates of this long-run trend, as shown in Figure C.
Actual and CBO estimates of potential GDP, 2008–2014
| 2008 | 2010 | 2012 | 2014 | Actual | |
|---|---|---|---|---|---|
| 2007 Q4 | 100.0 | 100.0 | 100.0 | 100.0 | 100.0 |
| 2008 Q1 | 100.7 | 100.6 | 100.6 | 100.6 | 99.3 |
| 2008 Q2 | 101.4 | 101.2 | 101.1 | 101.1 | 99.8 |
| 2008 Q3 | 102.1 | 101.9 | 101.7 | 101.7 | 99.3 |
| 2008 Q4 | 102.7 | 102.4 | 102.2 | 102.2 | 97.2 |
| 2009 Q1 | 103.4 | 103.0 | 102.7 | 102.6 | 95.8 |
| 2009 Q2 | 104.1 | 103.5 | 103.2 | 103.1 | 95.7 |
| 2009 Q3 | 104.8 | 104.0 | 103.6 | 103.5 | 96.0 |
| 2009 Q4 | 105.5 | 104.5 | 104.0 | 103.8 | 97.0 |
| 2010 Q1 | 106.2 | 104.9 | 104.4 | 104.2 | 97.3 |
| 2010 Q2 | 106.8 | 105.3 | 104.7 | 104.5 | 98.3 |
| 2010 Q3 | 107.5 | 105.7 | 105.1 | 104.9 | 99.0 |
| 2010 Q4 | 108.2 | 106.1 | 105.5 | 105.2 | 99.6 |
| 2011 Q1 | 108.9 | 106.5 | 105.9 | 105.6 | 99.3 |
| 2011 Q2 | 109.6 | 107.0 | 106.4 | 106.0 | 100.1 |
| 2011 Q3 | 110.3 | 107.4 | 106.9 | 106.4 | 100.4 |
| 2011 Q4 | 111.1 | 107.9 | 107.3 | 106.8 | 101.6 |
| 2012 Q1 | 111.8 | 108.5 | 107.8 | 107.2 | 102.6 |
| 2012 Q2 | 112.5 | 109.0 | 108.3 | 107.7 | 102.9 |
| 2012 Q3 | 113.2 | 109.6 | 108.8 | 108.1 | 103.6 |
| 2012 Q4 | 114.0 | 110.3 | 109.3 | 108.6 | 103.6 |
| 2013 Q1 | 114.7 | 110.9 | 109.8 | 109.0 | 103.9 |
| 2013 Q2 | 115.4 | 111.6 | 110.3 | 109.5 | 104.6 |
| 2013 Q3 | 116.2 | 112.3 | 110.8 | 109.9 | 105.6 |
| 2013 Q4 | 116.9 | 113.0 | 111.4 | 110.4 | 106.3 |
| 2014 Q1 | 117.7 | 113.7 | 112.0 | 110.9 | 105.5 |
Source: Congressional Budget Office's Budget and Economic Outlook and Bureau of Economic Analysis National Income and Product Accounts (Table 1.1.6)
It is hard to imagine that the CBO would decrease estimates of long-run trend growth for any other reason than for the influence of the Great Recession itself. Long-run economic growth trends generally reflect estimates of labor force growth and productivity (which is the product of investment in human and physical capital as well as technological improvement). Labor force growth absent persistent demand shortfalls should be determined by long-run demographic trends that are relatively easy to predict (and thus not likely a factor in subsequent ratcheting down of growth estimates). This leaves productivity growth as a cause of the decreasing estimates. The decline in CBO estimates of potential output reflects in part the depressed capital investment in recent years—investment that was depressed precisely because of the Great Recession. But if policymakers managed to engineer a robust recovery in aggregate demand, capital investment would surely increase.
This interpretation is buttressed by research from Ball (2009), who examined potential output of 20 countries between 1980 and 2009. A key finding of his research is that declines in potential GDP that are caused by extended periods of slow demand growth (slow relative to growth in potential capacity, that is) can actually be reversed by extended periods of rapid demand growth. Crucially, this extended period of above-trend demand growth does not lead to ever-accelerating inflation, as measured by the nonaccelerating rate of unemployment (NAIRU). 1As Ball (2009) writes:
An important nuance is that the inflation run-ups in the U.K. and elsewhere [which saw increases in potential output following periods of rapid demand growth] were not permanent [emphasis added]. A period of overheating and rising inflation was needed to reduce the NAIRU, but eventually inflation went back down. And when that happened, the NAIRU did not go back up.
Measures of price inflation
Measures of potential output and the corresponding NAIRU are ex ante estimates of the level of output and unemployment consistent with stable inflation. They could, of course, prove to be wrong ex post if inflation begins rising more rapidly before measures of full capacity or full employment are reached. This naturally implies that the previous examination of output gaps should also be accompanied by an examination of the underlying trends in core price inflation.
Figure D shows a number of measures of core price growth. The evidence for the last 12–18 months argues strongly against the view that productive slack in the economy is rapidly being worked off. Normally, any such tightening of productive capacity would lead to discernible upward pressure on prices. Instead, the chart shows little sign that core inflation measures have appreciably accelerated in recent quarters.
Year-over-year change in core prices measures, 1979–2014*
| Core personal consumption expenditures price index* | Core consumer price index* | Unit labor costs** | |
|---|---|---|---|
| 1979 Q1 | 0.067747 | 0.090047 | 0.07408 |
| 1979 Q2 | 0.072511 | 0.093718 | 0.077562 |
| 1979 Q3 | 0.073737 | 0.098187 | 0.084293 |
| 1979 Q4 | 0.076726 | 0.106844 | 0.082682 |
| 1980 Q1 | 0.088185 | 0.121739 | 0.080257 |
| 1980 Q2 | 0.08862 | 0.132768 | 0.09826 |
| 1980 Q3 | 0.092693 | 0.120587 | 0.101734 |
| 1980 Q4 | 0.096462 | 0.121886 | 0.101997 |
| 1981 Q1 | 0.094145 | 0.107235 | 0.089927 |
| 1981 Q2 | 0.090352 | 0.094347 | 0.091502 |
| 1981 Q3 | 0.086208 | 0.114975 | 0.08457 |
| 1981 Q4 | 0.079162 | 0.1023 | 0.086214 |
| 1982 Q1 | 0.071016 | 0.090626 | 0.089879 |
| 1982 Q2 | 0.0654 | 0.086973 | 0.07698 |
| 1982 Q3 | 0.062956 | 0.068257 | 0.072475 |
| 1982 Q4 | 0.059162 | 0.052158 | 0.066085 |
| 1983 Q1 | 0.058278 | 0.047076 | 0.06283 |
| 1983 Q2 | 0.052351 | 0.035989 | 0.048617 |
| 1983 Q3 | 0.051588 | 0.031604 | 0.045335 |
| 1983 Q4 | 0.045361 | 0.042735 | 0.033852 |
| 1984 Q1 | 0.041693 | 0.048706 | 0.024441 |
| 1984 Q2 | 0.04579 | 0.050927 | 0.022244 |
| 1984 Q3 | 0.039806 | 0.050616 | 0.019964 |
| 1984 Q4 | 0.038944 | 0.047541 | 0.019654 |
| 1985 Q1 | 0.04283 | 0.046444 | 0.024234 |
| 1985 Q2 | 0.040075 | 0.044929 | 0.029097 |
| 1985 Q3 | 0.041102 | 0.040887 | 0.028819 |
| 1985 Q4 | 0.040935 | 0.042879 | 0.0334 |
| 1986 Q1 | 0.037882 | 0.04221 | 0.030298 |
| 1986 Q2 | 0.035388 | 0.040233 | 0.030876 |
| 1986 Q3 | 0.03151 | 0.040804 | 0.029698 |
| 1986 Q4 | 0.032505 | 0.038415 | 0.03376 |
| 1987 Q1 | 0.027778 | 0.038416 | 0.032965 |
| 1987 Q2 | 0.03075 | 0.041335 | 0.031235 |
| 1987 Q3 | 0.033021 | 0.041545 | 0.03381 |
| 1987 Q4 | 0.035398 | 0.043353 | 0.030955 |
| 1988 Q1 | 0.038753 | 0.043304 | 0.034862 |
| 1988 Q2 | 0.041415 | 0.043663 | 0.038677 |
| 1988 Q3 | 0.044168 | 0.044382 | 0.040009 |
| 1988 Q4 | 0.044918 | 0.045152 | 0.035032 |
| 1989 Q1 | 0.046039 | 0.047004 | 0.032719 |
| 1989 Q2 | 0.042707 | 0.045368 | 0.032425 |
| 1989 Q3 | 0.038247 | 0.044379 | 0.03163 |
| 1989 Q4 | 0.036229 | 0.043467 | 0.033447 |
| 1990 Q1 | 0.036926 | 0.046731 | 0.034034 |
| 1990 Q2 | 0.039145 | 0.048337 | 0.034129 |
| 1990 Q3 | 0.041982 | 0.053567 | 0.034056 |
| 1990 Q4 | 0.041169 | 0.052324 | 0.038824 |
| 1991 Q1 | 0.038324 | 0.054929 | 0.039923 |
| 1991 Q2 | 0.034708 | 0.050818 | 0.04113 |
| 1991 Q3 | 0.033699 | 0.046443 | 0.041074 |
| 1991 Q4 | 0.033162 | 0.044412 | 0.038502 |
| 1992 Q1 | 0.032155 | 0.038754 | 0.036042 |
| 1992 Q2 | 0.031645 | 0.038452 | 0.031142 |
| 1992 Q3 | 0.028541 | 0.035039 | 0.027899 |
| 1992 Q4 | 0.028168 | 0.034204 | 0.021737 |
| 1993 Q1 | 0.027515 | 0.034791 | 0.018247 |
| 1993 Q2 | 0.028106 | 0.034075 | 0.021328 |
| 1993 Q3 | 0.02779 | 0.032498 | 0.019602 |
| 1993 Q4 | 0.025471 | 0.030838 | 0.016426 |
| 1994 Q1 | 0.023035 | 0.028755 | 0.009565 |
| 1994 Q2 | 0.022113 | 0.028339 | 0.011518 |
| 1994 Q3 | 0.022043 | 0.02929 | 0.012206 |
| 1994 Q4 | 0.021996 | 0.027748 | 0.010446 |
| 1995 Q1 | 0.022648 | 0.029241 | 0.014473 |
| 1995 Q2 | 0.021661 | 0.030549 | 0.010458 |
| 1995 Q3 | 0.020774 | 0.029518 | 0.011697 |
| 1995 Q4 | 0.020708 | 0.030373 | 0.012405 |
| 1996 Q1 | 0.01956 | 0.028828 | 0.018219 |
| 1996 Q2 | 0.018476 | 0.026741 | 0.013865 |
| 1996 Q3 | 0.018377 | 0.026609 | 0.014271 |
| 1996 Q4 | 0.019008 | 0.025998 | 0.016924 |
| 1997 Q1 | 0.018932 | 0.024975 | 0.017789 |
| 1997 Q2 | 0.019422 | 0.025439 | 0.015188 |
| 1997 Q3 | 0.01707 | 0.022905 | 0.014022 |
| 1997 Q4 | 0.014525 | 0.022147 | 0.018965 |
| 1998 Q1 | 0.013366 | 0.021989 | 0.021307 |
| 1998 Q2 | 0.011227 | 0.022052 | 0.025826 |
| 1998 Q3 | 0.012468 | 0.023964 | 0.024667 |
| 1998 Q4 | 0.012405 | 0.023424 | 0.022778 |
| 1999 Q1 | 0.012872 | 0.021903 | 0.020919 |
| 1999 Q2 | 0.012942 | 0.020998 | 0.023307 |
| 1999 Q3 | 0.012885 | 0.01995 | 0.022485 |
| 1999 Q4 | 0.014384 | 0.020217 | 0.018743 |
| 2000 Q1 | 0.016691 | 0.022003 | 0.030139 |
| 2000 Q2 | 0.016868 | 0.024151 | 0.020008 |
| 2000 Q3 | 0.018021 | 0.025578 | 0.027254 |
| 2000 Q4 | 0.018297 | 0.025612 | 0.025982 |
| 2001 Q1 | 0.018446 | 0.026726 | 0.034791 |
| 2001 Q2 | 0.019072 | 0.026161 | 0.029748 |
| 2001 Q3 | 0.017337 | 0.026774 | 0.028867 |
| 2001 Q4 | 0.017605 | 0.02716 | 0.025848 |
| 2002 Q1 | 0.014767 | 0.025307 | 0.005524 |
| 2002 Q2 | 0.016742 | 0.024417 | 0.014929 |
| 2002 Q3 | 0.019091 | 0.022683 | 0.006047 |
| 2002 Q4 | 0.017462 | 0.020408 | 0.009943 |
| 2003 Q1 | 0.017033 | 0.017807 | -0.00149 |
| 2003 Q2 | 0.014787 | 0.015247 | 0.004489 |
| 2003 Q3 | 0.013655 | 0.013447 | 0.003763 |
| 2003 Q4 | 0.013676 | 0.011826 | 0.007043 |
| 2004 Q1 | 0.016692 | 0.013338 | 0.011155 |
| 2004 Q2 | 0.019163 | 0.01778 | 0.013479 |
| 2004 Q3 | 0.019725 | 0.018094 | 0.019938 |
| 2004 Q4 | 0.020929 | 0.021141 | 0.017049 |
| 2005 Q1 | 0.021916 | 0.023248 | 0.016475 |
| 2005 Q2 | 0.021165 | 0.02154 | 0.016725 |
| 2005 Q3 | 0.020717 | 0.020819 | 0.020297 |
| 2005 Q4 | 0.0226 | 0.021209 | 0.020372 |
| 2006 Q1 | 0.021283 | 0.020882 | 0.027283 |
| 2006 Q2 | 0.022716 | 0.024572 | 0.022473 |
| 2006 Q3 | 0.023936 | 0.028188 | 0.019732 |
| 2006 Q4 | 0.021577 | 0.026372 | 0.025048 |
| 2007 Q1 | 0.023628 | 0.026091 | 0.036782 |
| 2007 Q2 | 0.020362 | 0.022688 | 0.032584 |
| 2007 Q3 | 0.019906 | 0.021601 | 0.027974 |
| 2007 Q4 | 0.022482 | 0.02314 | 0.027951 |
| 2008 Q1 | 0.021117 | 0.023644 | 0.02891 |
| 2008 Q2 | 0.022659 | 0.023278 | 0.025444 |
| 2008 Q3 | 0.02226 | 0.02508 | 0.025091 |
| 2008 Q4 | 0.016417 | 0.01994 | 0.027146 |
| 2009 Q1 | 0.011791 | 0.017407 | 0.003733 |
| 2009 Q2 | 0.011621 | 0.018213 | 0.008133 |
| 2009 Q3 | 0.009904 | 0.014937 | 0.00738 |
| 2009 Q4 | 0.014156 | 0.017431 | 0.002938 |
| 2010 Q1 | 0.015539 | 0.013328 | -0.00896 |
| 2010 Q2 | 0.01329 | 0.009231 | -0.00204 |
| 2010 Q3 | 0.012923 | 0.008547 | -0.00444 |
| 2010 Q4 | 0.009707 | 0.007277 | -0.01161 |
| 2011 Q1 | 0.010544 | 0.010776 | 0.008996 |
| 2011 Q2 | 0.013995 | 0.014947 | 0.004577 |
| 2011 Q3 | 0.016613 | 0.014853 | 0.010323 |
| 2011 Q4 | 0.018617 | 0.02161 | 0.003996 |
| 2012 Q1 | 0.020486 | 0.022364 | 0.015753 |
| 2012 Q2 | 0.019036 | 0.022628 | 0.01198 |
| 2012 Q3 | 0.017079 | 0.024133 | 0.010141 |
| 2012 Q4 | 0.016499 | 0.019446 | 0.02181 |
| 2013 Q1 | 0.014828 | 0.019389 | 0.008003 |
| 2013 Q2 | 0.012712 | 0.016774 | 0.011558 |
| 2013 Q3 | 0.013169 | 0.017316 | 0.006576 |
| 2013 Q4 | 0.013048 | 0.017061 | 0.014853 |
| 2014 Q1 | 0.012461 | 0.016151 | 0.012735 |
* Data reflect year-over-year changes starting in the change from 1978Q1–1979Q1.
** Data reflect rolling averages of two-year changes starting with the change from 1977Q1–1979Q1.
Source: Authors' analysis of Bureau of Economic Analysis National Income and Product Accounts (Table 2.1), Current Population Survey Current Price Index Series and Bureau of Labor Statistics Total Economy Productivity and Costs Program unpublished data
What makes the extraordinarily slow price growth since the Great Recession even more remarkable is that it has occurred against a backdrop of a historically large increase in the monetary base of the United States (reserves held by banks of the Federal Reserve). Figure E shows the change in reserves as a share of U.S. GDP from 1985 to January 2014. The reason for the large increase in the monetary base since the middle of the recession is the Federal Reserve’s historically aggressive attempts to halt a widening of the output gap by providing monetary stimulus. The Fed’s large-scale asset purchases (LSAPs) have largely been financed by crediting financial institutions with reserves held at the Fed.
Monetary base and inflation, 1985–2014
| Inflation | Monetary base | |
|---|---|---|
| 1985/01/01 | 0.04647 | 0.045977 |
| 1985/04/01 | 0.04431 | 0.046262 |
| 1985/07/01 | 0.04136 | 0.046432 |
| 1985/10/01 | 0.04284 | 0.046911 |
| 1986/01/01 | 0.04236 | 0.046878 |
| 1986/04/01 | 0.04061 | 0.047736 |
| 1986/07/01 | 0.04042 | 0.048297 |
| 1986/10/01 | 0.03869 | 0.049224 |
| 1987/01/01 | 0.03501 | 0.049663 |
| 1987/04/01 | 0.03833 | 0.049774 |
| 1987/07/01 | 0.03748 | 0.049486 |
| 1987/10/01 | 0.03811 | 0.049364 |
| 1988/01/01 | 0.03973 | 0.049425 |
| 1988/04/01 | 0.03917 | 0.049454 |
| 1988/07/01 | 0.04033 | 0.049443 |
| 1988/10/01 | 0.04115 | 0.049041 |
| 1989/01/01 | 0.04123 | 0.048356 |
| 1989/04/01 | 0.03960 | 0.047977 |
| 1989/07/01 | 0.03885 | 0.047640 |
| 1989/10/01 | 0.03943 | 0.047785 |
| 1990/01/01 | 0.04171 | 0.047505 |
| 1990/04/01 | 0.04435 | 0.048027 |
| 1990/07/01 | 0.04903 | 0.048761 |
| 1990/10/01 | 0.04799 | 0.049952 |
| 1991/01/01 | 0.04906 | 0.051122 |
| 1991/04/01 | 0.04380 | 0.051345 |
| 1991/07/01 | 0.03901 | 0.051579 |
| 1991/10/01 | 0.03725 | 0.052018 |
| 1992/01/01 | 0.03239 | 0.052374 |
| 1992/04/01 | 0.03279 | 0.052726 |
| 1992/07/01 | 0.02972 | 0.053497 |
| 1992/10/01 | 0.02947 | 0.054205 |
| 1993/01/01 | 0.02857 | 0.055007 |
| 1993/04/01 | 0.02943 | 0.055745 |
| 1993/07/01 | 0.02841 | 0.056813 |
| 1993/10/01 | 0.02665 | 0.057270 |
| 1994/01/01 | 0.02429 | 0.057896 |
| 1994/04/01 | 0.02239 | 0.057892 |
| 1994/07/01 | 0.02307 | 0.058283 |
| 1994/10/01 | 0.02174 | 0.058074 |
| 1995/01/01 | 0.02401 | 0.058279 |
| 1995/04/01 | 0.02517 | 0.058868 |
| 1995/07/01 | 0.02582 | 0.058501 |
| 1995/10/01 | 0.02707 | 0.058186 |
| 1996/01/01 | 0.02611 | 0.057930 |
| 1996/04/01 | 0.02413 | 0.057332 |
| 1996/07/01 | 0.02355 | 0.057545 |
| 1996/10/01 | 0.02327 | 0.057434 |
| 1997/01/01 | 0.02230 | 0.057429 |
| 1997/04/01 | 0.02329 | 0.057289 |
| 1997/07/01 | 0.02175 | 0.057161 |
| 1997/10/01 | 0.02093 | 0.057612 |
| 1998/01/01 | 0.02233 | 0.057856 |
| 1998/04/01 | 0.02084 | 0.057878 |
| 1998/07/01 | 0.02165 | 0.057587 |
| 1998/10/01 | 0.02193 | 0.057811 |
| 1999/01/01 | 0.01999 | 0.058332 |
| 1999/04/01 | 0.01988 | 0.059025 |
| 1999/07/01 | 0.02030 | 0.059029 |
| 1999/10/01 | 0.02066 | 0.061334 |
| 2000/01/01 | 0.02241 | 0.060494 |
| 2000/04/01 | 0.02356 | 0.058717 |
| 2000/07/01 | 0.02474 | 0.058480 |
| 2000/10/01 | 0.02497 | 0.058377 |
| 2001/01/01 | 0.02613 | 0.058919 |
| 2001/04/01 | 0.02621 | 0.059124 |
| 2001/07/01 | 0.02631 | 0.061265 |
| 2001/10/01 | 0.02709 | 0.062006 |
| 2002/01/01 | 0.02527 | 0.062693 |
| 2002/04/01 | 0.02418 | 0.063302 |
| 2002/07/01 | 0.02271 | 0.063802 |
| 2002/10/01 | 0.02039 | 0.064150 |
| 2003/01/01 | 0.01868 | 0.064634 |
| 2003/04/01 | 0.01477 | 0.064923 |
| 2003/07/01 | 0.01364 | 0.064162 |
| 2003/10/01 | 0.01154 | 0.063792 |
| 2004/01/01 | 0.01307 | 0.063548 |
| 2004/04/01 | 0.01803 | 0.063258 |
| 2004/07/01 | 0.01820 | 0.063526 |
| 2004/10/01 | 0.02177 | 0.063015 |
| 2005/01/01 | 0.02288 | 0.062301 |
| 2005/04/01 | 0.02132 | 0.061852 |
| 2005/07/01 | 0.02047 | 0.061464 |
| 2005/10/01 | 0.02087 | 0.060958 |
| 2006/01/01 | 0.02119 | 0.060865 |
| 2006/04/01 | 0.02474 | 0.060619 |
| 2006/07/01 | 0.02823 | 0.060240 |
| 2006/10/01 | 0.02689 | 0.059540 |
| 2007/01/01 | 0.02623 | 0.059522 |
| 2007/04/01 | 0.02272 | 0.058935 |
| 2007/07/01 | 0.02111 | 0.058682 |
| 2007/10/01 | 0.02307 | 0.058131 |
| 2008/01/01 | 0.02385 | 0.058407 |
| 2008/04/01 | 0.02344 | 0.058025 |
| 2008/07/01 | 0.02461 | 0.059578 |
| 2008/10/01 | 0.02002 | 0.096490 |
| 2009/01/01 | 0.01745 | 0.115915 |
| 2009/04/01 | 0.01817 | 0.124171 |
| 2009/07/01 | 0.01493 | 0.120357 |
| 2009/10/01 | 0.01731 | 0.137261 |
| 2010/01/01 | 0.01321 | 0.142642 |
| 2010/04/01 | 0.00983 | 0.136930 |
| 2010/07/01 | 0.00922 | 0.134071 |
| 2010/10/01 | 0.00634 | 0.130878 |
| 2011/01/01 | 0.01092 | 0.145840 |
| 2011/04/01 | 0.01493 | 0.167295 |
| 2011/07/01 | 0.01472 | 0.172797 |
| 2011/10/01 | 0.02165 | 0.166311 |
| 2012/01/01 | 0.02192 | 0.168291 |
| 2012/04/01 | 0.02341 | 0.164062 |
| 2012/07/01 | 0.02411 | 0.163492 |
| 2012/10/01 | 0.01910 | 0.160913 |
| 2013/01/01 | 0.01991 | 0.172375 |
| 2013/04/01 | 0.01610 | 0.186891 |
| 2013/07/01 | 0.01753 | 0.201347 |
| 2013/10/01 | 0.01747 | 0.213488 |
| 2014/01/01 | 0.01605 | 0.225456 |
Note: Shaded areas denote recessions.
Source: Authors' analysis of data from Federal Reserve Economic Database of St. Louis Federal Reserve public data series
It is widely agreed that during times not characterized by productive slack in the economy, such a large increase in monetary base would reliably lead to a significant increase in inflation, as it would result in more money chasing a fixed amount of goods. Yet over the past seven years, a consistent increase in the monetary base has not led to reliable inflation gains, as the rise in the monetary base has actually just pushed back against deflationary pressures in large part by helping to spur some spending that would not have happened absent the monetary stimulus. When “more money” can be matched with “more goods,” then inflationary pressures can remain tame even in the face of a rising monetary base.
The failure of prices to rise in line with the very large increase in the monetary base is the strongest possible diagnostic demonstrating that the U.S. economy continues to have a large shortfall between aggregate demand and productive capacity.
Evidence from interest rates
Another sign of an economy with rapidly dwindling economic slack would be a closing of the gap between planned investment and desired savings, with investment rising and savings falling. As a decline in savings can be thought of (too simply) as a fall in the supply of loanable funds, while rising investment should entail an increase in the demand for loanable funds, the simplest textbook prediction of a tightening economy would be an increase in the price of loanable funds (interest rates).
Figure F examines evidence on real (inflation-adjusted) interest rates. While they have picked up a bit from the lowest levels, real rates remain historically low, arguing again that there is little evidence of a rapid closing of the gap between planned investment and desired savings.
Federal budget deficits and interest rates, 1962–2014
| Date | Federal net lending as a percent of GDP | Real interest rates |
|---|---|---|
| 1962/01/01 | -2.77218 | 2.66 |
| 1962/04/01 | -2.73813 | 2.34 |
| 1962/07/01 | -2.59186 | 2.29 |
| 1962/10/01 | -2.67493 | 2.23 |
| 1963/01/01 | -2.10374 | 2.08 |
| 1963/04/01 | -1.74106 | 2.30 |
| 1963/07/01 | -2.00000 | 2.37 |
| 1963/10/01 | -1.89371 | 2.41 |
| 1964/01/01 | -2.36889 | 2.66 |
| 1964/04/01 | -3.01116 | 2.56 |
| 1964/07/01 | -2.48268 | 2.70 |
| 1964/10/01 | -2.03322 | 2.62 |
| 1965/01/01 | -1.33482 | 2.52 |
| 1965/04/01 | -1.35172 | 2.57 |
| 1965/07/01 | -2.38603 | 2.56 |
| 1965/10/01 | -2.34122 | 2.78 |
| 1966/01/01 | -1.86881 | 3.12 |
| 1966/04/01 | -1.90783 | 2.97 |
| 1966/07/01 | -2.38791 | 3.27 |
| 1966/10/01 | -2.63505 | 3.02 |
| 1967/01/01 | -3.64066 | 2.51 |
| 1967/04/01 | -3.41910 | 2.83 |
| 1967/07/01 | -3.58874 | 3.18 |
| 1967/10/01 | -3.28351 | 3.57 |
| 1968/01/01 | -2.83174 | 3.36 |
| 1968/04/01 | -2.93709 | 3.40 |
| 1968/07/01 | -2.00567 | 3.03 |
| 1968/10/01 | -1.89671 | 3.07 |
| 1969/01/01 | -0.76351 | 3.32 |
| 1969/04/01 | -0.84042 | 3.24 |
| 1969/07/01 | -1.55039 | 3.56 |
| 1969/10/01 | -1.71039 | 4.13 |
| 1970/01/01 | -2.65781 | 4.20 |
| 1970/04/01 | -3.44828 | 4.40 |
| 1970/07/01 | -3.94120 | 3.99 |
| 1970/10/01 | -4.39762 | 3.10 |
| 1971/01/01 | -3.87590 | 2.13 |
| 1971/04/01 | -4.64033 | 2.27 |
| 1971/07/01 | -4.52427 | 2.50 |
| 1971/10/01 | -4.26441 | 1.89 |
| 1972/01/01 | -3.58243 | 1.92 |
| 1972/04/01 | -4.18865 | 2.10 |
| 1972/07/01 | -3.12258 | 2.25 |
| 1972/10/01 | -4.11411 | 2.30 |
| 1973/01/01 | -2.67256 | 2.65 |
| 1973/04/01 | -2.96981 | 2.98 |
| 1973/07/01 | -2.17149 | 3.34 |
| 1973/10/01 | -2.08911 | 3.00 |
| 1974/01/01 | -2.29477 | 3.25 |
| 1974/04/01 | -1.89024 | 3.50 |
| 1974/07/01 | -2.53934 | 3.88 |
| 1974/10/01 | -3.33125 | 3.32 |
| 1975/01/01 | -4.92714 | 3.00 |
| 1975/04/01 | -8.11398 | 3.36 |
| 1975/07/01 | -5.77664 | 3.43 |
| 1975/10/01 | -5.69681 | 2.93 |
| 1976/01/01 | -4.88353 | 2.23 |
| 1976/04/01 | -4.36211 | 2.00 |
| 1976/07/01 | -4.50145 | 1.64 |
| 1976/10/01 | -4.71007 | 0.83 |
| 1977/01/01 | -3.84442 | 0.98 |
| 1977/04/01 | -3.72779 | 0.86 |
| 1977/07/01 | -3.85884 | 0.75 |
| 1977/10/01 | -3.90557 | 1.32 |
| 1978/01/01 | -4.01594 | 2.23 |
| 1978/04/01 | -2.95729 | 2.82 |
| 1978/07/01 | -2.88882 | 3.36 |
| 1978/10/01 | -2.65490 | 3.96 |
| 1979/01/01 | -2.13699 | 4.28 |
| 1979/04/01 | -2.16110 | 4.31 |
| 1979/07/01 | -2.38167 | 4.31 |
| 1979/10/01 | -2.52682 | 5.30 |
| 1980/01/01 | -3.02521 | 6.43 |
| 1980/04/01 | -3.95371 | 4.81 |
| 1980/07/01 | -4.17133 | 5.14 |
| 1980/10/01 | -3.49424 | 6.53 |
| 1981/01/01 | -3.03659 | 6.85 |
| 1981/04/01 | -2.99002 | 7.46 |
| 1981/07/01 | -2.85171 | 8.40 |
| 1981/10/01 | -4.09319 | 7.50 |
| 1982/01/01 | -4.57267 | 7.61 |
| 1982/04/01 | -4.91400 | 7.11 |
| 1982/07/01 | -5.92795 | 6.31 |
| 1982/10/01 | -6.70521 | 3.77 |
| 1983/01/01 | -6.82987 | 3.91 |
| 1983/04/01 | -6.04944 | 4.17 |
| 1983/07/01 | -6.67064 | 5.47 |
| 1983/10/01 | -6.11680 | 5.81 |
| 1984/01/01 | -5.46923 | 6.42 |
| 1984/04/01 | -5.53674 | 7.90 |
| 1984/07/01 | -5.63684 | 7.85 |
| 1984/10/01 | -6.04687 | 7.28 |
| 1985/01/01 | -5.01770 | 7.43 |
| 1985/04/01 | -6.25479 | 6.82 |
| 1985/07/01 | -5.64557 | 6.60 |
| 1985/10/01 | -5.78024 | 6.26 |
| 1986/01/01 | -5.57315 | 5.06 |
| 1986/04/01 | -5.91851 | 4.37 |
| 1986/07/01 | -6.29708 | 4.25 |
| 1986/10/01 | -5.24907 | 4.06 |
| 1987/01/01 | -5.25105 | 4.18 |
| 1987/04/01 | -4.15854 | 5.44 |
| 1987/07/01 | -4.31997 | 5.98 |
| 1987/10/01 | -4.32437 | 6.33 |
| 1988/01/01 | -4.13114 | 5.58 |
| 1988/04/01 | -3.91344 | 6.08 |
| 1988/07/01 | -3.61921 | 6.20 |
| 1988/10/01 | -3.65806 | 6.14 |
| 1989/01/01 | -3.18962 | 6.79 |
| 1989/04/01 | -3.44681 | 6.31 |
| 1989/07/01 | -3.55248 | 5.67 |
| 1989/10/01 | -3.53784 | 5.22 |
| 1990/01/01 | -3.98418 | 5.20 |
| 1990/04/01 | -3.91993 | 5.30 |
| 1990/07/01 | -3.84609 | 5.25 |
| 1990/10/01 | -4.55564 | 5.05 |
| 1991/01/01 | -3.62192 | 4.59 |
| 1991/04/01 | -4.52341 | 4.63 |
| 1991/07/01 | -5.03506 | 4.42 |
| 1991/10/01 | -4.97985 | 3.80 |
| 1992/01/01 | -5.49931 | 3.70 |
| 1992/04/01 | -5.54657 | 3.99 |
| 1992/07/01 | -5.62362 | 3.33 |
| 1992/10/01 | -5.30347 | 3.32 |
| 1993/01/01 | -5.35995 | 3.11 |
| 1993/04/01 | -4.72648 | 2.59 |
| 1993/07/01 | -4.82460 | 2.04 |
| 1993/10/01 | -4.23018 | 2.41 |
| 1994/01/01 | -3.77091 | 3.06 |
| 1994/04/01 | -3.35222 | 4.43 |
| 1994/07/01 | -3.65605 | 5.00 |
| 1994/10/01 | -3.54974 | 5.50 |
| 1995/01/01 | -3.50947 | 5.09 |
| 1995/04/01 | -3.29130 | 4.23 |
| 1995/07/01 | -2.90923 | 3.88 |
| 1995/10/01 | -2.91557 | 3.48 |
| 1996/01/01 | -2.99249 | 3.49 |
| 1996/04/01 | -2.34944 | 4.34 |
| 1996/07/01 | -2.13384 | 4.43 |
| 1996/10/01 | -1.54941 | 4.05 |
| 1997/01/01 | -1.39729 | 4.29 |
| 1997/04/01 | -0.86063 | 4.30 |
| 1997/07/01 | -0.76510 | 3.92 |
| 1997/10/01 | -0.78741 | 3.51 |
| 1998/01/01 | -0.16311 | 3.16 |
| 1998/04/01 | 0.06559 | 3.31 |
| 1998/07/01 | 0.31815 | 2.96 |
| 1998/10/01 | 0.24663 | 2.41 |
| 1999/01/01 | 0.57458 | 2.73 |
| 1999/04/01 | 0.64530 | 3.31 |
| 1999/07/01 | 0.70174 | 3.53 |
| 1999/10/01 | 0.63832 | 3.85 |
| 2000/01/01 | 1.69887 | 4.36 |
| 2000/04/01 | 1.39444 | 4.01 |
| 2000/07/01 | 1.44831 | 3.75 |
| 2000/10/01 | 1.36321 | 3.49 |
| 2001/01/01 | 1.19762 | 2.88 |
| 2001/04/01 | 0.74801 | 3.05 |
| 2001/07/01 | -1.39793 | 2.74 |
| 2001/10/01 | -0.51856 | 2.46 |
| 2002/01/01 | -2.37698 | 2.67 |
| 2002/04/01 | -2.75736 | 2.67 |
| 2002/07/01 | -2.85784 | 1.80 |
| 2002/10/01 | -3.30101 | 1.42 |
| 2003/01/01 | -3.45746 | 1.33 |
| 2003/04/01 | -4.18946 | 0.97 |
| 2003/07/01 | -4.67734 | 1.62 |
| 2003/10/01 | -3.98105 | 1.68 |
| 2004/01/01 | -4.24638 | 1.45 |
| 2004/04/01 | -3.85603 | 2.25 |
| 2004/07/01 | -3.65337 | 2.18 |
| 2004/10/01 | -3.59525 | 2.21 |
| 2005/01/01 | -3.07033 | 2.25 |
| 2005/04/01 | -2.97864 | 1.98 |
| 2005/07/01 | -3.38924 | 1.78 |
| 2005/10/01 | -2.70113 | 1.79 |
| 2006/01/01 | -2.36047 | 2.11 |
| 2006/04/01 | -2.37414 | 2.51 |
| 2006/07/01 | -2.23141 | 2.36 |
| 2006/10/01 | -1.54033 | 2.12 |
| 2007/01/01 | -2.10467 | 1.93 |
| 2007/04/01 | -2.39038 | 2.16 |
| 2007/07/01 | -2.64619 | 1.84 |
| 2007/10/01 | -2.65283 | 1.53 |
| 2008/01/01 | -3.31427 | 0.91 |
| 2008/04/01 | -5.79061 | 0.83 |
| 2008/07/01 | -5.18785 | 0.79 |
| 2008/10/01 | -6.96172 | 0.07 |
| 2009/01/01 | -9.26557 | -0.41 |
| 2009/04/01 | -10.97329 | 0.49 |
| 2009/07/01 | -10.51903 | 1.32 |
| 2009/10/01 | -10.21210 | 1.34 |
| 2010/01/01 | -10.46175 | 1.55 |
| 2010/04/01 | -10.47771 | 1.41 |
| 2010/07/01 | -9.84996 | 0.21 |
| 2010/10/01 | -9.59643 | 0.28 |
| 2011/01/01 | -9.04093 | 0.86 |
| 2011/04/01 | -9.51435 | 0.30 |
| 2011/07/01 | -8.83947 | 0.57 |
| 2011/10/01 | -8.66759 | 0.65 |
| 2012/01/01 | -7.50112 | 0.79 |
| 2012/04/01 | -7.68855 | 0.71 |
| 2012/07/01 | -7.42847 | -0.46 |
| 2012/10/01 | -7.29767 | -0.66 |
| 2013/01/01 | -5.59651 | -0.23 |
| 2013/04/01 | -4.32447 | 0.02 |
| 2013/07/01 | -5.44732 | 0.78 |
| 2013/10/01 | -4.10835 | 0.56 |
| 2014/01/01 | -4.57276 | 0.24 |
Note: Shaded areas denote recessions. Real rates calculated by subtracting 12-quarter weighted average of inflation, with higher weights on most recent quarter.
Source: Authors' analysis of Bureau of Economic Analysis National Income and Product Accounts (Table 5.1) Federal Reserve Economic Data public data series, and Bureau of Labor Statistics Consumer Price Index program public data series
Further, much like the evidence on tame inflation in the face of a rapidly expanding monetary base, interest rates provide even more powerful evidence of continued slack when one considers the broader economic context: Figure F also shows that until 2013, U.S. federal budget deficits were quite a bit larger than historical averages. It is widely agreed that if deficits of that size were run during periods with no productive slack in the economy, the resulting excess demand for loanable funds would lead to significant increases in interest rates. Yet no such upward pressure on interest rates materialized, because desired private savings were so large that ferocious downward pressure was put on these rates.
Evidence from corporate profits
The final non–labor-market indicators examined in this section are profit margins and profit shares in the nonfinancial corporate (NFC) sector. A long empirical literature has identified the “full employment profit squeeze” as an explanation for business cycle dynamics. The hypothesis argues that profit shares (and margins) fall sharply during recessions, but fully recover well before other macroeconomic indicators. As recoveries continue and strengthen, falling unemployment leads to greater bargaining power for workers, which tends to increase labor’s share of national (or NFC-sector) income later in business cycles.
Barbosa-Filho and Taylor (2007) provide evidence that this pattern generally fits the empirical facts for the U.S. economy from 1954 to 2002. Figure G shows the trajectory of the labor share of corporate-sector income and overall capacity utilization (the ratio of actual to potential GDP) over the last four business cycles. In each of the three business cycles preceding the Great Recession, one sees the labor share rise during the recession (as profits fall much faster than wage incomes during downturns), then fall significantly in the early stages of recovery before rising again late in the expansion. By the end of 2013, however, there was little evidence that the labor share has even begun any reliable rise following its long fall in the early stages of recovery from the Great Recession.
Trajectory of labor share of corporate-sector income and overall capacity utilization over last four business cycles, 1981–2013
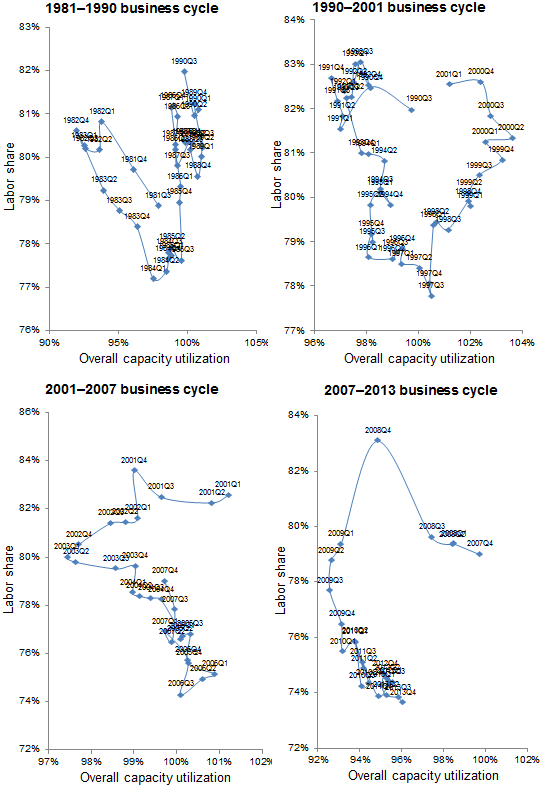
Note: Overall capacity utilization is the ratio of actual to potential GDP.
Source: Authors' analysis of Bureau of Economic Analysis National Income and Product Accounts (Table 1.1.6 and 1.14) and Congressional Budget Office Budget and Economic Outlook
The economic logic of this rising labor share of income in the late stage of business cycle expansions requires a reduction in economic slack sufficient to give workers enough bargaining power to spur significant real wage growth. If there is no evidence of much downward pressure on profit margins, then it seems hard to argue that economic slack has rapidly dwindled. Figure H shows the profit margin in the nonfinancial corporate sector. By the end of 2013 the after-tax profit margin was still higher than any level that prevailed before the Great Recession since 1966 and showed little sign that it had peaked.2
Nonfinancial corporate sector profit margins, 1947–2013
| Before tax | After tax | |
|---|---|---|
| 1947/01/01 | 16.4% | 6.8% |
| 1947/04/01 | 18.2% | 9.4% |
| 1947/07/01 | 17.7% | 9.1% |
| 1947/10/01 | 17.8% | 9.4% |
| 1948/01/01 | 19.7% | 10.9% |
| 1948/04/01 | 20.1% | 11.3% |
| 1948/07/01 | 19.2% | 11.1% |
| 1948/10/01 | 19.7% | 12.1% |
| 1949/01/01 | 18.9% | 11.7% |
| 1949/04/01 | 18.1% | 11.4% |
| 1949/07/01 | 18.8% | 12.0% |
| 1949/10/01 | 16.8% | 10.0% |
| 1950/01/01 | 18.5% | 9.5% |
| 1950/04/01 | 20.0% | 10.0% |
| 1950/07/01 | 21.0% | 9.2% |
| 1950/10/01 | 22.0% | 10.0% |
| 1951/01/01 | 20.7% | 6.3% |
| 1951/04/01 | 19.9% | 8.5% |
| 1951/07/01 | 20.0% | 9.5% |
| 1951/10/01 | 20.3% | 9.0% |
| 1952/01/01 | 18.9% | 9.0% |
| 1952/04/01 | 17.5% | 8.5% |
| 1952/07/01 | 17.4% | 8.0% |
| 1952/10/01 | 18.4% | 9.0% |
| 1953/01/01 | 18.5% | 8.5% |
| 1953/04/01 | 18.0% | 8.1% |
| 1953/07/01 | 17.5% | 7.5% |
| 1953/10/01 | 14.2% | 6.6% |
| 1954/01/01 | 15.6% | 8.1% |
| 1954/04/01 | 16.2% | 8.6% |
| 1954/07/01 | 17.1% | 9.0% |
| 1954/10/01 | 18.1% | 9.5% |
| 1955/01/01 | 19.5% | 10.5% |
| 1955/04/01 | 19.5% | 10.5% |
| 1955/07/01 | 18.9% | 9.9% |
| 1955/10/01 | 19.1% | 9.8% |
| 1956/01/01 | 18.0% | 9.2% |
| 1956/04/01 | 17.4% | 9.2% |
| 1956/07/01 | 17.2% | 9.0% |
| 1956/10/01 | 17.1% | 9.0% |
| 1957/01/01 | 17.3% | 8.9% |
| 1957/04/01 | 16.7% | 8.8% |
| 1957/07/01 | 16.2% | 8.8% |
| 1957/10/01 | 15.0% | 8.0% |
| 1958/01/01 | 13.1% | 7.0% |
| 1958/04/01 | 13.5% | 7.4% |
| 1958/07/01 | 14.8% | 8.3% |
| 1958/10/01 | 16.5% | 8.7% |
| 1959/01/01 | 17.2% | 9.1% |
| 1959/04/01 | 18.2% | 9.5% |
| 1959/07/01 | 15.9% | 8.6% |
| 1959/10/01 | 15.9% | 9.1% |
| 1960/01/01 | 16.7% | 9.0% |
| 1960/04/01 | 15.5% | 8.6% |
| 1960/07/01 | 15.0% | 8.6% |
| 1960/10/01 | 14.2% | 8.2% |
| 1961/01/01 | 13.7% | 7.7% |
| 1961/04/01 | 15.0% | 8.5% |
| 1961/07/01 | 15.8% | 9.0% |
| 1961/10/01 | 16.6% | 9.4% |
| 1962/01/01 | 16.6% | 9.8% |
| 1962/04/01 | 16.2% | 9.8% |
| 1962/07/01 | 16.2% | 9.8% |
| 1962/10/01 | 16.5% | 10.2% |
| 1963/01/01 | 16.5% | 10.2% |
| 1963/04/01 | 17.4% | 10.6% |
| 1963/07/01 | 17.4% | 10.6% |
| 1963/10/01 | 17.6% | 10.5% |
| 1964/01/01 | 18.1% | 11.3% |
| 1964/04/01 | 17.6% | 11.3% |
| 1964/07/01 | 17.6% | 10.9% |
| 1964/10/01 | 17.6% | 10.9% |
| 1965/01/01 | 18.7% | 12.0% |
| 1965/04/01 | 18.6% | 12.0% |
| 1965/07/01 | 18.6% | 12.0% |
| 1965/10/01 | 18.9% | 11.9% |
| 1966/01/01 | 19.3% | 12.3% |
| 1966/04/01 | 18.7% | 11.8% |
| 1966/07/01 | 18.1% | 11.3% |
| 1966/10/01 | 18.0% | 11.6% |
| 1967/01/01 | 17.1% | 11.2% |
| 1967/04/01 | 16.7% | 10.8% |
| 1967/07/01 | 16.5% | 10.6% |
| 1967/10/01 | 16.8% | 10.5% |
| 1968/01/01 | 16.3% | 9.7% |
| 1968/04/01 | 16.5% | 10.0% |
| 1968/07/01 | 16.4% | 9.9% |
| 1968/10/01 | 16.2% | 9.8% |
| 1969/01/01 | 15.2% | 8.9% |
| 1969/04/01 | 14.7% | 8.5% |
| 1969/07/01 | 13.8% | 8.0% |
| 1969/10/01 | 12.6% | 7.2% |
| 1970/01/01 | 11.4% | 6.4% |
| 1970/04/01 | 11.6% | 7.0% |
| 1970/07/01 | 11.2% | 6.3% |
| 1970/10/01 | 10.4% | 5.9% |
| 1971/01/01 | 12.0% | 7.2% |
| 1971/04/01 | 12.2% | 7.1% |
| 1971/07/01 | 12.1% | 7.4% |
| 1971/10/01 | 12.4% | 7.7% |
| 1972/01/01 | 12.6% | 7.9% |
| 1972/04/01 | 12.5% | 7.9% |
| 1972/07/01 | 12.7% | 8.2% |
| 1972/10/01 | 13.2% | 8.1% |
| 1973/01/01 | 13.4% | 8.0% |
| 1973/04/01 | 12.6% | 7.2% |
| 1973/07/01 | 12.3% | 7.4% |
| 1973/10/01 | 12.3% | 6.9% |
| 1974/01/01 | 11.2% | 6.2% |
| 1974/04/01 | 11.0% | 5.8% |
| 1974/07/01 | 10.3% | 4.7% |
| 1974/10/01 | 9.7% | 4.9% |
| 1975/01/01 | 9.8% | 5.8% |
| 1975/04/01 | 10.9% | 6.8% |
| 1975/07/01 | 12.5% | 7.4% |
| 1975/10/01 | 12.8% | 7.6% |
| 1976/01/01 | 13.8% | 8.3% |
| 1976/04/01 | 13.2% | 8.0% |
| 1976/07/01 | 13.1% | 7.9% |
| 1976/10/01 | 12.6% | 7.5% |
| 1977/01/01 | 12.6% | 7.4% |
| 1977/04/01 | 13.7% | 8.3% |
| 1977/07/01 | 14.3% | 8.9% |
| 1977/10/01 | 13.5% | 8.2% |
| 1978/01/01 | 12.4% | 7.7% |
| 1978/04/01 | 13.9% | 8.6% |
| 1978/07/01 | 13.8% | 8.5% |
| 1978/10/01 | 13.9% | 8.4% |
| 1979/01/01 | 12.8% | 7.8% |
| 1979/04/01 | 12.3% | 7.4% |
| 1979/07/01 | 11.7% | 6.9% |
| 1979/10/01 | 11.1% | 6.5% |
| 1980/01/01 | 10.6% | 5.6% |
| 1980/04/01 | 9.0% | 5.3% |
| 1980/07/01 | 9.6% | 5.3% |
| 1980/10/01 | 10.4% | 6.1% |
| 1981/01/01 | 10.7% | 6.5% |
| 1981/04/01 | 10.5% | 6.9% |
| 1981/07/01 | 11.1% | 7.4% |
| 1981/10/01 | 10.3% | 7.0% |
| 1982/01/01 | 9.3% | 6.7% |
| 1982/04/01 | 9.7% | 6.9% |
| 1982/07/01 | 9.6% | 6.9% |
| 1982/10/01 | 8.7% | 6.5% |
| 1983/01/01 | 9.4% | 7.0% |
| 1983/04/01 | 10.4% | 7.4% |
| 1983/07/01 | 11.0% | 7.5% |
| 1983/10/01 | 11.4% | 7.9% |
| 1984/01/01 | 12.5% | 8.6% |
| 1984/04/01 | 12.3% | 8.6% |
| 1984/07/01 | 11.9% | 8.7% |
| 1984/10/01 | 11.9% | 8.8% |
| 1985/01/01 | 11.6% | 8.6% |
| 1985/04/01 | 11.4% | 8.4% |
| 1985/07/01 | 11.9% | 8.9% |
| 1985/10/01 | 10.8% | 7.8% |
| 1986/01/01 | 10.0% | 7.0% |
| 1986/04/01 | 9.5% | 6.5% |
| 1986/07/01 | 9.0% | 5.9% |
| 1986/10/01 | 8.8% | 5.5% |
| 1987/01/01 | 9.2% | 5.9% |
| 1987/04/01 | 9.8% | 6.1% |
| 1987/07/01 | 10.3% | 6.6% |
| 1987/10/01 | 10.0% | 6.5% |
| 1988/01/01 | 10.2% | 6.8% |
| 1988/04/01 | 10.1% | 6.6% |
| 1988/07/01 | 10.0% | 6.5% |
| 1988/10/01 | 10.5% | 6.9% |
| 1989/01/01 | 9.6% | 5.9% |
| 1989/04/01 | 9.2% | 5.9% |
| 1989/07/01 | 9.1% | 5.9% |
| 1989/10/01 | 8.3% | 5.2% |
| 1990/01/01 | 8.5% | 5.5% |
| 1990/04/01 | 8.8% | 5.6% |
| 1990/07/01 | 8.0% | 4.8% |
| 1990/10/01 | 7.8% | 4.8% |
| 1991/01/01 | 8.4% | 5.4% |
| 1991/04/01 | 8.3% | 5.6% |
| 1991/07/01 | 8.3% | 5.6% |
| 1991/10/01 | 8.0% | 5.4% |
| 1992/01/01 | 8.3% | 5.6% |
| 1992/04/01 | 8.5% | 5.7% |
| 1992/07/01 | 8.3% | 5.5% |
| 1992/10/01 | 8.9% | 6.0% |
| 1993/01/01 | 8.7% | 5.9% |
| 1993/04/01 | 9.6% | 6.3% |
| 1993/07/01 | 9.6% | 6.8% |
| 1993/10/01 | 10.6% | 7.1% |
| 1994/01/01 | 10.7% | 7.6% |
| 1994/04/01 | 11.1% | 7.8% |
| 1994/07/01 | 11.4% | 7.9% |
| 1994/10/01 | 11.9% | 8.1% |
| 1995/01/01 | 11.5% | 7.8% |
| 1995/04/01 | 11.5% | 8.1% |
| 1995/07/01 | 12.2% | 8.7% |
| 1995/10/01 | 12.2% | 8.8% |
| 1996/01/01 | 12.5% | 9.1% |
| 1996/04/01 | 12.6% | 9.0% |
| 1996/07/01 | 12.5% | 9.0% |
| 1996/10/01 | 12.8% | 9.1% |
| 1997/01/01 | 12.8% | 9.4% |
| 1997/04/01 | 12.7% | 9.3% |
| 1997/07/01 | 13.2% | 9.6% |
| 1997/10/01 | 12.7% | 9.2% |
| 1998/01/01 | 11.6% | 8.2% |
| 1998/04/01 | 11.5% | 8.2% |
| 1998/07/01 | 11.7% | 8.5% |
| 1998/10/01 | 11.0% | 8.0% |
| 1999/01/01 | 11.2% | 7.8% |
| 1999/04/01 | 11.1% | 7.7% |
| 1999/07/01 | 10.3% | 7.0% |
| 1999/10/01 | 9.8% | 6.5% |
| 2000/01/01 | 9.3% | 6.0% |
| 2000/04/01 | 9.2% | 5.9% |
| 2000/07/01 | 8.5% | 5.7% |
| 2000/10/01 | 7.8% | 4.9% |
| 2001/01/01 | 7.3% | 5.1% |
| 2001/04/01 | 7.4% | 5.3% |
| 2001/07/01 | 7.1% | 5.0% |
| 2001/10/01 | 6.1% | 4.3% |
| 2002/01/01 | 7.7% | 6.2% |
| 2002/04/01 | 8.2% | 6.4% |
| 2002/07/01 | 8.5% | 6.7% |
| 2002/10/01 | 9.4% | 7.4% |
| 2003/01/01 | 9.7% | 7.3% |
| 2003/04/01 | 10.1% | 7.9% |
| 2003/07/01 | 10.5% | 8.2% |
| 2003/10/01 | 10.7% | 8.1% |
| 2004/01/01 | 11.7% | 8.9% |
| 2004/04/01 | 12.2% | 9.2% |
| 2004/07/01 | 12.5% | 9.3% |
| 2004/10/01 | 12.2% | 9.0% |
| 2005/01/01 | 12.8% | 8.6% |
| 2005/04/01 | 13.5% | 9.4% |
| 2005/07/01 | 12.8% | 8.8% |
| 2005/10/01 | 14.2% | 9.8% |
| 2006/01/01 | 14.4% | 10.2% |
| 2006/04/01 | 14.3% | 9.9% |
| 2006/07/01 | 15.3% | 10.7% |
| 2006/10/01 | 14.1% | 9.8% |
| 2007/01/01 | 13.4% | 9.1% |
| 2007/04/01 | 13.6% | 9.3% |
| 2007/07/01 | 12.0% | 8.2% |
| 2007/10/01 | 11.9% | 7.9% |
| 2008/01/01 | 10.9% | 7.5% |
| 2008/04/01 | 11.0% | 7.5% |
| 2008/07/01 | 12.4% | 8.8% |
| 2008/10/01 | 10.7% | 8.5% |
| 2009/01/01 | 10.1% | 7.7% |
| 2009/04/01 | 9.7% | 7.3% |
| 2009/07/01 | 10.2% | 7.7% |
| 2009/10/01 | 11.8% | 8.7% |
| 2010/01/01 | 12.9% | 9.9% |
| 2010/04/01 | 13.2% | 10.1% |
| 2010/07/01 | 14.2% | 11.1% |
| 2010/10/01 | 13.7% | 10.7% |
| 2011/01/01 | 13.1% | 10.2% |
| 2011/04/01 | 14.5% | 11.6% |
| 2011/07/01 | 14.5% | 11.6% |
| 2011/10/01 | 14.7% | 11.9% |
| 2012/01/01 | 14.5% | 11.3% |
| 2012/04/01 | 14.7% | 11.5% |
| 2012/07/01 | 14.3% | 11.3% |
| 2012/10/01 | 14.7% | 11.3% |
| 2013/01/01 | 14.6% | 11.3% |
| 2013/04/01 | 14.9% | 11.7% |
| 2013/07/01 | 14.9% | 11.7% |
| 2013/10/01 | 14.9% | 11.7% |
Note: Shaded areas denote recessions.
Source: Authors' analysis of Bureau of Economic Analysis National Income and Product Accounts (Table 1.15)
The macroeconomic evidence surveyed above argues strongly that a large gap between aggregate demand and potential supply persists even five years after the official end of the Great Recession. Given this large demand shortfall, one would be surprised indeed if the overall unemployment was not elevated. The remaining sections of this paper focus more strongly on why this elevation of overall unemployment has largely been driven by elevation of the LTUR.
Is there evidence that the long-term unemployed have hardened into the structurally unemployed?
This section examines whether there is evidence of a growing incidence of “structural” factors that are reducing the exit rate from unemployment and therefore increasing the share of the labor force that is long-term unemployed. One factor we examine is whether there has been an increasing “skills mismatch,” in which workers do not have the skills for the jobs that are available. Additionally, a common (and largely admirable) concern voiced by those arguing for more aggressive policy actions to boost demand and lower unemployment is that absent such actions, unemployment that began as a result of cyclical weakness may harden into structural unemployment as workers who have been jobless for extended periods lose skills and/or social networks. This view in particular is sometimes invoked to argue that, whatever the original cause of the rise in long-term unemployment, this group should essentially be treated as structurally unemployed going forward. Taking this position would mean that the LTU should largely be discounted when measuring the degree of labor market slack remaining in the economy, and it assumes that further policy measures to boost demand would largely fail to bring down the LTUR.
No sign of an increasing skills mismatch
We first consider whether there has been an increasing skills mismatch, which would reduce the exit rate from unemployment and thereby increase the share of the labor force that is long-term unemployed. There is a sizeable literature on whether a skills mismatch has increased since the start of the Great Recession, with the consensus being that the weak labor market recovery is not due to a skills mismatch but instead to weakness in aggregate demand. For example, Lazear and Spletzer (2012) state:
An analysis of labor market data suggests that there are no structural changes that can explain movements in unemployment rates over recent years. Neither industrial nor demographic shifts nor a mismatch of skills with job vacancies is behind the increased rates of unemployment. … The patterns observed are consistent with unemployment being caused by cyclic phenomena that are more pronounced during the current recession than in prior recessions.
We provide additional evidence below. The key insight unpinning the evidence presented here is that if today’s high long-term unemployment were a problem of a skills mismatch, we would expect to find some types of workers or sectors or occupations of meaningful size now facing tight labor markets relative to before the recession started. The “signature” of an increasing skills mismatch would be shortages relative to 2007 in some consequentially sized groups of workers.
Table 1 shows the long-term unemployment rate by education, age, gender, race/ethnicity, occupation, and industry. For each category, the table shows the long-term unemployment rate in 2007, the long-term unemployment rate in 2013, and ratio of the 2013 to the 2007 rates. It demonstrates that while there is considerable variation in long-term unemployment rates across groups—which is of course always true, in periods of both labor market strength and weakness—for all groups, the long-term unemployment rate in 2013 was substantially higher than it was before the recession started. The long-term unemployment rate in 2013 was between 2.9 and 4.3 times higher than it was in 2007 for all age, education, occupation, industry, gender, and racial and ethnic groups. In particular, today’s long-term unemployment crisis is not confined to workers who have less education or who happen to be looking for work in specific occupations or industries where jobs aren’t available. Appendix Table B1 shows the long-term unemployment rate by state in both 2007 and 2013 and shows further that long-term unemployment is elevated relative to 2007 in every state. The sign of a skills mismatch—workers in some group of meaningful size experiencing tight labor markets relative to 2007—is plainly missing. Elevated long-term unemployment for all groups, as we see today, is, instead, the sign of weak aggregate demand.
Long-term unemployment rates of various groups, 2007 and 2013
| 2007 | 2013 | Ratio (2013/2007) | |
|---|---|---|---|
| All | 0.8% | 2.8% | 3.4 |
| Educational attainment | |||
| Less than high school | 1.6% | 5.1% | 3.1 |
| High school | 1.0% | 3.6% | 3.6 |
| Some college | 0.7% | 2.7% | 3.8 |
| College | 0.5% | 1.7% | 3.7 |
| Advanced degree | 0.4% | 1.3% | 3.3 |
| Age | |||
| 16–24 | 1.3% | 3.9% | 3.1 |
| 25–34 | 0.8% | 2.8% | 3.5 |
| 35–44 | 0.7% | 2.5% | 3.6 |
| 45–54 | 0.8% | 2.5% | 3.3 |
| 55–64 | 0.7% | 2.7% | 3.6 |
| 65+ | 0.6% | 2.4% | 4.1 |
| Gender | |||
| Male | 0.9% | 2.9% | 3.4 |
| Female | 0.8% | 2.6% | 3.4 |
| Race/ethnicity | |||
| White | 0.6% | 2.2% | 3.5 |
| Black | 2.0% | 5.7% | 2.9 |
| Hispanic | 0.8% | 3.2% | 3.9 |
| Occupation | |||
| Management, business, and financial occupations | 0.4% | 1.5% | 4.1 |
| Professional and related occupations | 0.4% | 1.3% | 3.3 |
| Service occupations | 1.0% | 3.2% | 3.2 |
| Sales and related occupations | 0.8% | 2.8% | 3.4 |
| Office and administrative support occupations | 0.7% | 3.0% | 4.3 |
| Construction and extraction occupations | 1.1% | 4.2% | 3.9 |
| Installation, maintenance and repair occupations | 0.6% | 2.2% | 3.7 |
| Production occupations | 1.1% | 3.6% | 3.2 |
| Transportation and material moving occupations | 1.2% | 3.4% | 2.9 |
| Industry | |||
| Mining | 0.3% | 1.3% | 3.9 |
| Construction | 1.0% | 3.7% | 3.7 |
| Manufacturing | 0.9% | 2.8% | 3.1 |
| Wholesale and retail trade | 0.8% | 2.9% | 3.6 |
| Transportation and utilities | 0.8% | 2.4% | 3.1 |
| Information | 0.8% | 2.6% | 3.1 |
| Financial activities | 0.5% | 1.9% | 3.8 |
| Professional and business services | 0.9% | 3.1% | 3.6 |
| Educational and health services | 0.4% | 1.7% | 4.0 |
| Leisure and hospitality | 1.1% | 3.2% | 2.9 |
| Other services | 0.6% | 2.3% | 3.6 |
| Public administration | 0.4% | 1.4% | 3.4 |
Note: The ratio may not reflect the quotient of 2013 over 2007 column data due to rounding. The long-term unemployment rate is the share of the labor force that has been unemployed for 27 weeks or more.
Source: Authors' analysis of basic monthly Current Population Survey microdata
Another place to look for evidence of a skills mismatch that might be boosting long-term unemployment by reducing unemployed workers’ likelihood of finding a job is in wage trends. If certain skills are in short supply, the simple logic of supply and demand implies wages should be increasing substantially in occupations where there is a shortage. In other words, employers who face shortages of suitable, interested workers should be responding by bidding up wages to attract the workers they need. Figure I shows current average hourly wages as a percentage of average hourly wages in 2007 by occupation, along with productivity growth over this same period as a benchmark for the rate at which average wages should grow. In no occupation is there evidence of wages being bid up in a way that would indicate tight labor markets or labor shortages; in no occupation have average wages even kept pace with overall productivity growth over this period. Again, this pattern of productivity growth outstripping wage growth across the board is a sign of weak aggregate demand for labor, not a skills mismatch that may be reducing the exit rate from unemployment and therefore increasing the share of the labor force that is long-term unemployed.
Current real average hourly wages, as a share of 2007 wages, by occupation
| Occupation | Current real average hourly wages, as a share of 2007 |
|---|---|
| Productivity growth from 2007–present | 108.0% |
| Business and financial | 105.4% |
| Farming, fishing, and forestry | 105.0% |
| Architecture and engineering | 104.3% |
| Legal | 102.5% |
| Arts, design, entertainment, sports, media | 102.4% |
| Computer and mathematical | 101.5% |
| Healthcare practicitioners | 100.4% |
| Transportation and material moving | 100.1% |
| Construction and extraction | 100.0% |
| Management | 99.9% |
| Education, training, and library | 99.7% |
| Community and social service | 99.7% |
| Office and administrative support | 99.5% |
| Protectice service | 98.8% |
| Food preparation and service | 97.1% |
| Production | 97.0% |
| Healthcare support | 96.4% |
| Life, physical, and social science | 95.9% |
| Installation, maintenance, and repair | 95.8% |
| Building and grounds cleaning | 95.5% |
| Personal care and service | 94.4% |
| Sales and related | 94.4% |
Note: Current is latest 12-month average, 2013Q3–2014Q2.
Source: Authors' analysis of Current Population Survey Outgoing Rotation Group microdata
Unemployment insurance extensions led to a trivial increase in the time it took to take another job
Extended unemployment insurance (UI) benefits passed by Congress during and in the aftermath of the Great Recession expired in December 2013, and they are thus no longer directly affecting the labor market. We nevertheless briefly examine the effect of these extensions on job search intensity of the long-term unemployed, since if large, it arguably might have had a lasting scarring effect on the labor market outcomes of the long-term unemployed. In fact, however, UI extensions have been found to have had no substantial effect on the time it took the long-term unemployed to accept another job. Farber and Valletta (2013) find no statistically significant effect of extended benefits in the Great Recession on “exit to employment.”3 In other words, they find that extended benefits did not cause a significant delay in the time it took people to take another job, which implies that the benefits did not cause a significant increase in the reservation wage or a reduction in search intensity. Farber and Valletta did find, however, that extended benefits had a significant effect on keeping people in the labor force looking for work (presumably because an active job search is a requirement for receiving benefits), which would have increased the unemployment rate slightly. Far from a scarring effect, this labor-force retention is a positive feature since it may increase the share of long-term unemployed workers who ultimately find jobs. Rothstein (2012) found similar results.
Do the long-term unemployed put downward pressure on wages?
As mentioned above, claims that the LTU are now structurally unemployed are typically followed by claims that the LTU should largely be discounted when measuring the degree of labor market slack remaining in the economy. We now examine a specific question to shed light on this debate: Do the LTU put downward pressure on wage growth? If they don’t, that would provide evidence that the LTU are indeed structurally unemployed and should thus be discounted when measuring the degree of labor market slack remaining in the economy. Conversely, a finding that the LTU continue to put downward pressure on wage growth would mean they are a meaningful component of remaining cyclical weakness.
Krueger, Cramer, and Cho (2014) released a paper earlier this year arguing that the LTU put no discernible downward pressure on wage growth. Their finding was interpreted by many as arguing that the LTU largely should be ignored as a measure of remaining labor market slack. In a sense, the paper provided empirical backing for the fear of many that elevated rates of LTU had indeed hardened into structural unemployment unlikely to be remedied by measures to boost aggregate demand.
However, there are two problems with this strong interpretation of the paper’s findings. First, the evidence that an elevated LTUR does not put downward pressure on wages is not robust—other studies find that while an elevated STUR puts greater downward pressure on wages, there does seem to be a statistically and economically significant link between elevated rates of LTU and weak wage growth. Second, even the Krueger, Cramer, and Cho (2014) results cannot strongly distinguish between the separate effects of the STUR and LTUR on wage and price growth outside of the years between 2009 and 2012. This latter fact should not be particularly surprising—the authors primarily use time-series variation in unemployment and wage growth for their estimation. But before 2009, the time-series behavior of the STUR and the LTUR was all but indistinguishable, providing insufficient variation to confidently disentangle the two effects.
Some studies do find downward wage-pressure stemming from elevated LTU
An important issue to note about the Krueger, Cramer, and Cho (2014) results is that the finding on the unimportance of long-term unemployment in generating downward wage pressure has not been robustly supported across other research. Smith (2014), for example, uses the extra variation possible in examining state-level trends in unemployment and wages and finds that the LTUR (and other measures of labor market slack besides the STUR) seem to have significant impacts on wage growth.
He examines 50 states between 1985 and 2013 and finds a strong negative association between a state’s unemployment rate and wage growth. Crucially, he finds:
Splitting the unemployment rate into STU and LTU over this period, the coefficients on the STU and LTU rates are very similar, and statistically indistinguishable from each other and from the coefficient on the total unemployment rate.
This equivalence between the effect of the STUR and LTUR on wage growth holds even after including state-specific time trends, and when examining only the 1994 to 2007 period.
Further, Hatzius and Stehn (2014) also find a significant impact of elevated LTU in restraining wage growth. They emphasize that the Krueger, Cramer, and Cho (2014) regression specification actually uses expected real wage growth as the dependent variable. This expected wage growth is defined as nominal hourly wage growth minus the last period’s inflation rate. Specifications that allow the degree of expected pass-through to vary over time lead to different results. And focusing only on the short-term rates that allow this more flexible specification actually substantially overpredict wage growth relative to a specification that also includes the LTU.
Improving wage-growth predictions in the future: Drop the LTUR or drop 2009–2012?
In addition to disagreement among researchers about the effect of the LTUR on wage growth, Konczal (2014) makes an important point about the interpretations foisted by many onto the Krueger, Cramer, and Cho (2014) research: The paper mostly shows that the puzzle to be solved is the excessively rapid price growth of 2009 to 2012, when all measures of unemployment, even the STUR, were historically elevated. By 2013 (the last data point examined by Krueger, Cramer, and Cho), the prediction of price growth conditional on overall unemployment is exactly on the trend line relating unemployment and inflation. Again, while the Krueger, Cramer, and Cho (2014) results too often have been interpreted as showing a growing irrelevance of LTU for wage and price inflation, the actual results that relate overall unemployment to price inflation show that by 2013 the overall unemployment rate was a better predictor of price inflation than the short-term unemployment rate.
Figure J highlights the degree to which the 2009–2012 period drives the Krueger, Cramer, and Cho (2014) results on wage inflation.4 The top two scatterplots in the figure replicate the figures in Krueger, Cramer, and Cho (2014), showing the relationship between growth in real wage inflation and overall unemployment or short-term unemployment over the entire 1976–2013 period. One interpretation of these figures, from the R-squared of the trend line, is that the prediction of wage inflation is improved if one uses short-term unemployment instead of overall unemployment.
Unemployment and changes in real wage growth and unemployment (overall and short-term), with and without the recovery,1976–2013
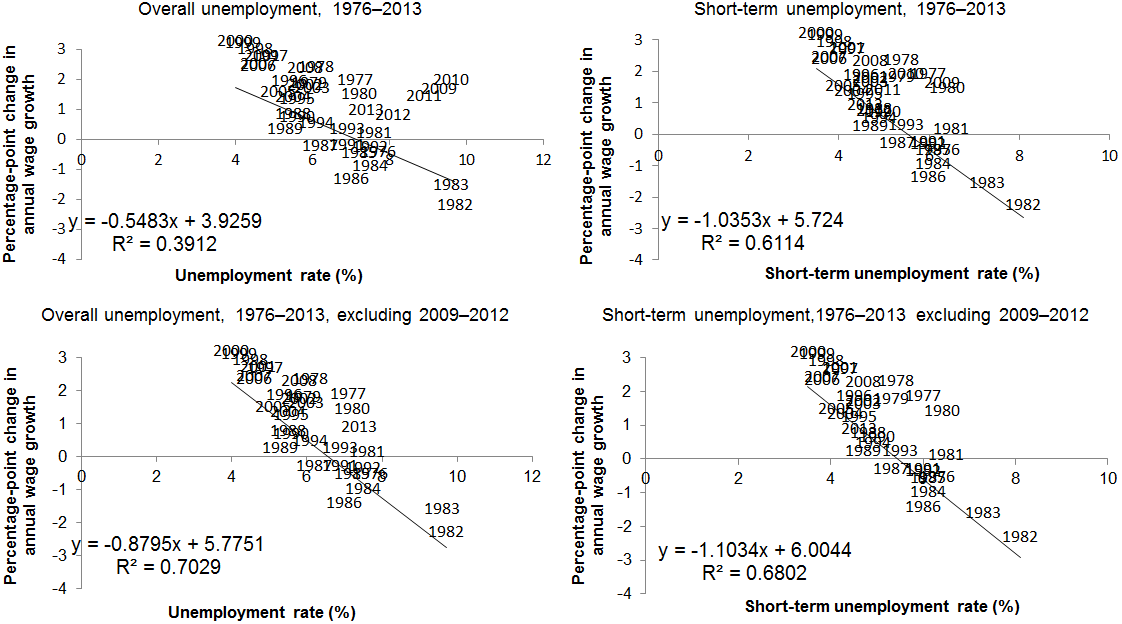
Note: Following Krueger, Cramer, and Cho (2014), hourly wage changes are calculated as changes in nominal hourly wages for production and nonsupervisory workers minus the change in the previous year’s percent change in the personal consumptions expenditures chain price index, excluding food and energy. The change in these annual real wage inflation measures are reported on the vertical axis.
Source: Authors' analysis of data from Current Population Survey public data series and Bureau of Economic Analysis National Income and Product Accounts (Table 2.3.4.)
However, another interpretation is simply that the Krueger, Cramer, and Cho (2014) results show that while wage growth was indeed “too strong” between 2009 and 2012 relative to its past relationship with overall unemployment, each successive year between 2010 and 2013 has seen these data points came closer to historical alignment with the prediction contingent on overall unemployment. Further, when examining the simple bivariate relationships between changes in wage inflation and unemployment, by 2013 the difference between predicted and actual wage inflation using the overall unemployment rate as the independent variable is actually smaller than the difference between the two when using the STUR as the independent variable. This again highlights that ignoring the LTUR, which is part of the overall unemployment rate, and using only the STUR to predict wage growth is an increasingly poor strategy in recent years, contrary to how many have interpreted the Krueger, Cramer, and Cho (2014) results.
The bottom two scatterplots undertake the same exercise but simply remove the 2009–2012 observations. In these graphs, prediction of real wage inflation is (slightly) improved using the overall unemployment rate instead of the short-term rate, according to the respective R-squareds.
This highlights that the striking finding identified by Krueger, Cramer, and Cho (2014) seems to be further confirmation of a puzzle that a number of papers have previously noted: The historical relationship between unemployment and wage growth that held before the Great Recession should have led to much weaker wage growth between 2009 to 2012 than was actually seen. The answer to this puzzle is beyond this paper, but several authors have pointed to downward nominal wage rigidities (DNWR) as a key answer (see, for example, Daly and Hobijn (2014)). Given how particular this divergence between unemployment and wage growth is to 2009–2012, however, it seems far too thin a reed with which to justify abandoning the overall unemployment rate as a predictor of wage changes. More importantly, there is nothing in the Krueger, Cramer, and Cho (2014) results suggesting that in the future, one should expect the LTU to exert less downward pressure on wage and price inflation because they have somehow been too scarred by long unemployment spells.
Currently, long-term unemployment is what we would expect given historical trends
This section looks directly at the behavior of the unemployment rate and the long-term unemployment rate over the Great Recession and recovery to see if there has been a change in the historic relationship between these that would suggest that the LTU no longer constitute a reliable indicator of labor market slack. As noted above (see Figure A), while the LTUR and the STUR clearly move in tandem over the business cycle, the large increase in the LTUR between the spring of 2008 and the spring of 2010 is striking. This very large increase during (and immediately after) the Great Recession has led to an unusually elevated LTUR for an extended period, even as the LTUR has largely followed the STUR down over the official recovery.
Table 2 provides the results of an exercise that investigates whether the historic relationship between the overall unemployment rate and the long-term unemployment rate has changed in the aftermath of the Great Recession. In this exercise, we quantify the relationship between the overall unemployment rate and the long-term unemployment rate from 1979 to 2007, and then examine whether that relationship has held since 2007. In particular, we look at the change in the long-term unemployment rate between June 2007 and June 2014 and determine how much of that change is due to various factors that are explained by the historical relationship between the overall unemployment rate and the long-term unemployment rate, and how much is left unexplained. A high unexplained share would indicate a break from the historical relationship and suggest that the long-term unemployed have potentially hardened into a group that is largely disconnected from labor markets and no longer contributing to labor market slack. On the other hand, a low unexplained share would indicate that while our long-term unemployment rate remains very elevated, it is simply what would be expected given the broader weakness in the labor market. The detailed methodology of the exercise is described in Appendix A.
Decomposition of the 1.2 percentage-point increase in the long-term unemployment rate between June 2007 and June 2014
| Percentage-points explained by: | (1) | (2) | (3) |
|---|---|---|---|
| Changing demographics | 0.0 | 0.0 | 0.0 |
| Change in current unemployment rate | 0.2 | 0.6 | 0.2 |
| Long-run time trend | 0.2 | 0.2 | |
| Change in unemployment rate over last six and 12 months | 0.7 | ||
| Unexplained | 1.0 | 0.4 | 0.1 |
| Total change | 1.2 | 1.2 | 1.2 |
Note: For methodological notes, see Appendix A.
Source: Authors' analysis of basic monthly Current Population Survey microdata
Between June 2007 and June 2014, the long-term unemployment rate rose 1.2 percentage points from 0.7 percent to 1.9 percent. We present, in three steps, the exercise that quantifies how much of that increase is “unexplained” and might indicate a change in the relationship between long-term unemployment and the overall unemployment rate. The first column of Table 2 shows the first step. This step decomposes the change in the long-term unemployment rate between June 2007 and June 2014 into three factors: the amount that can be explained by changing demographics (namely gender, education, and age); the amount that can be explained by changes in the current unemployment rate; and the unexplained portion. Changing demographics explains essentially none of the change. The table only presents results to one decimal point but in fact changing demographics reduced the long-term unemployment rate slightly over this period, by 0.03 percentage points. This is due to the fact that educational attainment is increasing and (as shown in Table 1), workers with higher levels of education face lower long-term unemployment rates. The aging of the workforce also would have decreased the long-term unemployment rate somewhat, as older workers tend to have slightly lower long-term unemployment rates (also shown in Table 1).5 The current unemployment rate explains a small portion of the increase in long-term unemployment between June 2007 and June 2014, 0.2 percentage points. Most of the increase in the long-term unemployment rate, 1.0 percentage points, is unexplained. Findings along these lines are what lead people to believe that the long-term unemployed in the aftermath of the Great Recession have become so scarred and disconnected that they now face barriers to work that are unrelated to the broader weakness in the labor market.
However, the second step in the exercise is to note that there were trends in long-term unemployment that existed before the Great Recession started. In particular, the share of the unemployed that is unemployed long-term has been generally rising since the late 1960s. It is important to control for these long-run trends in any assessment of whether the long-term unemployment rate has broken from its historical pattern. Column 2 of Table 2 decomposes the change in the long-term unemployment rate between June 2007 and June 2014 into the same factors as above, along with an additional factor, a time trend. The time trend explains a small amount of the increase (0.2 percentage points) in the long-term unemployment rate between June 2007 and June 2014, and its inclusion also increases the amount of the increase that is explained by the current unemployment rate. With the inclusion of the time trend, only 0.4 percentage points of the increase in the unemployment rate is unexplained.
Finally, it is important to note that the contemporaneous unemployment rate is unlikely to fully capture the economic conditions that affect the long-term unemployment rate. By its nature, the long-term unemployment rate is a function of economic conditions in the recent past, not just the current situation. The third step in the exercise is thus to control for the average unemployment rate in the previous six and previous 12 months. Including these controls increases the total share explained by the unemployment rate (current and previous combined) to 0.9 percentage points. Only 0.1 percentage points of the 1.2 percentage-point increase in the long-term unemployment rate remains unexplained. In other words, almost all of the increase in the long-term unemployment rate since 2007 can be explained by the historic relationship between the long-term unemployment rate and the overall unemployment rate. It is not that the long-term unemployed have hardened into a group that is largely disconnected from the labor market. Long-term unemployment remains very elevated, but its current level is what would be expected given the broader weakness in the labor market.
Figure K shows the results of the exercise in another way. It shows the actual long-term unemployment rate, along with the predicted unemployment rate based on the models described above. The long-term unemployment rate as predicted by the contemporaneous unemployment rate alone is very far from the actual long-term unemployment rate. Including a time trend improves the “fit,” and including the average unemployment rate for the prior six and 12 months improves the fit even further. This model shows that at this point in the recovery, the predicted long-term unemployment rate based on relationships that prevailed before the Great Recession began is roughly identical to the actual long-term unemployment rate. Instead, what was unusual was the large increase in the LTUR relative to the overall unemployment rate during the Great Recession (and its immediate aftermath). But the timing of this rise alone (i.e., during and immediately after the sharpest and longest economic contraction since the Great Depression) argues strongly for cyclical causes. In particular, this large increase in the LTUR can likely be explained by the dynamics of labor market flows during the Great Recession, namely a very large increase in layoffs in the Great Recession combined with a collapse in hiring from which we have yet to fully recover, more than five years into the official recovery. Even if there was no difference in job-finding rates between the short-term unemployed and the LTU, this pattern would have combined to raise the LTUR significantly.
Actual and predicted long-term unemployment rate, June 2000–June 2014
| Actual rate | Predicted rate based on current unemployment rate | Predicted rate based on current unemployment rate and long-run time trend | Predicted rate based on current unemployment rate, long-run time trend, and lagged unemployment rate | |
|---|---|---|---|---|
| 1987/06/01 | 0.9% | 1.1% | 0.9% | 1.0% |
| 1987/07/01 | 0.8% | 1.0% | 0.8% | 0.9% |
| 1987/08/01 | 0.8% | 1.0% | 0.7% | 0.9% |
| 1987/09/01 | 0.8% | 1.0% | 0.7% | 0.8% |
| 1987/10/01 | 0.7% | 1.0% | 0.7% | 0.8% |
| 1987/11/01 | 0.7% | 0.9% | 0.7% | 0.7% |
| 1987/12/01 | 0.7% | 0.9% | 0.6% | 0.7% |
| 1988/01/01 | 0.7% | 1.1% | 0.9% | 0.7% |
| 1988/02/01 | 0.8% | 1.1% | 0.9% | 0.7% |
| 1988/03/01 | 0.7% | 1.0% | 0.8% | 0.7% |
| 1988/04/01 | 0.7% | 0.9% | 0.6% | 0.7% |
| 1988/05/01 | 0.7% | 0.9% | 0.6% | 0.7% |
| 1988/06/01 | 0.6% | 0.9% | 0.7% | 0.6% |
| 1988/07/01 | 0.6% | 0.9% | 0.7% | 0.6% |
| 1988/08/01 | 0.6% | 0.9% | 0.6% | 0.6% |
| 1988/09/01 | 0.6% | 0.9% | 0.6% | 0.6% |
| 1988/10/01 | 0.6% | 0.8% | 0.5% | 0.5% |
| 1988/11/01 | 0.5% | 0.8% | 0.6% | 0.5% |
| 1988/12/01 | 0.6% | 0.8% | 0.5% | 0.5% |
| 1995/07/01 | 1.0% | 0.9% | 1.0% | 0.9% |
| 1995/08/01 | 0.9% | 0.9% | 0.9% | 0.9% |
| 1995/09/01 | 0.9% | 0.9% | 0.8% | 0.9% |
| 1995/10/01 | 0.9% | 0.8% | 0.8% | 0.8% |
| 1995/11/01 | 0.9% | 0.8% | 0.8% | 0.8% |
| 1995/12/01 | 0.9% | 0.8% | 0.8% | 0.8% |
| 1996/01/01 | 1.0% | 1.0% | 1.1% | 0.9% |
| 1996/02/01 | 0.9% | 1.0% | 1.0% | 0.9% |
| 1996/03/01 | 1.1% | 0.9% | 1.0% | 0.9% |
| 1996/04/01 | 1.1% | 0.9% | 0.8% | 0.9% |
| 1996/05/01 | 1.0% | 0.9% | 0.8% | 0.9% |
| 1996/06/01 | 1.0% | 0.9% | 0.9% | 0.9% |
| 1996/07/01 | 1.0% | 0.9% | 0.9% | 0.9% |
| 1996/08/01 | 0.9% | 0.8% | 0.8% | 0.8% |
| 1996/09/01 | 0.9% | 0.8% | 0.7% | 0.8% |
| 1996/10/01 | 0.8% | 0.8% | 0.7% | 0.8% |
| 1996/11/01 | 0.8% | 0.8% | 0.8% | 0.8% |
| 1996/12/01 | 0.8% | 0.8% | 0.7% | 0.8% |
| 1997/01/01 | 0.9% | 1.0% | 1.1% | 0.9% |
| 1997/02/01 | 0.9% | 0.9% | 1.0% | 0.8% |
| 1997/03/01 | 0.9% | 0.9% | 0.9% | 0.8% |
| 1997/04/01 | 0.8% | 0.8% | 0.7% | 0.8% |
| 1997/05/01 | 0.8% | 0.7% | 0.7% | 0.8% |
| 1997/06/01 | 0.7% | 0.8% | 0.8% | 0.8% |
| 1997/07/01 | 0.8% | 0.8% | 0.8% | 0.8% |
| 1997/08/01 | 0.8% | 0.7% | 0.7% | 0.7% |
| 1997/09/01 | 0.8% | 0.7% | 0.7% | 0.7% |
| 1997/10/01 | 0.7% | 0.7% | 0.6% | 0.7% |
| 1997/11/01 | 0.7% | 0.7% | 0.6% | 0.6% |
| 1997/12/01 | 0.7% | 0.7% | 0.6% | 0.6% |
| 1998/01/01 | 0.8% | 0.8% | 0.8% | 0.7% |
| 1998/02/01 | 0.7% | 0.8% | 0.8% | 0.7% |
| 1998/03/01 | 0.7% | 0.8% | 0.8% | 0.6% |
| 1998/04/01 | 0.7% | 0.6% | 0.5% | 0.6% |
| 1998/05/01 | 0.6% | 0.6% | 0.5% | 0.6% |
| 1998/06/01 | 0.5% | 0.7% | 0.7% | 0.6% |
| 1998/07/01 | 0.6% | 0.7% | 0.7% | 0.6% |
| 1998/08/01 | 0.6% | 0.7% | 0.6% | 0.6% |
| 1998/09/01 | 0.6% | 0.7% | 0.6% | 0.5% |
| 1998/10/01 | 0.6% | 0.6% | 0.5% | 0.5% |
| 1998/11/01 | 0.6% | 0.6% | 0.5% | 0.5% |
| 1998/12/01 | 0.6% | 0.6% | 0.5% | 0.5% |
| 1999/01/01 | 0.6% | 0.7% | 0.7% | 0.5% |
| 1999/02/01 | 0.6% | 0.7% | 0.7% | 0.5% |
| 1999/03/01 | 0.5% | 0.7% | 0.6% | 0.5% |
| 1999/04/01 | 0.5% | 0.6% | 0.5% | 0.5% |
| 1999/05/01 | 0.5% | 0.6% | 0.4% | 0.5% |
| 1999/06/01 | 0.6% | 0.7% | 0.6% | 0.5% |
| 1999/07/01 | 0.5% | 0.7% | 0.6% | 0.5% |
| 1999/08/01 | 0.5% | 0.6% | 0.5% | 0.5% |
| 1999/09/01 | 0.5% | 0.6% | 0.5% | 0.5% |
| 1999/10/01 | 0.5% | 0.6% | 0.4% | 0.4% |
| 1999/11/01 | 0.5% | 0.6% | 0.4% | 0.4% |
| 1999/12/01 | 0.5% | 0.6% | 0.4% | 0.4% |
| 2000/01/01 | 0.5% | 0.7% | 0.6% | 0.5% |
| 2000/02/01 | 0.5% | 0.7% | 0.6% | 0.5% |
| 2000/03/01 | 0.5% | 0.6% | 0.6% | 0.4% |
| 2000/04/01 | 0.4% | 0.5% | 0.4% | 0.4% |
| 2000/05/01 | 0.4% | 0.6% | 0.4% | 0.4% |
| 2000/06/01 | 0.4% | 0.6% | 0.5% | 0.4% |
| 2000/07/01 | 0.5% | 0.6% | 0.6% | 0.4% |
| 2000/08/01 | 0.5% | 0.6% | 0.5% | 0.4% |
| 2000/09/01 | 0.4% | 0.6% | 0.4% | 0.4% |
| 2000/10/01 | 0.4% | 0.5% | 0.4% | 0.4% |
| 2000/11/01 | 0.4% | 0.6% | 0.4% | 0.4% |
| 2000/12/01 | 0.4% | 0.5% | 0.4% | 0.4% |
| 2001/01/01 | 0.5% | 0.7% | 0.7% | 0.4% |
| 2001/02/01 | 0.5% | 0.7% | 0.7% | 0.4% |
| 2001/03/01 | 0.5% | 0.7% | 0.7% | 0.5% |
| 2001/04/01 | 0.5% | 0.6% | 0.6% | 0.4% |
| 2001/05/01 | 0.4% | 0.6% | 0.5% | 0.5% |
| 2001/06/01 | 0.5% | 0.7% | 0.8% | 0.5% |
| 2001/07/01 | 0.5% | 0.7% | 0.8% | 0.6% |
| 2001/08/01 | 0.6% | 0.7% | 0.8% | 0.6% |
| 2001/09/01 | 0.6% | 0.7% | 0.8% | 0.6% |
| 2001/10/01 | 0.6% | 0.8% | 0.8% | 0.6% |
| 2001/11/01 | 0.7% | 0.8% | 1.0% | 0.7% |
| 2001/12/01 | 0.8% | 0.8% | 1.0% | 0.8% |
| 2002/01/01 | 0.9% | 1.0% | 1.3% | 0.9% |
| 2002/02/01 | 0.9% | 0.9% | 1.2% | 0.9% |
| 2002/03/01 | 1.0% | 0.9% | 1.2% | 1.0% |
| 2002/04/01 | 1.0% | 0.9% | 1.1% | 1.0% |
| 2002/05/01 | 1.1% | 0.9% | 1.1% | 1.0% |
| 2002/06/01 | 1.1% | 0.9% | 1.2% | 1.1% |
| 2002/07/01 | 1.1% | 0.9% | 1.2% | 1.1% |
| 2002/08/01 | 1.1% | 0.9% | 1.1% | 1.1% |
| 2002/09/01 | 1.1% | 0.8% | 1.0% | 1.1% |
| 2002/10/01 | 1.1% | 0.8% | 1.0% | 1.1% |
| 2002/11/01 | 1.2% | 0.9% | 1.1% | 1.2% |
| 2002/12/01 | 1.3% | 0.9% | 1.1% | 1.2% |
| 2003/01/01 | 1.3% | 1.0% | 1.4% | 1.3% |
| 2003/02/01 | 1.3% | 1.0% | 1.4% | 1.2% |
| 2003/03/01 | 1.3% | 1.0% | 1.3% | 1.3% |
| 2003/04/01 | 1.4% | 0.9% | 1.2% | 1.2% |
| 2003/05/01 | 1.3% | 0.9% | 1.2% | 1.3% |
| 2003/06/01 | 1.4% | 1.0% | 1.4% | 1.3% |
| 2003/07/01 | 1.3% | 1.0% | 1.4% | 1.3% |
| 2003/08/01 | 1.4% | 0.9% | 1.3% | 1.3% |
| 2003/09/01 | 1.3% | 0.9% | 1.2% | 1.3% |
| 2003/10/01 | 1.3% | 0.8% | 1.1% | 1.3% |
| 2003/11/01 | 1.3% | 0.9% | 1.1% | 1.3% |
| 2003/12/01 | 1.3% | 0.8% | 1.1% | 1.3% |
| 2004/01/01 | 1.4% | 1.0% | 1.4% | 1.3% |
| 2004/02/01 | 1.3% | 0.9% | 1.3% | 1.3% |
| 2004/03/01 | 1.4% | 0.9% | 1.3% | 1.3% |
| 2004/04/01 | 1.3% | 0.8% | 1.0% | 1.2% |
| 2004/05/01 | 1.2% | 0.8% | 1.0% | 1.2% |
| 2004/06/01 | 1.2% | 0.9% | 1.2% | 1.3% |
| 2004/07/01 | 1.1% | 0.9% | 1.2% | 1.3% |
| 2004/08/01 | 1.1% | 0.8% | 1.1% | 1.2% |
| 2004/09/01 | 1.1% | 0.8% | 1.0% | 1.2% |
| 2004/10/01 | 1.1% | 0.8% | 1.0% | 1.1% |
| 2004/11/01 | 1.1% | 0.8% | 1.0% | 1.1% |
| 2004/12/01 | 1.1% | 0.8% | 1.0% | 1.1% |
| 2005/01/01 | 1.2% | 0.9% | 1.2% | 1.2% |
| 2005/02/01 | 1.1% | 0.9% | 1.2% | 1.2% |
| 2005/03/01 | 1.2% | 0.8% | 1.1% | 1.1% |
| 2005/04/01 | 1.1% | 0.7% | 0.9% | 1.1% |
| 2005/05/01 | 1.0% | 0.7% | 0.9% | 1.1% |
| 2005/06/01 | 0.9% | 0.8% | 1.0% | 1.1% |
| 2005/07/01 | 0.9% | 0.8% | 1.0% | 1.1% |
| 2005/08/01 | 0.9% | 0.7% | 0.9% | 1.0% |
| 2005/09/01 | 1.0% | 0.7% | 0.9% | 1.0% |
| 2005/10/01 | 0.9% | 0.7% | 0.8% | 1.0% |
| 2005/11/01 | 0.9% | 0.7% | 0.9% | 1.0% |
| 2005/12/01 | 0.9% | 0.7% | 0.8% | 1.0% |
| 2006/01/01 | 0.8% | 0.8% | 1.0% | 1.0% |
| 2006/02/01 | 0.9% | 0.8% | 1.0% | 1.0% |
| 2006/03/01 | 0.9% | 0.7% | 0.9% | 1.0% |
| 2006/04/01 | 0.9% | 0.7% | 0.8% | 0.9% |
| 2006/05/01 | 0.9% | 0.7% | 0.8% | 0.9% |
| 2006/06/01 | 0.7% | 0.7% | 0.9% | 0.9% |
| 2006/07/01 | 0.8% | 0.7% | 1.0% | 0.9% |
| 2006/08/01 | 0.9% | 0.7% | 0.9% | 0.9% |
| 2006/09/01 | 0.8% | 0.7% | 0.8% | 0.9% |
| 2006/10/01 | 0.7% | 0.6% | 0.7% | 0.8% |
| 2006/11/01 | 0.7% | 0.6% | 0.7% | 0.8% |
| 2006/12/01 | 0.7% | 0.6% | 0.7% | 0.8% |
| 2007/01/01 | 0.8% | 0.8% | 1.0% | 0.9% |
| 2007/02/01 | 0.8% | 0.7% | 0.9% | 0.9% |
| 2007/03/01 | 0.8% | 0.7% | 0.8% | 0.8% |
| 2007/04/01 | 0.8% | 0.6% | 0.7% | 0.8% |
| 2007/05/01 | 0.7% | 0.6% | 0.7% | 0.8% |
| 2007/06/01 | 0.7% | 0.7% | 0.9% | 0.9% |
| 2007/07/01 | 0.8% | 0.7% | 0.9% | 0.9% |
| 2007/08/01 | 0.8% | 0.7% | 0.9% | 0.8% |
| 2007/09/01 | 0.8% | 0.7% | 0.8% | 0.8% |
| 2007/10/01 | 0.8% | 0.6% | 0.8% | 0.8% |
| 2007/11/01 | 0.9% | 0.7% | 0.8% | 0.8% |
| 2007/12/01 | 0.8% | 0.7% | 0.9% | 0.9% |
| 2008/01/01 | 0.9% | 0.8% | 1.1% | 1.0% |
| 2008/02/01 | 0.9% | 0.8% | 1.1% | 0.9% |
| 2008/03/01 | 0.9% | 0.8% | 1.1% | 1.0% |
| 2008/04/01 | 0.9% | 0.7% | 0.9% | 0.9% |
| 2008/05/01 | 1.0% | 0.8% | 1.1% | 1.0% |
| 2008/06/01 | 1.0% | 0.9% | 1.3% | 1.1% |
| 2008/07/01 | 1.1% | 0.9% | 1.4% | 1.2% |
| 2008/08/01 | 1.2% | 0.9% | 1.4% | 1.2% |
| 2008/09/01 | 1.3% | 0.9% | 1.4% | 1.2% |
| 2008/10/01 | 1.4% | 0.9% | 1.4% | 1.3% |
| 2008/11/01 | 1.4% | 1.0% | 1.5% | 1.4% |
| 2008/12/01 | 1.6% | 1.1% | 1.8% | 1.5% |
| 2009/01/01 | 1.8% | 1.3% | 2.3% | 1.7% |
| 2009/02/01 | 2.0% | 1.3% | 2.4% | 1.9% |
| 2009/03/01 | 2.2% | 1.4% | 2.5% | 2.0% |
| 2009/04/01 | 2.5% | 1.3% | 2.3% | 2.1% |
| 2009/05/01 | 2.6% | 1.4% | 2.5% | 2.2% |
| 2009/06/01 | 2.7% | 1.5% | 2.8% | 2.4% |
| 2009/07/01 | 3.2% | 1.5% | 2.8% | 2.5% |
| 2009/08/01 | 3.3% | 1.4% | 2.7% | 2.6% |
| 2009/09/01 | 3.6% | 1.4% | 2.7% | 2.7% |
| 2009/10/01 | 3.6% | 1.4% | 2.6% | 2.7% |
| 2009/11/01 | 3.8% | 1.4% | 2.6% | 2.8% |
| 2009/12/01 | 3.9% | 1.4% | 2.7% | 2.9% |
| 2010/01/01 | 4.2% | 1.6% | 3.1% | 3.1% |
| 2010/02/01 | 4.1% | 1.6% | 3.0% | 3.1% |
| 2010/03/01 | 4.4% | 1.5% | 2.9% | 3.1% |
| 2010/04/01 | 4.6% | 1.4% | 2.7% | 3.1% |
| 2010/05/01 | 4.3% | 1.4% | 2.7% | 3.1% |
| 2010/06/01 | 4.1% | 1.5% | 2.8% | 3.2% |
| 2010/07/01 | 4.2% | 1.5% | 2.8% | 3.2% |
| 2010/08/01 | 4.1% | 1.4% | 2.7% | 3.1% |
| 2010/09/01 | 4.0% | 1.4% | 2.6% | 3.1% |
| 2010/10/01 | 4.0% | 1.3% | 2.5% | 3.0% |
| 2010/11/01 | 4.1% | 1.4% | 2.6% | 3.1% |
| 2010/12/01 | 4.0% | 1.4% | 2.6% | 3.1% |
| 2011/01/01 | 4.1% | 1.5% | 2.8% | 3.1% |
| 2011/02/01 | 4.0% | 1.4% | 2.7% | 3.1% |
| 2011/03/01 | 4.1% | 1.4% | 2.6% | 3.0% |
| 2011/04/01 | 4.0% | 1.3% | 2.4% | 2.9% |
| 2011/05/01 | 4.0% | 1.3% | 2.5% | 2.9% |
| 2011/06/01 | 3.9% | 1.4% | 2.7% | 3.0% |
| 2011/07/11 | 4.0% | 1.4% | 2.7% | 3.0% |
| 2011/08/20 | 3.9% | 1.4% | 2.6% | 2.9% |
| 2011/09/01 | 4.0% | 1.3% | 2.5% | 2.9% |
| 2011/10/11 | 3.7% | 1.3% | 2.4% | 2.8% |
| 2011/11/20 | 3.6% | 1.2% | 2.3% | 2.8% |
| 2011/12/30 | 3.5% | 1.2% | 2.3% | 2.8% |
| 2012/01/12 | 3.6% | 1.3% | 2.5% | 2.8% |
| 2012/02/12 | 3.5% | 1.3% | 2.4% | 2.8% |
| 2012/03/12 | 3.5% | 1.2% | 2.3% | 2.7% |
| 2012/04/12 | 3.4% | 1.1% | 2.1% | 2.6% |
| 2012/05/12 | 3.5% | 1.2% | 2.2% | 2.6% |
| 2012/06/12 | 3.3% | 1.2% | 2.4% | 2.7% |
| 2012/07/12 | 3.4% | 1.3% | 2.4% | 2.7% |
| 2012/08/12 | 3.2% | 1.2% | 2.3% | 2.6% |
| 2012/09/12 | 3.1% | 1.1% | 2.1% | 2.5% |
| 2012/10/12 | 3.2% | 1.1% | 2.0% | 2.5% |
| 2012/11/12 | 3.0% | 1.1% | 2.0% | 2.4% |
| 2012/12/12 | 3.0% | 1.1% | 2.1% | 2.5% |
| 2013/01/12 | 3.1% | 1.2% | 2.4% | 2.5% |
| 2013/02/12 | 3.1% | 1.2% | 2.2% | 2.5% |
| 2013/03/12 | 3.0% | 1.1% | 2.1% | 2.4% |
| 2013/04/12 | 2.9% | 1.0% | 1.9% | 2.4% |
| 2013/05/12 | 2.8% | 1.1% | 2.0% | 2.4% |
| 2013/06/12 | 2.7% | 1.1% | 2.2% | 2.4% |
| 2013/07/12 | 2.7% | 1.1% | 2.1% | 2.4% |
| 2013/08/12 | 2.7% | 1.1% | 2.0% | 2.3% |
| 2013/09/12 | 2.6% | 1.0% | 1.9% | 2.3% |
| 2013/10/12 | 2.6% | 1.0% | 1.8% | 2.2% |
| 2013/11/12 | 2.6% | 0.9% | 1.7% | 2.2% |
| 2013/12/12 | 2.4% | 0.9% | 1.7% | 2.2% |
| 2014/01/12 | 2.4% | 1.0% | 1.9% | 2.2% |
| 2014/02/12 | 2.5% | 1.0% | 1.9% | 2.1% |
| 2014/03/12 | 2.4% | 1.0% | 1.8% | 2.1% |
| 2014/04/12 | 2.2% | 0.8% | 1.5% | 2.0% |
| 2014/05/12 | 2.2% | 0.9% | 1.5% | 2.0% |
| 2014/06/12 | 1.9% | 0.9% | 1.6% | 2.0% |
Source: Authors' analysis of basic monthly Current Population Survey microdata
Much of the improvement in the overall unemployment rate in this recovery has been due to potential workers dropping out of, or never entering, the labor force, rather than potential workers finding jobs (EPI 2014). Thus, one issue worth investigating is whether the large drop in the long-term unemployment rate in the recovery has been due to the long-term unemployed disproportionately dropping out of the labor force. Work by Katharine Abraham, however, shows that the rate of “labor force exit”—i.e., dropping out of the labor force—in this recovery has been roughly the same for the long-term unemployed and the short-term unemployed (Abraham 2014). Relative to the short-term unemployed, the long-term unemployed are perhaps surprisingly attached to the labor force in this recovery. In other words, the rapid improvement in the long-term unemployment rate relative to the short-term unemployment rate is largely not attributable to the long-term unemployed being more likely to just stop looking for work and therefore not be counted as unemployed.
Conclusion
With this work, we do not mean to suggest that long-term unemployment could never be associated with greater difficulty in reentering employment. In fact, audit studies show that the long-term unemployed have significantly lower chances of being called back for an interview (Ghayad 2013). This would lower the likelihood of the long-term unemployed finding a job in a reasonable time frame and likely lower their earnings when they do find a job. What we have shown is that despite this, the long-term unemployed are surprisingly attached to the labor force, and that as the labor market has slowly but measurably improved in the last three years, the long-term unemployed have also benefited from that improvement—and in exactly the way that historical relationships would suggest. In other words, the LTU have largely not hardened into structural unemployment in the wake of the Great Recession and slow recovery, which means that we can lower the long-term unemployment rate by boosting aggregate demand.
—The authors thank the Peter G. Peterson Foundation for financial support for this work; and, at EPI, Will Kimball and Hilary Wething for research assistance.
About the authors
Josh Bivens joined the Economic Policy Institute in 2002 and is currently the director of research and policy. His primary areas of research include macroeconomics, social insurance, and globalization. He has authored or coauthored three books (including The State of Working America, 12th Edition) while working at EPI, edited another, and has written numerous research papers, including for academic journals. He appears often in media outlets to offer economic commentary and has testified several times before the U.S. Congress. He earned his Ph.D. from The New School for Social Research.
Heidi Shierholz joined the Economic Policy Institute as an economist in 2007. She has researched and spoken widely on the economy and economic policy as it affects middle- and low-income families, especially in regards to employment, unemployment, labor force participation, compensation, income and wealth inequality, young workers, unemployment insurance, and the minimum wage. Shierholz is a coauthor of The State of Working America, 12th Edition, is a frequent contributor to broadcast and radio news outlets, is regularly quoted in print and online media outlets, and has repeatedly been called to testify in Congress on labor market issues. Prior to joining EPI, Shierholz worked as an assistant professor of economics at the University of Toronto. She holds a Ph.D. in economics from the University of Michigan at Ann Arbor.
Appendix A: Analysis for Table 1, and Appendix Table B1 (LTUR by State)
Our analysis for Table 2 follows the same exercise carried out in Rothstein (2012), though we decompose the long-term unemployment rate (LTUR) while he decomposed the share of the unemployed that is long-term unemployed. First, we compute the long-term unemployment rate of workers in each of 60 groups defined by their gender, educational attainment (less than high school, high school, some college, bachelor’s degree, or advanced degree), and age group (16–24, 25–34, 35–44, 45–54, 55–64, or 65+). Letting represent the long-term unemployment rate for group g in month t, the overall long-term unemployment rate in month t can be written as

where is the fraction of the labor force in group g in month t. Then, using data from January 1979– June 2007, we estimate a set of regressions (one for each group) of the form

where is the overall unemployment rate in month t. Coefficients from these regressions are used to compute residuals () in each month through June 2014. Equations (1) and (2) are used to decompose the change in the long-term unemployment rate between t and t’. In particular,
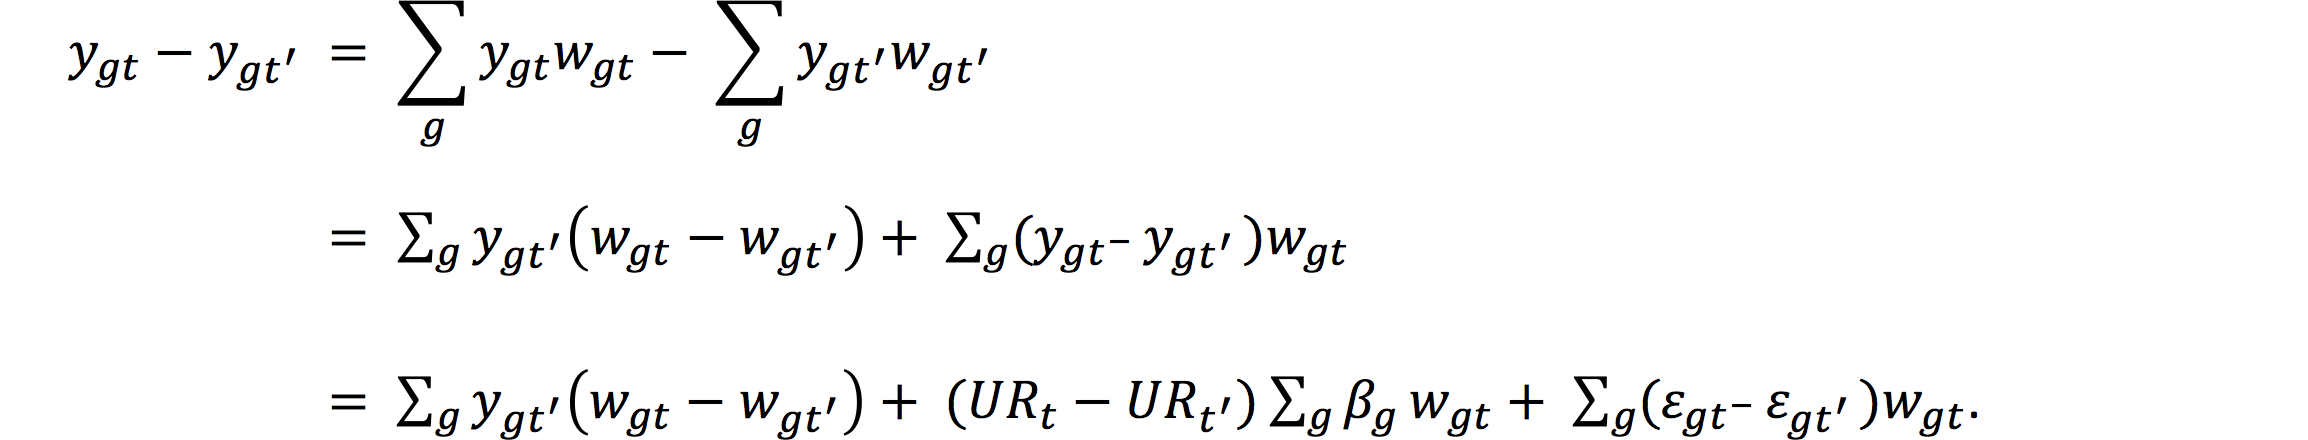
The three terms in the last line represent the contribution to the change in the long-term unemployment rate of (i) changes in the demographic composition, (ii) changes in economic conditions, and (iii) other changes not explained by the first two factors. This is the model used in the first column of Table 2. For the second column in Table 2, a linear time trend along with the interaction of the time trend and the UR is added to equation (2). An interaction is added due to evidence that the cyclical sensitivity of long-term unemployment may have risen over time (see Rothstein 2012, 26). For the third column in Table 2, the average UR for the prior six months and the prior 12 months, along with the interactions of these variables and a time trend are also added. In the regressions with interaction terms (columns two and three in the table), the UR contribution from the interaction term is computed holding t at June 2014, and the “Long-run time trend” includes the time trend term and the interaction term minus the UR contribution from the interaction term.
Long-term unemployment rates, by state, 2007 and 2013
| 2007 | 2013 | Ratio (2013/2007) | |
|---|---|---|---|
| United States | 0.8% | 2.8% | 3.4 |
| Alabama | 0.7% | 2.4% | 3.3 |
| Alaska | 0.6% | 1.7% | 3.1 |
| Arizona | 0.5% | 2.5% | 5.1 |
| Arkansas | 0.7% | 2.4% | 3.5 |
| California | 0.9% | 3.6% | 4.0 |
| Colorado | 0.5% | 2.5% | 5.1 |
| Connecticut | 0.9% | 3.3% | 3.6 |
| Delaware | 0.5% | 2.4% | 5.0 |
| District of Columbia | 1.0% | 4.0% | 3.9 |
| Florida | 0.6% | 3.3% | 5.4 |
| Georgia | 0.8% | 3.4% | 4.6 |
| Hawaii | 0.4% | 1.6% | 3.9 |
| Idaho | 0.3% | 1.6% | 5.2 |
| Illinois | 1.2% | 3.7% | 3.3 |
| Indiana | 0.8% | 2.2% | 2.8 |
| Iowa | 0.5% | 1.0% | 2.0 |
| Kansas | 0.6% | 1.6% | 2.5 |
| Kentucky | 0.8% | 2.6% | 3.5 |
| Louisiana | 1.0% | 2.4% | 2.5 |
| Maine | 0.7% | 2.1% | 3.1 |
| Maryland | 0.7% | 2.4% | 3.6 |
| Massachusetts | 0.9% | 2.5% | 2.8 |
| Michigan | 1.7% | 3.1% | 1.8 |
| Minnesota | 0.6% | 1.3% | 2.2 |
| Mississippi | 1.2% | 3.6% | 3.1 |
| Missouri | 1.1% | 2.6% | 2.3 |
| Montana | 0.5% | 1.4% | 2.9 |
| Nebraska | 0.4% | 1.1% | 3.1 |
| Nevada | 0.6% | 3.9% | 6.4 |
| New Hampshire | 0.4% | 1.7% | 4.0 |
| New Jersey | 0.9% | 3.8% | 4.3 |
| New Mexico | 0.5% | 3.0% | 6.5 |
| New York | 1.0% | 3.4% | 3.3 |
| North Carolina | 0.8% | 3.4% | 4.5 |
| North Dakota | 0.3% | 0.6% | 1.9 |
| Ohio | 1.0% | 2.6% | 2.6 |
| Oklahoma | 0.7% | 1.3% | 1.8 |
| Oregon | 0.6% | 2.8% | 4.4 |
| Pennsylvania | 0.7% | 3.0% | 4.5 |
| Rhode Island | 0.8% | 4.1% | 4.9 |
| South Carolina | 1.1% | 2.7% | 2.5 |
| South Dakota | 0.4% | 0.6% | 1.5 |
| Tennessee | 0.9% | 2.6% | 3.0 |
| Texas | 0.7% | 1.9% | 2.8 |
| Utah | 0.3% | 1.0% | 3.8 |
| Vermont | 0.7% | 1.0% | 1.6 |
| Virginia | 0.5% | 2.0% | 4.3 |
| Washington | 0.6% | 2.1% | 3.5 |
| West Virginia | 0.6% | 2.4% | 4.1 |
| Wisconsin | 1.1% | 2.3% | 2.1 |
| Wyoming | 0.2% | 1.0% | 6.2 |
Note: The ratio may not reflect the quotient of 2013 over 2007 column data due to rounding. The long-term unemployment rate is the share of the labor force that has been unemployed for 27 weeks or more.
Source: Authors' analysis of basic monthly Current Population Survey microdata
Endnotes
1. The NAIRU is the level of unemployment in an economy that does not cause inflation to increase.
2. The profit margin did dip in the first quarter of 2014, but this measure was strongly affected by the expiration of the bonus depreciation allowance that was passed as economic stimulus at the end of 2010. The expiration of the bonus depreciation directly affects the NIPA measurement of depreciation (increasing it), which leads to a sharp reduction in profits net of deprecation for the quarter. Mericle (2014) has argued strongly that the first quarter 2014 numbers should not be taken as evidence that profit margins have peaked.
3. The point estimate was an increase in expected time until exit to employment of 3 percent.
4. Konczal (2014) examines the price growth and unemployment relationship from Krueger, Cramer, and Cho (2014) while we examine wage growth. The price regressions in Krueger, Cramer, and Cho (2014) are actually less significant—both in terms of levels of statistical precision and in terms of economic impact. Because of this, and because boosting wage growth is the channel through which lower unemployment could causally drive increased inflation, we focus on the Krueger, Cramer, and Cho (2014) wage and unemployment examination here.
5. Older workers, if unemployed, are more likely than younger workers to be unemployed long term. That means that the share of the unemployed who have been unemployed long term is higher for older workers. However, older workers are substantially less likely to be unemployed to begin with than younger workers. Thus the long-term unemployment rate—the share of the labor force that is unemployed long term—is slightly lower for older workers.
References
Abraham, Katharine G. 2014. “Comments on ‘Are the Long-Term Unemployed on the Margins of the Labor Market,’ by Alan Krueger, Judd Cramer, and David Cho.” Brookings Papers on Economic Activity. [forthcoming]
Ball, Laurence. 2009. “Hysteresis: Old and New Evidence,” in Jeff Fuhrer, Yolanda K. Kodrzycki, Jane Sneddon Little, and Giovanni P. Olivei (eds.), Understanding Inflation and the Implications for Monetary Policy: A Phillips Curve Retrospective. Federal Reserve Bank of Boston.
Barbosa-Filho, Nelson H., and Taylor, Lance. 2006. “Distributive and Demand Cycles in the US Economy: A Structuralist Goodwin Model.” Metroeconomica, Vol. 57, No. 3, 389–411.
Bureau of Economic Analysis (U.S. Department of Commerce) National Income and Product Accounts. Various years. National Income and Product Accounts Tables [data tables]. http://bea.gov/iTable/iTable.cfm?ReqID=9&step=1
Bureau of Labor Statistics (U.S. Department of Labor) Consumer Price Indexes program. Various years. All Urban Consumers: Chained Consumer Price Index (CPI) [database]. http://bls.gov/cpi/
Bureau of Labor Statistics (U.S. Department of Labor) Labor Productivity and Costs program. Various years. Major Sector Productivity and Costs and Industry Productivity and Costs [databases]. http://www.bls.gov/lpc/#data. (Unpublished data provided by program staff at EPI’s request).
Congressional Budget Office. The Budget and Economic Outlook. Various years. (Including The Budget and Economic Outlook: 2014 to 2024; http://www.cbo.gov/publication/45010)
Current Population Survey public data series. Various years. Aggregate data from basic monthly CPS microdata are available from the Bureau of Labor Statistics through three primary channels: as Historical ‘A’ Tables released with the BLS Employment Situation Summary (http://www.bls.gov/data/#historical-tables), through the Labor Force Statistics Including the National Unemployment Rate database (http://www.bls.gov/cps/#data), and through series reports (http://data.bls.gov/cgi-bin/srgate).
Daly, Mary, and Bart Hobijn. 2014. “Downward Nominal Wage Rigidities Bend the Phillips Curve.” Federal Reserve Bank of San Francisco Working Paper No. 2013-08. http://www.frbsf.org/economic-research/files/wp2013-08.pdf
Economic Policy Institute (EPI). 2014. “Missing Workers: The Missing Part of the Unemployment Story.” Economic Indicator, updated July 3, 2014. http://www.epi.org/publication/missing-workers/
Farber, Henry S., and Robert G. Valletta. 2013. “Do Extended Unemployment Benefits Lengthen Unemployment Spells? Evidence from Recent Cycles in the US Labor Market.” Federal Reserve Bank of San Francisco Working Paper No. 2013-09.
Federal Reserve Bank of St. Louis. Federal Reserve Economic Data (FRED) [database]. Various years. http://research.stlouisfed.org/fred2/
Ghayad, Rand. 2013. “The Jobless Trap.” Department of Economics, Northeastern University and the Federal Reserve Bank of Boston, working paper. http://media.wix.com/ugd/576e9a_f6cf3b6661e44621ad26547112f66691.pdf
Hatzius, Jan, and Sven Jari Stehn. 2014. “Slack and Inflation: Not So Fast.” U.S. Economics Analyst (Goldman Sachs), Issue No. 14/13.
Konczal, Mike. 2014. “Is Short-Term Unemployment a Better Predictor of Inflation?” Next New Deal (a blog of The Roosevelt Institute). April 8. http://www.nextnewdeal.net/rortybomb/short-term-unemployment-better-predictor-inflation
Krueger, Alan, Judd Cramer, and David Cho. 2014. “Are the Long-term Unemployed on the Margins of the Labor Market?” Brookings Papers on Economic Activity. Brookings Institution. http://www.brookings.edu/~/media/projects/bpea/spring%202014/2014a_krueger.pdf
Lazear, Edward P., and James R. Spletzer. 2012. “The United States Labor Market: Status Quo or a New Normal?” National Bureau of Economic Research Working Paper No. 18386. http://www.nber.org/papers/w18386
Mericle, David. 2014. “US Daily: Profit Margins: Too Soon to Call the Top.” Goldman Sachs Global Macro Research. Goldman Sachs. Unpublished analysis sent June 2, 2014.
Rothstein, Jesse. 2012. “The Labor Market Four Years into the Crisis: Assessing Structural Explanations.” National Bureau of Economic Research, Working Paper No. 17966. http://www.nber.org/papers/w17966
Smith, Christopher L. 2014. “The Effect of Labor Slack on Wages: Evidence from State-level Relationships.” FEDS Notes. Board of Governors of the Federal Reserve System website, June 2. http://www.federalreserve.gov/econresdata/notes/feds-notes/2014/effect-of-labor-slack-on-wages-evidence-from-state-level-relationships-20140602.html
