


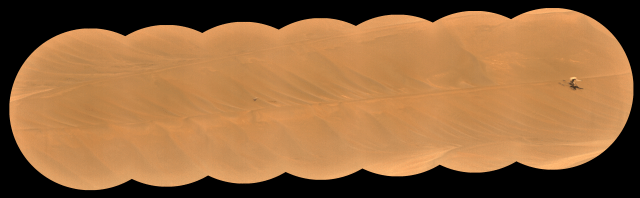


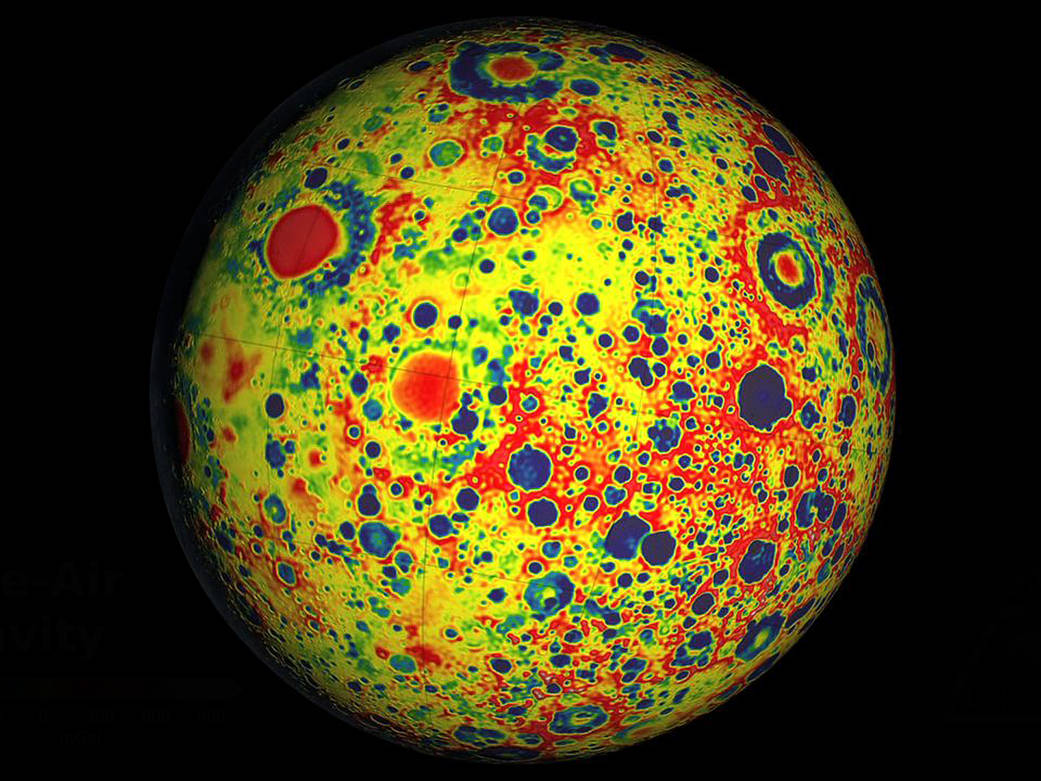
This image shows the variations in the lunar gravity field as measured by NASA’s Gravity Recovery and Interior Laboratory (GRAIL) during the primary mapping mission from March to May 2012. Very precise microwave measurements between two spacecraft, named Ebb and Flow, were used to map gravity with high precision and high spatial resolution. The field shown resolves blocks on the surface of about 12 miles (20 kilometers) and measurements are three to five orders of magnitude improved over previous data. Red corresponds to mass excesses and blue corresponds to mass deficiencies. The map shows more small-scale detail on the far side of the moon compared to the nearside because the far side has many more small craters.› See video
Image credit: NASA/JPL-Caltech/MIT/GSFC