


Abstract
Tricolored bats (Perimyotis subflavus) that roost in subterranean hibernacula have experienced precipitous declines from white-nose syndrome (WNS); however, understudied populations also use during winter non-subterranean roosts such as tree cavities, bridges, and foliage. Our objectives were to determine winter roost use by tricolored bats in an area devoid of subterranean roosts, determine roost microclimates to relate them to growth requirements of the fungal causal agent of WNS, and determine habitat factors influencing winter tree selection. From November to March 2017–2019, we used radiotelemetry to track 15 bats to their day roosts in the upper Coastal Plain of South Carolina and recorded microclimates in accessible tree cavities and bridges. We also characterized habitat and tree characteristics of 24 used trees and 153 random, available trees and used discrete choice models to determine selection. Roost structures included I-beam bridges, cavities in live trees, and foliage. Bridges were warmer and less humid than cavities. Roost temperatures often were amenable to fungal growth (< 19.5°C) but fluctuated widely depending on ambient temperatures. Bats used bridges on colder days (8.7°C ± 5.0 SD) and trees on warmer days (11.3°C ± 5.4). Bats selected low-decay trees closer to streams in areas with high canopy closure and cavity abundance. Bats also appeared to favor hardwood forests and avoid pine forests. Our results suggest that access to multiple roost microclimates might be important for tricolored bats during winter, and forest management practices that retain live trees near streams and foster cavity formation in hardwood forests likely will benefit this species. Our results also suggest tricolored bats using bridge and tree roosts might be less susceptible to WNS than bats using subterranean hibernaculum roosts. Thus, forests in areas without subterranean hibernacula in the southeastern United States that support bats during winter might represent important refugia from WNS for multiple species.
During winter, bats face a suite of challenges including disease, predation, and energetic stressors. Winter roost selection plays a critical role in mitigating these challenges and influences fitness and survival. Bats select roosts based on various ecological factors related to habitat features available across multiple spatial scales such as tree characteristics, vegetation type, or landscape configuration (Fleming et al. 2013; Jachowski et al. 2016). Roosts can be selected for lowered predation risk (Ferrara and Leberg 2005), protection from adverse weather conditions, energetic benefits (Stawski et al. 2009; Stawski and Currie 2016; Ryan et al. 2019), access to foraging sites (Carter 2006; O’Keefe et al. 2009), and to facilitate social interactions and thermoregulation (Willis and Brigham 2007; Russo et al. 2017).
The tricolored bat occurs from southeastern Canada to the Yucatan Peninsula of Mexico and west across the Great Plains into South Dakota and New Mexico (Geluso et al. 2005). During summer, tricolored bats frequently roost in tree foliage (Veilleux et al. 2003; Perry and Thill 2007; O’Keefe et al. 2009) and select trees in mature hardwood forests near riparian areas, probably related to their frequent use of riparian habitats for foraging (Ford et al. 2005; Menzel et al. 2005). During winter, tricolored bats use caves, mines, and numerous non-subterranean structures (Fujita and Kunz 1984). Relative to other species, tricolored bats tend to select warmer, more humid environments within caves (Raesly and Gates 1987; Briggler and Prather 2003). Briggler and Prather (2003) suggested that tricolored bats seek out caves that provide a wide variety of thermally stable roost sites. Winter roost structures also include bridges in Louisiana (Ferrara and Leberg 2005) and South Carolina (Newman 2020), culverts in Texas (Sandel et al. 2001; Meierhofer et al. 2019a, 2019b) and Georgia (Lutsch 2019), and tree cavities in South Carolina (Newman 2020). Most accounts in these systems are descriptive and focus on anthropogenic structures, and few studies have explored drivers of use and selection in non-cave roosts. Nonetheless, tricolored bats hibernating in Texas culverts select roosts based on microclimate (Meierhofer et al. 2019a) and potentially proximity to other roosts and suitable summer habitat (Sandel et al. 2001). Leivers et al. (2019) suggested ambient weather conditions, including humidity, might drive occupancy of culverts by tricolored bats. Nevertheless, no published information is available on microclimates of trees and bridges used by tricolored bats or what influences winter tree roost selection or shifts between winter roost structures.
Hibernating tricolored bat populations have experienced precipitous declines from white-nose syndrome (WNS), particularly in the southeastern United States; however, declines are limited so far to subterranean roosts. WNS is an invasive fungal disease that has killed millions of North America’s subterranean hibernating bats (Langwig et al. 2012; Frick et al. 2015; Powers et al. 2015) since its initial detection in 2006 (Blehert et al. 2009). Pseudogymnoascus destructans, the causal fungal agent of WNS, invades the cutaneous tissues of susceptible hibernating bats during amenable growth conditions (temperatures < 19.5°C—Verant et al. 2012). Affected bats experience a multistage disease progression with increased torpid metabolic rates and evaporative water loss resulting in more frequent arousals and premature fat depletion (Reeder et al. 2012; Warnecke et al. 2013; Verant et al. 2014; McGuire et al. 2017). Across 5 years of WNS spread (2007 – 2011), tricolored bats in subterranean roosts in the northeastern United States declined between 16% in Virginia and 95% in New York (Turner et al. 2011). In the Southeast, tricolored bat populations have declined > 91% in Georgia and South Carolina subterranean roosts (P. Pattavina, Southeast Regional White-nose Syndrome Coordinator, United States Fish and Wildlife Service, pers. comm., February 2018). The consistently high mortality rates of tricolored bats in the southeastern United States, in contrast to the wide range observed in the Northeast, might be due to the region’s relatively warm hibernacula temperatures (Sirajuddin 2018; Lutsch 2019), resulting in faster fungal growth and increased disease severity (Langwig et al. 2016). Furthermore, the strict selection of humid regions in subterranean roosts might mean tricolored bats are especially susceptible to diseases like WNS that upset water balance (McGuire et al. 2017). Nevertheless, while subterranean microclimates are ideal for P. destructans growth and WNS disease development (Langwig et al. 2012; Verant et al. 2012), other winter roost structures such as trees and bridges could have less suitable microclimates. Currently, there are no reported cases of WNS from bats hibernating in trees or bridges, and this could be related to the microclimate conditions in these thermally unstable roost structures.
Understanding the tricolored bat’s winter roost ecology in areas devoid of subterranean roosts is essential for effective conservation of this species, especially if WNS susceptibility varies based on winter structure use and microclimate. Our objectives were to determine: 1) the types of winter roosts used by tricolored bats in an area devoid of caves or mines; 2) roost microclimates and relate them to P. destructans growth conditions; 3) whether ambient weather conditions (temperature and humidity) influenced the use of different types of roosts; and 4) tree and habitat characteristics influencing tree roost selection. We hypothesized that roost microclimates would be influenced by ambient temperature and humidity conditions (Coombs et al. 2010; Clement and Castleberry 2013) and differ between bridges and tree cavities. We predicted that roost temperature and humidity would be positively related to ambient temperature and humidity conditions. Because of concrete’s high thermal mass and the open design of the bridges, we predicted that on average, bridges would be warmer and less humid than cavities. We also hypothesized that use of bridges and trees would depend on ambient weather conditions and that bats would shift among structures throughout winter to balance energetic costs and benefits related to roost microclimates (Boyles et al. 2007, 2017; Ryan et al. 2019). Specifically, we predicted that bats would use the more thermally buffered tree cavities on the coldest days, less thermally buffered bridges on days with intermediate temperatures, and foliage on the warmest days. We also predicted that bats would limit use of bridges and foliage on days with low humidity and increase use of cavities. Finally, we hypothesized that microhabitat characteristics influencing tree roost microclimate would be important for tricolored bats because winter imposes many energetic constraints (Coombs et al. 2010; Clement and Castleberry 2013). We predicted that bats would select live, large diameter trees for increased thermal buffering and reduced freezing risks, and trees with high canopy closure resulting in low roost temperatures that are conducive for torpor.
Materials and Methods
Study area.
—We carried out our study in two winters from November through March 2017 – 2018 and 2018 – 2019 on the Department of Energy’s Savannah River Site (SRS) located in the Upper Coastal Plain of South Carolina. SRS is an 80,267 ha National Environmental Research Park ideal for studying non-subterranean hibernating tricolored bats because it is devoid of caves, mines, and other subterranean hibernacula. The United States Department of Agriculture (USDA) Forest Service manages the natural resources of SRS (Blake et al. 2005). Dominant vegetation types on SRS were loblolly pine (Pinus taeda), longleaf pine (Pi. palustris), and bottomland hardwood (e.g., Nyssa spp., Quercus spp.) forests (Imm and McLeod 2005). We focused our research efforts around three previously identified concrete I-beam bridges (Loeb and Zarnoch 2011). Tricolored bats frequently hung from the ribbed metal decking under these bridges that provided easy walk-in access to hand-capture bats. The habitat surrounding the study bridges was a mix of mature and regenerating bottomland hardwood, upland hardwood, mixed pine-hardwood, pine forests, and industrial facilities and waste remediation sites (large grass-covered clearings).
Bat capture and skin temperature monitoring.
—We visually inspected the three study bridges for tricolored bats during daylight hours and hand-captured available bats from the bridge ceiling. For each captured bat, we determined sex, reproductive condition, wing condition (Reichard and Kunz 2009), and measured body mass and forearm length. Prior to transmitter attachment, we banded each bat with a 2.4-mm aluminum-lipped band (Porzana Ltd., East Sussex, United Kingdom). We trimmed hair between bats’ scapulae and affixed a 0.42 g LB-2XT temperature-sensitive transmitter (Holohil Systems Ltd., Ontario, Canada) using surgical glue (Perma-Type Company, Inc., Plainville, Connecticut). After a minimum 15-min holding period to ensure transmitter attachment, we placed bats back in their original roosting location. We followed the United States Fish and Wildlife Service Decontamination Protocol when handling bats or visiting bridge roosts. All research methods were undertaken in accordance with the guidelines of the American Society of Mammalogists for the use of wild animals (Sikes et al. 2016) and were approved by the Clemson University IACUC (#2017-057) and USDA Forest Service IACUC (#2017-017).
After tracking bats to their roosts, we recorded skin temperatures (Tsk) of bats in their roosts at 15-min intervals during a 20-s scan period for active transmitter frequencies using SRX-800D dataloggers (Lotek Engineering Inc., Ontario, Canada) paired with a three- or five-element Yagi antenna. Dataloggers were maintained at bridges for the duration of the field season and at tree roosts for the duration of the bat’s transmitter life. We changed the external 12 V battery powering each datalogger every 2 – 3 days or 3 – 4 days depending on battery size. We manually checked Tsk records for potentially inaccurate recordings (e.g., Tsk < 0°C or > 40°C) that were a result of low transmitter battery or poor signal strength. We classified Tsk into four thermoregulatory phases: warming, cooling, torpid, and normothermic. We defined warming and cooling phases based on abrupt increases and decreases in Tsk (> 5°C in ≤ 30 min). We then defined periods of stable Tsk between warming and cooling phases as either torpid or normothermic phases (Jonasson and Willis 2012).
Roost microclimates.
—We recorded roost temperature (Tr) and relative humidity (RHr) every 30 min using Hygrochron iButtons (Maxim Integrated, San Jose, California). We collected Tr and RHr from the study bridges during both winters, Tr in accessible cavities (cavities with basal or mid-bole openings and an entrance width > 8 cm) during both winters, and roost RHr in accessible cavities only during the second winter. Foliage roosts were not conducive for iButton placement, and we were unable to measure Tr or RHr in these structures in either winter. We acquired ambient temperature (Ta) and relative humidity (RHa) from an onsite climatology station through the Atmospheric Technologies Group of the Savannah River National Laboratory. Climatology measurements of Ta and RHa were comparable with measurements of Ta and RHa collected using iButtons in forest habitat near used trees (Newman 2020).
We defined Tr below the maximal P. destructans growth threshold of 19.5°C (Verant et al. 2012) as amenable to fungal growth and infection (i.e., the P. destructans zone). We also used vapor pressure deficit (VPD) following the guidance of Kurta (2014). VPD provides an absolute measurement of moisture and thus is more suitable for comparisons across variable temperatures and multiple roosts than relative humidity. We calculated VPD using simultaneous measurements of temperature (Ta or Tr) and relative humidity (RHa or RHr) and the following equation: VPD (kilopascal [kPa]) = [(100 − RH)/100] SVP (Monteith and Unsworth 1990), where SVP (kPa) = [610.7*107.5T/(237.3+T)]/1,000 (Murray 1967).
We achieved a near-continuous record of Tr and roost VPD (VPDr) under the bridges. In contrast, the accessible cavities mostly were monitored during use. The differences in these two sampling methods created an uneven number of observation days resulting in longer records from bridges than from cavities. Cavity records also frequently represented only a small window of time at various stages throughout winter. To address the first issue, we used bridge records only from days for which we also had a corresponding cavity measurement. For the second issue, we standardized measurements of mean daily Tr and VPDr by subtracting the corresponding mean ambient weather condition. The standardization created an adjusted daily mean Tr and VPDr representing the daily difference between roost and ambient weather conditions.
Our three roost structure categories were bridges, tree cavities, and foliage. Of the tree structures, cavities are thermally buffered from changes in Ta (Coombs et al. 2010), while foliage roosts are not thermally buffered. When we could not visually verify whether a bat was in a hidden cavity or in the foliage, we inferred the roost structure used based on Tsk fluctuations. For example, Tr in a cavity increases an hour or more after a corresponding increase in Ta as a result of thermal buffering. Because a bat can only be as cold as its roost, torpid Tsk that increase simultaneously with Ta are likely from bats in foliage or similarly thermally unbuffered structures. In contrast, those with a delayed increase in torpid Tsk following an increase in Ta are likely from bats in cavity roosts. We used this method of inference on visually confirmed cavity and foliage roosts as a test of its efficacy, and successfully classified 100% of these verified structures (n = 15) using Tsk fluctuations.
We tested bridges and cavities separately to determine whether hourly roost microclimate measurements were related to ambient temperature and humidity conditions using linear mixed effect regressions with a random effect of roost. To determine if Tr differed between bridges and tree cavities, we used a two-way analysis of variance (ANOVA) to analyze the effect of roost structure (bridge or cavity) and winter (2017–2018 or 2018–2019) on adjusted daily mean Tr. We also used a one-way ANOVA to analyze the effect of roost structure on adjusted daily mean VPDr. Both ANOVAs also included a random effect of roost to account for repeated measures. To test our hypothesis that roost use depended on ambient weather conditions, we used a one-way ANOVA to analyze differences in Ta and ambient VPD (VPDa) on days that bats used roost structures with a random effect of individual to account for repeated measures. For post-hoc analyses of ANOVA results, we used Tukey’s Honest Significant Difference to compare group levels of significance at a 95% confidence level. All statistical analyses were performed in R version 3.5.2 (R Core Team 2019), and values are reported as the mean ± SD.
Tracking and tree roost selection.
—We attempted to locate each bat’s day roost every successive day following transmitter attachment using a three-element Yagi antenna and a TR5 (Telonics, Inc., Mesa, Arizona) or R1000 (Communication Specialist, Inc., Orange, California) receiver. We tracked bats for the duration of their transmitter life or until they were undetectable for > 7 days. We located roosts by homing in on the signal, and when we were within 20 m of the general location, we triangulated around the point until we identified an exact location. If we could not confirm the bat’s location through visual sightings or emergence surveys, we used the suspected tree as the bat’s location and noted the bat’s assumed position (e.g., canopy or trunk). We marked roost trees with a numbered aluminum tag and recorded the coordinate location using a Geo7X GPS (Trimble Navigation, Ltd., Sunnyvale, California). To minimize disturbance, the only tree characteristics collected while a bat was present were canopy closure, roost structure type, and tree species. Hemispherical photos for canopy closure estimates were taken 1.5 m from the base of the tree using a Coolpix digital camera (Nikon, Inc.) mounted with a fisheye lens and placed on a 1.5-m pole to stabilize shots and limit the amount of ground cover within the photo-capture area. At each location, we took three photos maintaining the same camera position but with varying exposure settings (–1, 0, and +1). We converted canopy photos to binary images using ImageJ v. 1.52 software (United States National Institutes of Health, Bethesda, Maryland) and selected the best photo exposure based on pixel conversion. We then used the macro “Hemispherical_2.0” to calculate the gap fraction and subtracted this value from 100% to estimate canopy closure.
After a bat switched roosts or a minimum of 10 days had passed, we returned to record diameter at breast height (DBH), tree height, cavity entrance width, cavity entrance height, number of potential roost structures on the tree, number of entrances into a cavity, decay status, and distance to the nearest tree of equal or greater height. Decay status was assigned using a system modified from Boyles and Robbins (2006) to fit our study system with a scale of 1 – 4 as follows: 1) live, > 75% of bark and canopy intact with the only obvious signs of decay being cavity formation; 2) declining live, 50 – 75% of bark and canopy intact with some obvious signs of decay including large dead or broken limbs; 3) severely declining live or dead, 25 – 50% of bark and canopy intact with multiple dead or broken limbs; and 4) dead, < 25% of bark and canopy intact with extensive external and internal decay leaving mainly the trunk remaining. In a 0.1-ha plot centered on the roost tree, we recorded DBH and tree species of all trees > 10 cm in DBH and the number of trees with cavities (i.e., plot cavity abundance). We used these data to count the number of small trees (< 16 cm DBH) and large trees (≥ 25 cm DBH) in each plot.
Because we used discrete choice modeling, we established a choice set of used and available trees for selection analysis. The number of choice sets was determined by the number of roosting events, which we defined as the selection of a day roost following a period of normothermia by the individual. For example, if a torpid bat became normothermic but remained in its initial roost before reentering torpor, we considered this an additional roosting event at the selected tree. Duration of time elapsed between repeated roosting events varied from 1 to 15 days. We limited the number of roosting events per tree for each bat to three due to time and sampling constraints. For each roosting event, we buffered the used tree by 1.2 km and generated three random points within the buffer area to survey for available trees within the choice set. Due to limited knowledge of winter travel distances for tricolored bats, the buffer was based on the maximum known distance traveled between two trees in a single night by a female tricolored bat that we tracked in 2017 – 2018. We defined a tree to be available at our random locations if it possessed at least one of the following characteristics: 1) one or more cavity structures with an entrance width > 5 cm, 2) a decay status ≥ 2, and 3) total of > 1 m2 of dried foliage clumps. If we did not find a suitable tree within 100 m of a random point, we generated another random point for survey. We collected the same tree and plot characteristics at random trees as used trees.
We accessed data on stand structure and vegetation type for SRS from the vegetation database within the Natural Resources Information System framework (USDA Forest Service 2018). We used a geographic information system (ArcGIS 10.5.1 Environmental Systems Research Institute, Redlands, California) with the vegetation data and digital imagery to determine stand vegetation types and calculate distance to linear openings (e.g., roads, powerlines, and railroads), distance to nonlinear openings (e.g., stands < 5 years in age, wildlife openings, and maintained clearings such as waste remediation sites), and distance to perennial streams for used and random tree locations. We reclassified the 13 vegetation types present within our study area into four broad vegetation types: bottomland hardwood forest, upland hardwood forest, mixed mesophytic pine-hardwood forest, and pine forest (Supplementary Data SD1).
We developed nine a priori hypotheses to evaluate winter tree roost selection, including the global model and three subglobal models, based on roost availability, roost microclimate, foraging commute, ease of discovery, and general habitat (Table 1). Given our uneven sex ratio and small sample size, we did not analyze our data for potential sex-specific trends in winter roost use and selection. We tested for collinearity among our predictor variables using a Pearson’s correlation coefficient of |0.35|. Only the global model contained variables that were highly correlated (cavity abundance was correlated with large tree density and distance to linear opening); we therefore removed plot cavity abundance from the global model to retain the greatest number of predictors. We modeled tree roost selection with discrete choice models. The observational units were the choice sets (one used tree and three random available trees). We fit our discrete choice models using the package mlogit (Croissant 2013). This package is commonly used for discrete choice analysis and accounts for data obtained from multiple individuals. We ranked competing models using Akaike’s Information Criterion with correction for small sample sizes (AICc) and selected the most parsimonious model. We determined the significance of model parameter estimates based on whether their upper and lower 95% CI overlapped 0. To assess the performance of our top model, we used 10-fold cross validation (Boyce et al. 2002). We randomly selected 80% of our data to function as training data (with 1:3 choice sets remaining intact) and allocated the remaining 20% of data as test sets for the newly trained model. We repeated this procedure nine times and used the trained model with our test sets to estimate the relative probability of selection of each used or available point in our choice sets. If the proportion of used sites correctly predicted from our pooled test sets was greater than 0.5, we deemed our model a better fit than would be expected at random.
Variables and predictions for models predicting winter tree roost selection for tricolored bats (Perimyotis subflavus) in the Upper Coastal Plain of South Carolina, November–March 2017–2019. DBH = diameter at breast height; ED = ease of discovery; FC = foraging commute; RA = roost availability; RM = roost microclimate.
| Model | Predictor variable | Prediction |
|---|---|---|
| RM | Decay | – |
| DBH | + | |
| Canopy closure | + | |
| RA | Cavity abundance | + |
| Stand vegetation type | Bottomland hardwood | |
| Stream distance | – | |
| ED | Tree height | + |
| Distance to tree of equal or greater height (m) | + | |
| Canopy closure | – | |
| Small tree density | – | |
| FC | Linear opening distance | – |
| Nonlinear opening distance | – | |
| Stream distance | – | |
| General habitat | Small tree density | – |
| Large tree density | + | |
| Tree species | Nyssa spp. and Quercus spp. | |
| Stand vegetation type | Bottomland hardwood | |
| FC_ED | Foraging commute Ease of discovery | See models above |
| FC_RM | Foraging commute Roost microclimate | See models above |
| RM_RA | Roost microclimate Roost availability | See models above |
| Global | All the above excluding cavity abundance due to multicollinearity |
Results
Roost use.
—We captured and radiotagged 19 tricolored bats and tracked 15 bats for an average of 28 ± 10 days (eight in 2017 – 2018 and seven in 2018 – 2019; four females and 11 males). We had one recapture in both years: a female in 2017 – 2018 that was originally banded in 2016 – 2017 during a pilot study (data not incorporated), and a male in 2018 – 2019 that was recaptured following initial capture in 2017 – 2018. Tricolored bats in bridges frequently hung from 5-cm lips created by the overlapping ribbed metal decking on the bridge ceiling or against the concrete I-beam itself. Bats usually roosted alone although we occasionally observed small clusters of 2 – 3 individuals in bridges.
We identified 18 tree roosts from November to March 2017 – 2018, and another six tree roosts from November to February 2018 – 2019. Bats used between 0 – 4 tree roosts while being tracked. Mean residence time was 8 ± 11 days (median = 3 days) in trees and 9 ± 8 days (median = 5 days) in bridges. The two longest residence times, 39 and 38 days, were by female bats in cavities with basal openings and occurred from mid-January to mid-February 2017 – 2018 and 2018 – 2019. The longest residence time in a bridge was 27 days by a male bat from early December to January 2017 – 2018. Tricolored bats often returned to previously used bridges throughout winter and occasionally returned to a previously used tree after roosting in a bridge.
The most frequently used tree species were sweetgum (Liquidambar styraciflua; n = 7) and oaks (Quercus spp.; n = 6), including two roosts in swamp chestnut oaks, Q. michauxii. Bats also used tupelo (Nyssa spp.; n = 3), yellow poplar (also known as tulip tree; Liriodendron tulipifera; n = 3), sweetbay (Magnolia virginiana; n = 2), loblolly pine (Pi. taeda; n = 1), red maple (Acer rubrum; n = 1), and American holly (Ilex opaca; n = 1). Tree roost structures were in cavities with basal openings (n = 5), cavities with upper and mid-bole openings (n = 6), a hollow snag with a chimney and mid-bole opening (n = 1), Spanish moss (Tillandsia usneoides; n = 2), a cluster of dried sweetgum leaves in an American holly (n = 1), and various unknown roost structures (n = 9) such as potentially hidden cavities, dead limbs, bark, or foliage.
Roost microclimates.
—The daily mean Ta in November–March was 10.7 ± 6.1°C in 2017 – 2018 and 10.5 ± 4.8°C in 2018 – 2019. The coldest daily mean Ta observed in 2017 – 2018 (–4.5°C) was lower than the coldest daily mean in 2018 – 2019 (1.2°C). Conditions were marginally more humid in 2018 – 2019 (0.31 ± 0.19 kPa) than in 2017 – 2018 (0.47 ± 0.23 kPa) with a maximum daily mean VPDa of 1.19 kPa. Daily mean Tr was 12.9 ± 4.9°C in bridges and 11 ± 4.6°C in accessible cavities, while the daily mean VPDr was 0.42 ± 0.32 kPa in bridges and 0.04 ± 0.06 kPa in accessible cavities. Daily mean Tr fluctuation was 4.8 ± 2.0°C in bridges and 4.0 ± 1.9°C in accessible cavities with maxima of 13.8°C and 10.5°C, respectively. The proportion of time Tr fell within the P. destructans zone was 0.88 ± 0.04 for bridges and 0.96 ± 0.04 for cavities. While within the P. destructans zone, the proportion of time roost temperatures fell within the optimal growth range (12.5 – 15.8°C) was 0.28 ± 0.02 for bridges and 0.20 ± 0.07 for cavities. The proportion of time while within the P. destructans zone that Tr were > 15.8°C was 0.22 ± 0.01 for bridges and 0.16 ± 0.13 for cavities.
Ta was positively related to Tr in bridges (F1,15054 = 25043, P < 0.001, R2 = 0.62) and cavities (F1,8119 = 12340, P < 0.001, R2 = 0.66). VPDa was positively related to VPDr in bridges (F1,14816 = 6716, P < 0.001, R2 = 0.32). We did not test if cavity VPDr was influenced by VPDa because these measurements showed little daily fluctuation (0.04 ± 0.06 kPa). We found an interaction between roost structure and year on adjusted daily mean Tr (F1,294 = 36.26, P < 0.001). Post-hoc analyses showed higher adjusted daily mean Tr in bridges than cavities in 2017 – 2018 (P < 0.001) and 2018 – 2019 (P = 0.012), higher adjusted daily mean Tr in 2018 – 2019 than 2017 – 2018 within cavity roosts (P < 0.001), and no difference between years within bridge roosts (P = 0.076; Fig. 1A). There was also an effect of roost structure on VPDr, with higher adjusted daily mean VPDr in bridges than cavities (F1,5 = 36.26, P = 0.003; Fig. 1B).
![— A) Adjusted daily mean temperature (°C) and B) vapor pressure deficit (VPD [kPa]) of bridge and cavity roosts of tricolored bats (Perimyotis subflavus) in the Upper Coastal Plain of South Carolina, November – March 2017 – 2019. VPD measurements were limited to 1 year of observation, November – March 2018 – 2019. We standardized measurement of roost conditions by subtracting the corresponding ambient weather conditions to create an adjusted daily mean representing the difference of roost and ambient conditions. The horizontal line in the middle of the box represents the median, the box’s notch displays the 95% CI for the median value, the box itself encompasses the 25 – 75th percentiles, and the whiskers extend to points within 1.5 times the interquartile range. All pairwise comparisons differed significantly (alpha = 0.05) except for the comparison between years in bridge roosts.](https://oup.silverchair-cdn.com/oup/backfile/Content_public/Journal/jmammal/102/5/10.1093_jmammal_gyab080/1/m_gyab080f0001.jpeg?Expires=1716334707&Signature=ucqpMxOPRRO-CAWvziQndrXfVKZ8zBCqVzcEqstspWhPI9HVUIC6eewYkYW24ClnDkPZT~hy7H7ABha-hDzE~jAqJyHWYFn5sVk6pwt4y6kIv-RHJVA8gtkDlwb5I6~3i2CumZQYhPDZcONLBLXNuBCUSywfQIFGeoTARk6O-rz81KAiANJ~9MW-WHQV9ElkEjCORz3xtg4nswLIlopOgCWfAYmhfArtZSjg582QlmYkazmEyTSieWvqwlSljM4rADaPPQhM2en6citCtbbkb9t5m6q3fcKEVlz26JQtzWPUtLDCqSLbR7v-XO2DsEBGm27Knz9KNtRgAE-IsYuMug__&Key-Pair-Id=APKAIE5G5CRDK6RD3PGA)
— A) Adjusted daily mean temperature (°C) and B) vapor pressure deficit (VPD [kPa]) of bridge and cavity roosts of tricolored bats (Perimyotis subflavus) in the Upper Coastal Plain of South Carolina, November – March 2017 – 2019. VPD measurements were limited to 1 year of observation, November – March 2018 – 2019. We standardized measurement of roost conditions by subtracting the corresponding ambient weather conditions to create an adjusted daily mean representing the difference of roost and ambient conditions. The horizontal line in the middle of the box represents the median, the box’s notch displays the 95% CI for the median value, the box itself encompasses the 25 – 75th percentiles, and the whiskers extend to points within 1.5 times the interquartile range. All pairwise comparisons differed significantly (alpha = 0.05) except for the comparison between years in bridge roosts.
Daily mean Ta on days that bats used bridges, cavities, and foliage differed (F2,48 = 10.28, P < 0.001; Fig. 2A), but daily mean VPDa did not (F2,241 = 2.27, P = 0.11; Fig. 2B). Mean Ta on days bats used bridges differed from days bats used cavities (P = 0.03) and foliage (P < 0.001), while mean Ta on the days bats used the two tree structures did not differ (P = 0.27). Bats used bridges on colder days (8.7°C ± 5.0) and trees on warmer days (11.3°C ± 5.4).
![—A) Ambient temperature (°C) and B) vapor pressure deficit (VPD [kPa]) during structure use by tricolored bats (Perimyotis subflavus) in the Upper Coastal Plain of South Carolina, November–March 2017 – 2019. The horizontal line in the middle of the box represents the median, the box’s notch displays the 95% CI for the median value, the box itself encompasses the 25 – 75th percentiles, and the whiskers extend to points within 1.5 times the interquartile range. Only mean ambient temperature on days bats used bridges differed significantly (alpha = 0.05) from days bats used cavities and foliage.](https://oup.silverchair-cdn.com/oup/backfile/Content_public/Journal/jmammal/102/5/10.1093_jmammal_gyab080/1/m_gyab080f0002.jpeg?Expires=1716334707&Signature=oyw5LZQ~j4WwRp9PXnyQZRlORU3vAEGLqs7590Uj985~ebGkqMaOJUYesBHFjEVLtCAsGeqbWn9yFmwDjtwsTVOh5CVQkM2EEEeSH0x0TgnhMzzS6Oq4zIig2OLEyKTdPNgJxdHeUuhd3zcNnV3fpGwOkEovZF~QRCsPFZkpK2nRl6QKgQO6HLRPdETPfiTxz2trTfmLnmsVFtTbwihTtoZnk9THcPYQMgbsa-UVb7zZmHMCU2dZ5NnWxht6KyueO8Nv8oSizEoPNvsoTeaf7g5Z0aEenbWrXlD2CcMNhQtoQoAYEwDqm3jrLP8eOUjca-q4oIuEEoQNPUoWRfRqpw__&Key-Pair-Id=APKAIE5G5CRDK6RD3PGA)
—A) Ambient temperature (°C) and B) vapor pressure deficit (VPD [kPa]) during structure use by tricolored bats (Perimyotis subflavus) in the Upper Coastal Plain of South Carolina, November–March 2017 – 2019. The horizontal line in the middle of the box represents the median, the box’s notch displays the 95% CI for the median value, the box itself encompasses the 25 – 75th percentiles, and the whiskers extend to points within 1.5 times the interquartile range. Only mean ambient temperature on days bats used bridges differed significantly (alpha = 0.05) from days bats used cavities and foliage.
Tree roost selection.
—We modeled tree roost selection from 51 choice sets comprised of habitat characteristics of 24 used trees and 153 random available trees (Table 2). The subglobal model containing predictors related to roost microclimate and availability was the top model for predicting tree roost selection, carrying 100% of the model weight (Table 3). Canopy closure, cavity abundance, stream distance, and decay status were significant predictors (Table 4). Relative probability of a bat selecting a tree was negatively related to stream distance (Fig. 3A) and decay status and positively related to canopy closure (Fig. 3B) and plot cavity abundance (Fig. 3C). Based on the 10-fold cross validation, our top model accurately predicted winter tree roost selection for tricolored bats 82% of the time.
Mean and SDs of predictor variables measured at tricolored bat (Perimyotis subflavus) winter roost trees and available trees in the Upper Coastal Plain of South Carolina, November – March 2017 – 2019.
| Used trees (n = 24) | Available trees (n = 153) | |||
|---|---|---|---|---|
| Variable | Mean | SD | Mean | SD |
| Cavity abundance within 0.1-ha plot | 8.1 | 2.5 | 3.8 | 2.8 |
| Diameter at breast height (cm) | 51.4 | 20.6 | 43.6 | 16.4 |
| Distance to tree of equal or greater height (m) | 4.1 | 2.4 | 4.3 | 3.3 |
| Linear opening distance (m) | 152.6 | 148.8 | 142.8 | 147.9 |
| Nonlinear opening distance (m) | 424.9 | 290.6 | 440.4 | 415.1 |
| Number large trees within 0.1-ha plot | 23.1 | 5.6 | 18.3 | 8.6 |
| Number small trees within 0.1-ha plot | 18.9 | 8.4 | 18.6 | 13.1 |
| Stream distance (m) | 86.4 | 73.5 | 197.6 | 148.8 |
| Tree height (m) | 24.0 | 9.3 | 20.5 | 9.0 |
| % canopy closure | 78.2 | 7.4 | 74.6 | 12.4 |
| % live | 45.8 | 10.2 | 28.8 | 3.7 |
| % live declining | 41.7 | 10.1 | 27.5 | 3.6 |
| % severely declining | 4.2 | 4.1 | 17.6 | 3.1 |
| % dead | 8.3 | 5.6 | 26.1 | 3.6 |
| % bottomland hardwood forest | 62.5 | 9.9 | 41.2 | 4.0 |
| % upland hardwood forest | 12.5 | 6.8 | 7.8 | 2.2 |
| % pine forest | 12.5 | 6.8 | 34.6 | 3.8 |
| % mixed pine-hardwood forest | 12.5 | 6.8 | 16.3 | 3.0 |
Winter tree roost selection models for tricolored bats (Perimyotis subflavus) in the Upper Coastal Plain of South Carolina, November – March 2017 – 2019. Model refers to the hypothesis evaluated (Table 1). AICc = Akaike’s information criterion adjusted for small sample size; ΔAICc = difference of AICc between a model and the model with the smallest AICc; ED = ease of discovery; FC = foraging commute; K = number of parameters; LogLik = log-likelihood; RA = roost availability; RM = roost microclimate; weight = model weights.
| Model | K | LogLik | ∆AICc | Weight |
|---|---|---|---|---|
| RM_RA | 10 | –9.2 | 0.0 | 1.0 |
| RA | 5 | –22.3 | 12.0 | 0.0 |
| FC_RM | 8 | –38.6 | 52.8 | 0.0 |
| FC | 3 | –48.6 | 59.8 | 0.0 |
| FC_ED | 7 | –43.9 | 60.5 | 0.0 |
| Global | 18 | –26.8 | 67.2 | 0.0 |
| RM | 5 | –52.9 | 73.4 | 0.0 |
| General habitat | 8 | –50.8 | 77.3 | 0.0 |
| ED | 4 | –65.3 | 95.6 | 0.0 |
Coefficient estimates from the top model, roost microclimate–roost availability, predicting tree roost selection of tricolored bats (Perimyotis subflavus) in the Upper Coastal Plain of South Carolina, November – March 2017 – 2019. Reference category for decay status was live trees and for stand vegetation type was bottomland hardwood forest. See Fig. 3 for predicted relationships of the relative probability of selection based on significant continuous covariates (i.e, 95% CI not overlapping 0; lower confidence limit [LCL 95%] and upper confidence limit [UCL 95%]).
| Covariate | Estimate | SE | LCL 95% | UCL 95% |
|---|---|---|---|---|
| Canopy closure | 5.1 | 2.4 | 0.4 | 9.9 |
| Cavity abundance | 6.0 | 2.6 | 0.9 | 11.2 |
| Diameter at breast height | –0.8 | 0.7 | –2.2 | 0.7 |
| Stream distance | –7.0 | 3.0 | –12.8 | –1.1 |
| Decay: declining live | 0.7 | 1.2 | –1.6 | 3.0 |
| Decay: severely declining | –13.0 | 6.3 | –25.4 | –0.5 |
| Decay: dead | –2.0 | 2.3 | –6.5 | 2.5 |
| Stand: upland hardwood forest | –1.0 | 1.8 | –4.7 | 2.6 |
| Stand: pine forest | –9.7 | 5.2 | –19.9 | 0.5 |
| Stand: mixed pine-hardwood forest | –4.2 | 12.8 | –29.3 | 20.9 |
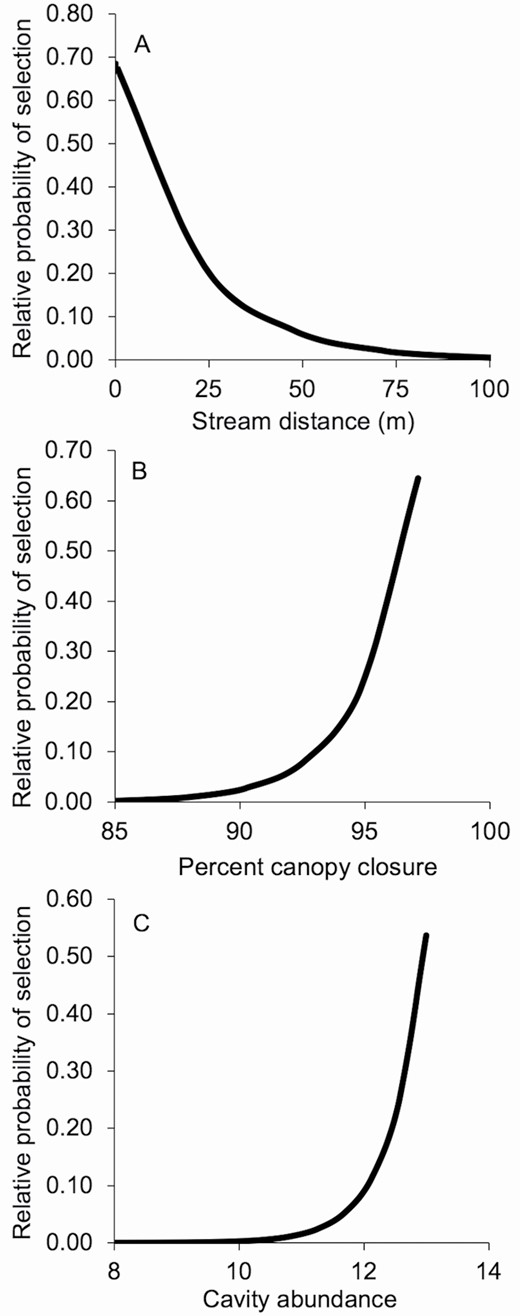
—A) Relative probability of selection for stream distance, B) percent canopy closure, and C) plot cavity abundance by tricolored bats (Perimyotis subflavus) in the Upper Coastal Plain of South Carolina during winter, November – March 2017 – 2019. Relative probability of selecting resource X is a function of used and available attributes within our choice sets.
Discussion
Use of roosts with thermally unstable microclimates by tricolored bats has important conservation implications for WNS. Bridge and cavity Tr were amenable to P. destructans growth (< 19.5°C) throughout most of the winter and were within the optimal growth range of P. destructans (12.5–15.8°C) about 25% of the time. Extended periods within the optimal growth range of P. destructans could contribute to increased fungal loads on torpid bats and disease severity (Langwig et al. 2016); however, Tr in bridges and cavities varied with ambient temperatures and among roost structures. Because P. destructans growth is temperature dependent (Verant et al. 2012) and fungal load is linked to disease severity (Langwig et al. 2016), tricolored bats at SRS could experience varying degrees of P. destructans load and WNS severity based on winter temperatures if infected. For example, although Tr sometimes was within the optimal growth range of P. destructans, we also frequently observed Tr > 15.8°C that could ultimately limit the growth and reproductive capacity of P. destructans (Verant et al. 2012). Therefore, tricolored bats at SRS using thermally unstable roosts might be less susceptible to WNS than subterranean hibernating populations.
Contrary to our prediction, tricolored bats did not use roost structures based on ambient humidity. Evaporative water loss in torpid bats increases at low humidity, and bats must arouse more frequently and consequently expend more energy to offset dehydration (Thomas and Cloutier 1992). Tricolored bats generally are considered sensitive to evaporative water loss because they select the most humid regions in caves (Ploskey and Sealander 1979; Raesly and Gates 1987). Some bat species exhibit intraspecific variation in evaporative water loss. Big brown bats (Eptesicus fuscus) hibernating in arid microclimates have lower evaporative water loss during dry conditions than bats accustomed to hibernating in humid microclimates (Klüg-Baerwald and Brigham 2017). Our results suggest intraspecific variation also might occur in tricolored bats, where individuals using trees and bridges might either be less energetically constrained and able to tolerate more frequent arousals or less sensitive to evaporative water loss than subterranean populations. Lower sensitivity to evaporative water loss might alter host–pathogen dynamics and WNS-related disease effects. Our results highlight the need to explore physiological responses to environmental conditions across the entire suite of a species’ habitat uses and range (Dunbar and Brigham 2010).
Tricolored bats at SRS used bridges on cooler days and trees on warmer days. Short-term shift in structure use in response to Ta during winter appears to be a common strategy among tree roosting bats. Eastern red bats (Lasiurus borealis) and Seminole bats (L. seminolus) roost in foliage during warm winter periods but shift to leaf litter during colder periods (Mormann and Robbins 2007; Hein et al. 2008). Because cavities were consistently colder than bridges, and foliage provides poor insulation, trees might pose a greater freezing risk than bridges for tricolored bats during cold periods. Bridges likely were warmer than cavities during cold periods as a result of solar radiation and concrete’s high thermal mass. Therefore, bridges could provide predictable microclimates for tricolored bats at SRS to use during periods of increased freezing risk, despite daily Tr fluctuations.
As we predicted, tricolored bats selected trees based on decay status and canopy closure, which could correspond to thermal properties of the roost. Tricolored bats at SRS selected live trees with minimal decay and closed canopy structures. Cavities in live trees buffer Ta better and thus respond more slowly to changes in Ta than dead trees, resulting in increased thermal stability (Sedgeley 2001; Coombs et al. 2010). A closed canopy also reduces the amount of solar radiation and contributes to a cooler microclimate in cavity and foliage roosts. Colder temperatures allow for lower metabolic rates during torpor that reduces energy expenditure (Geiser 2004). Therefore, relatively cool and stable microclimates of live trees with a closed canopy could be important for winter torpor in tricolored bats.
Selection of trees in areas with high cavity abundance might be related to access to multiple microclimates. No single microclimate provides optimal roosting conditions for the entire winter period (Boyles et al. 2017). Cave hibernating bats shift locations within hibernacula based on microclimate throughout winter as needed (Boyles et al. 2007, 2017; Ryan et al. 2019). Other tree roosting bats also vary their microclimate use in response to fat reserves and weather (Stawski et al. 2009; Stawski and Currie 2016). Tricolored bats at SRS might prefer access to a wide range of microclimates that they can use depending on energetic needs associated with ambient weather conditions and food availability.
Our results suggest landscape-scale features also were important for tree roost selection by tricolored bats during winter. Tricolored bats at SRS selected trees closer to streams and appeared to avoid pine forests based on availability, favoring hardwood forests (Table 2). Although the 95% CI of stand vegetation type overlapped zero, we think stand type could be ecologically important. Previous studies of summer roost selection by tricolored bats only reported conifer use if there was ample vegetation to provide concealment (Perry and Thill 2007; O’Keefe et al. 2009), and tricolored bats at SRS exclusively used foliage in pine forests. Selection of hardwood forests and trees near streams could be related to foraging and drinking resources and roost suitability. During summer, tricolored bats favor riparian habitats for foraging (Ford et al. 2005; Menzel et al. 2005). Sandel et al. (2001) suggested tricolored bats in Texas select culverts during winter based on their proximity to other roosts and suitable summer habitat. At SRS, the increase in relative selection probability per unit increase in cavity abundance was lower in pine forests and mixed pine-hardwood forests than in bottomland hardwood forests and upland hardwood forests (Fig. 4). Tricolored bats at SRS might continue to use hardwood forests near streams because of their proximity to suitable summer habitat. Alternatively, tricolored bats at SRS might return to summer roosting and foraging habitats during winter only if Ta are suitably mild (> 10°C) for winter foraging opportunities.
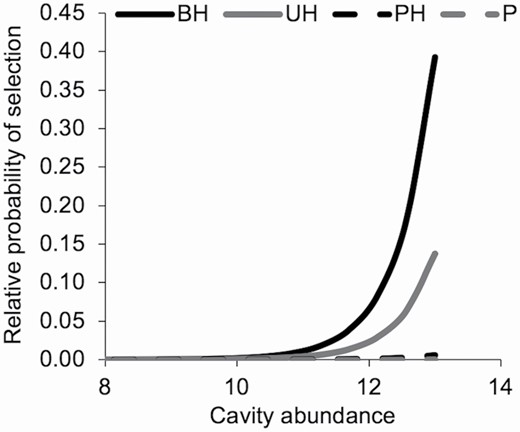
—Relative probability of selection for plot cavity abundance within stand vegetation types by tricolored bats (Perimyotis subflavus) in the Upper Coastal Plain of South Carolina during winter, November – March 2017 – 2019. Stand vegetation type from left to right: bottomland hardwood forest (BH), upland hardwood forest (UH), mixed mesophytic pine-hardwood forest (PH), and pine forest (P). Relative probability of selecting resource X is a function of used and available attributes within our choice sets.
Many parts of the southeastern United States are devoid of subterranean roosts, so tree cavities and foliage are important for the winter roosting ecology of tricolored bats in this region. Our results suggest that access to multiple roost microclimates is important for forest-dwelling tricolored bats during winter and a diverse array of anthropogenic and tree roost structures facilitate winter survival. Forest management practices that retain live trees near streams with multiple roosting structures and foster cavity formation in hardwood forests will likely benefit this population. Winter surveys of anthropogenic structures like bridges also might help identify other tricolored bat populations using non-subterranean roosts during winter. Given tricolored bats at SRS used tree and bridge structures, we encourage future studies to explore the possibility of multiple roost structure use within a single winter season. Forest habitats in mild climates could represent important refugia from WNS for the tricolored bat and other bat species using thermally unstable roosts. Understanding roosting ecology and viability of forest-dwelling bat populations during winter is critical for the conservation of these species throughout the southeastern United States.
Supplementary Data
Supplementary data are available at Journal of Mammalogy online.
Supplementary Data SD1.—Stand vegetation types reclassified into four broad vegetation types present within the Upper Coastal Plain of South Carolina, November – March 2017 – 2019. We accessed data on vegetation type from the vegetation database within the Natural Resources Information System framework.
Acknowledgments
Funding for this project was provided by the United States Fish and Wildlife Service White-nose Syndrome fund grant number F17PG00177 fund and the United States Forest Service, Southern Research Station grant number 18-JV011330134-001. We thank P. Jodice and the Clemson University Bat Lab for valuable feedback on an earlier draft. We thank J. Perez-Jimenez and L. Schenk for their hard work in the field and positive attitudes. We also thank the United States Forest Service Savannah River funded under the Department of Energy’s Interagency Agreement, DE-EM0003622, for their support and help especially E. Olson, A. Horcher, and C. Davis. Any use of trade, firm, or product names is for descriptive purposes only and does not imply endorsement by the United States Government.
