")


The latest annual mid–year population estimates for Trinidad and Tobago. The mid-year (30 June) estimates of population are based on results from the latest Census of Population

15-64 years
486,720

15-64 years
476,681

0-14 years
143,318

0-14 years
138,228

65+ years
122,565
as at 30th June, 2023
| Age Group | Total | Male | Female |
|---|---|---|---|
| 0 – 14 | 281,546 | 143,318 | 138,228 |
| 15 – 64 | 963,400 | 486,720 | 476,681 |
| 65+ | 122,564 | 56,082 | 66,483 |
| All Age groups | 1,367,510 | 686,119 | 681,391 |

 Mid-Year Population Estimates
The mid-year population is an estimate of the country’s population as at the 30th June of any given year.
 Population Data Tables

 2021 Population-Pyramid (percentage).xlsx
 Keywords: male population, female population, census, population estimates, migration, community
Census population counts
The total (de jure) population of Trinidad and Tobago based on the 2011 Population and Housing Census was 1,328,019. This population referred to all persons whose usual residence at the time was Trinidad and Tobago and did not include visitors to the country.
2011 Population and Housing Census Demographic Report
Included in the count:
- Household or Non-institutional population usually resident in the country and were present on Census Night 12:00am on the 9th January, 2011.
- Household or Non-institutional population usually resident in the country who were abroad for less than six (6) months on Census Night.
- Population in Institutions and in Workers Camps
- Street Dwellers.
- T&T Students studying abroad.
Excluded from the count:
- Foreign students studying in Trinidad and Tobago
- Foreign diplomats residing in Trinidad and Tobago


Sex Ratio
The sex ratio gives the proportion of males to females in a population. It is the proportional distribution of the sexes in a population aggregate, expressed as the number of males per 100 females.

Total (age) Dependency ratio
The dependency ratio is a measure of the number of dependents aged 0 to 14 and over the age of 65, compared with the total population age 15 – 64.

Ageing Index
The Aging Index refers to the number of elders per 100 persons younger than 15 years old in the population. Generally, this index increases as population ages.

Youth Dependency Ratio or young-age dependency ratio
The ratio of younger dependents – people younger than 15 – to the working-age population – those ages 15-64.

Comparison of Total Population, 2011 and 2000: Trinidad and Tobago
| Population | 2011 | 2000 | Change (%) |
|---|---|---|---|
| Non institutional – persons found in private dwellings | 1,322,546 | 1,250,652 | 5.7 |
| Institutions and Workers Camps - usual residents | 4,939 | 11,714 | -57.8 |
| Street Dwellers | 534 | 471 | 13.4 |
| Total | 1,328,019 | 1,262,366 | 5.2 |
| Source: Population and Housing Census, 2011 | |||
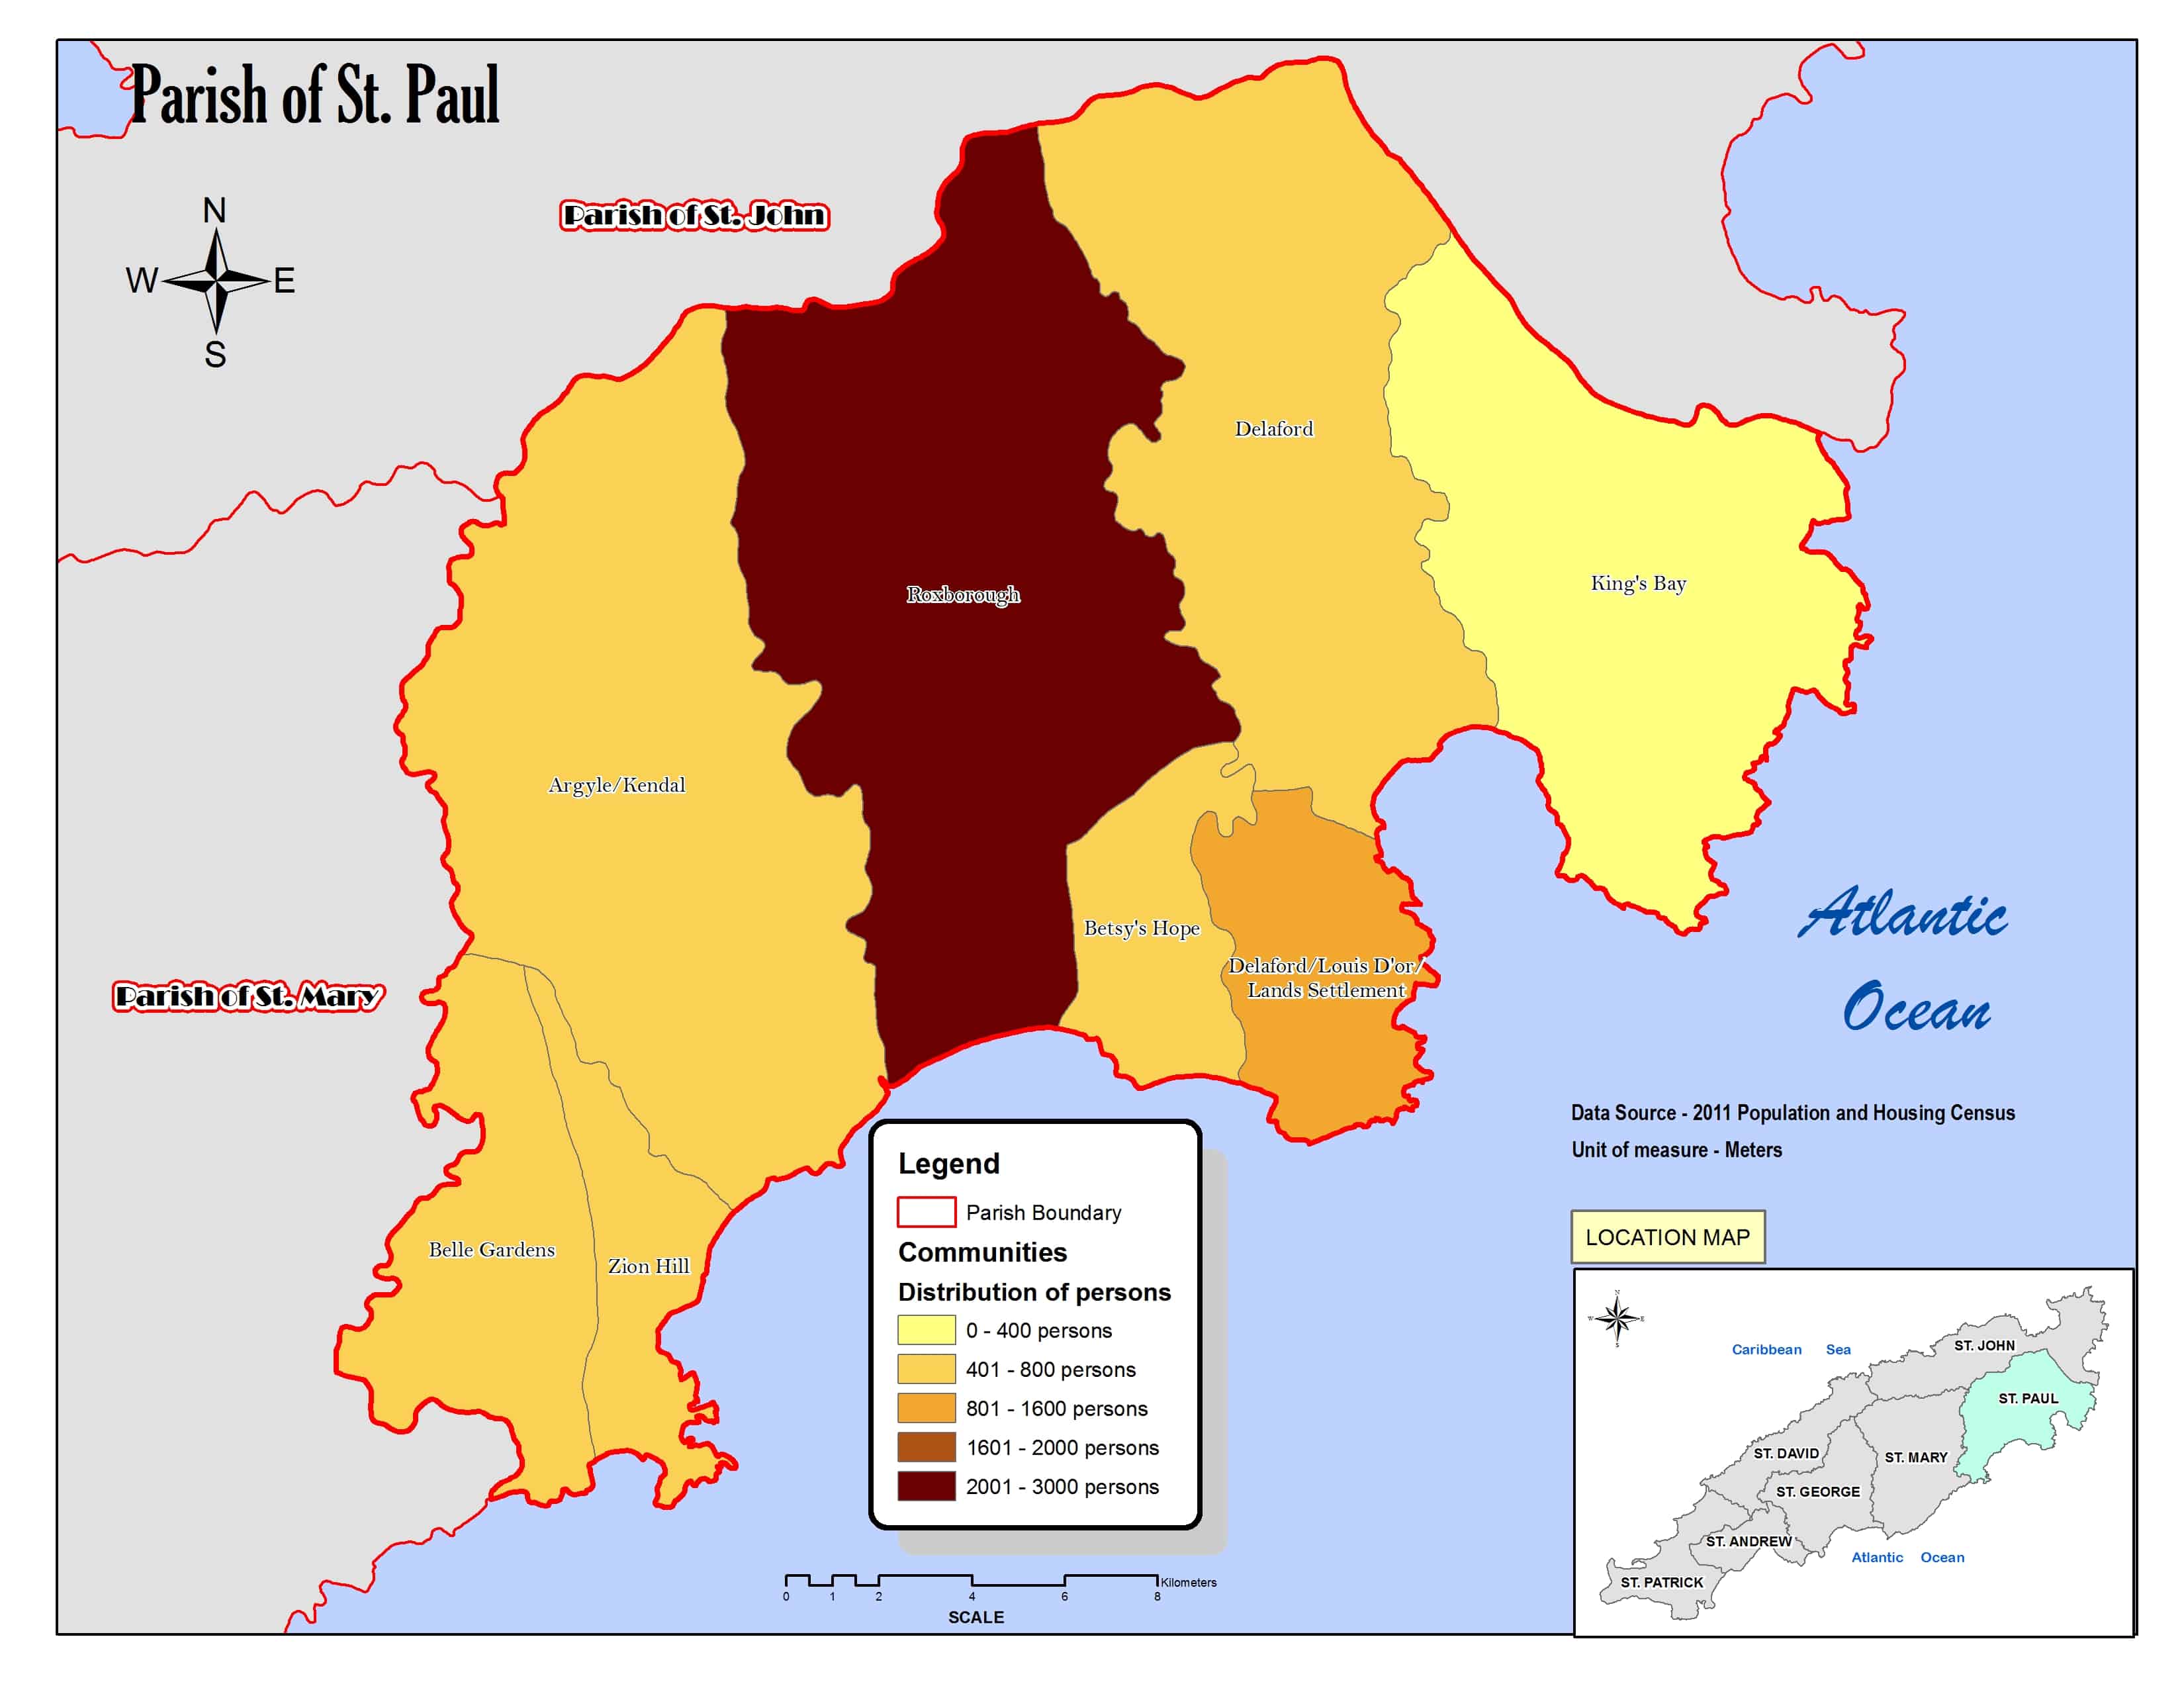
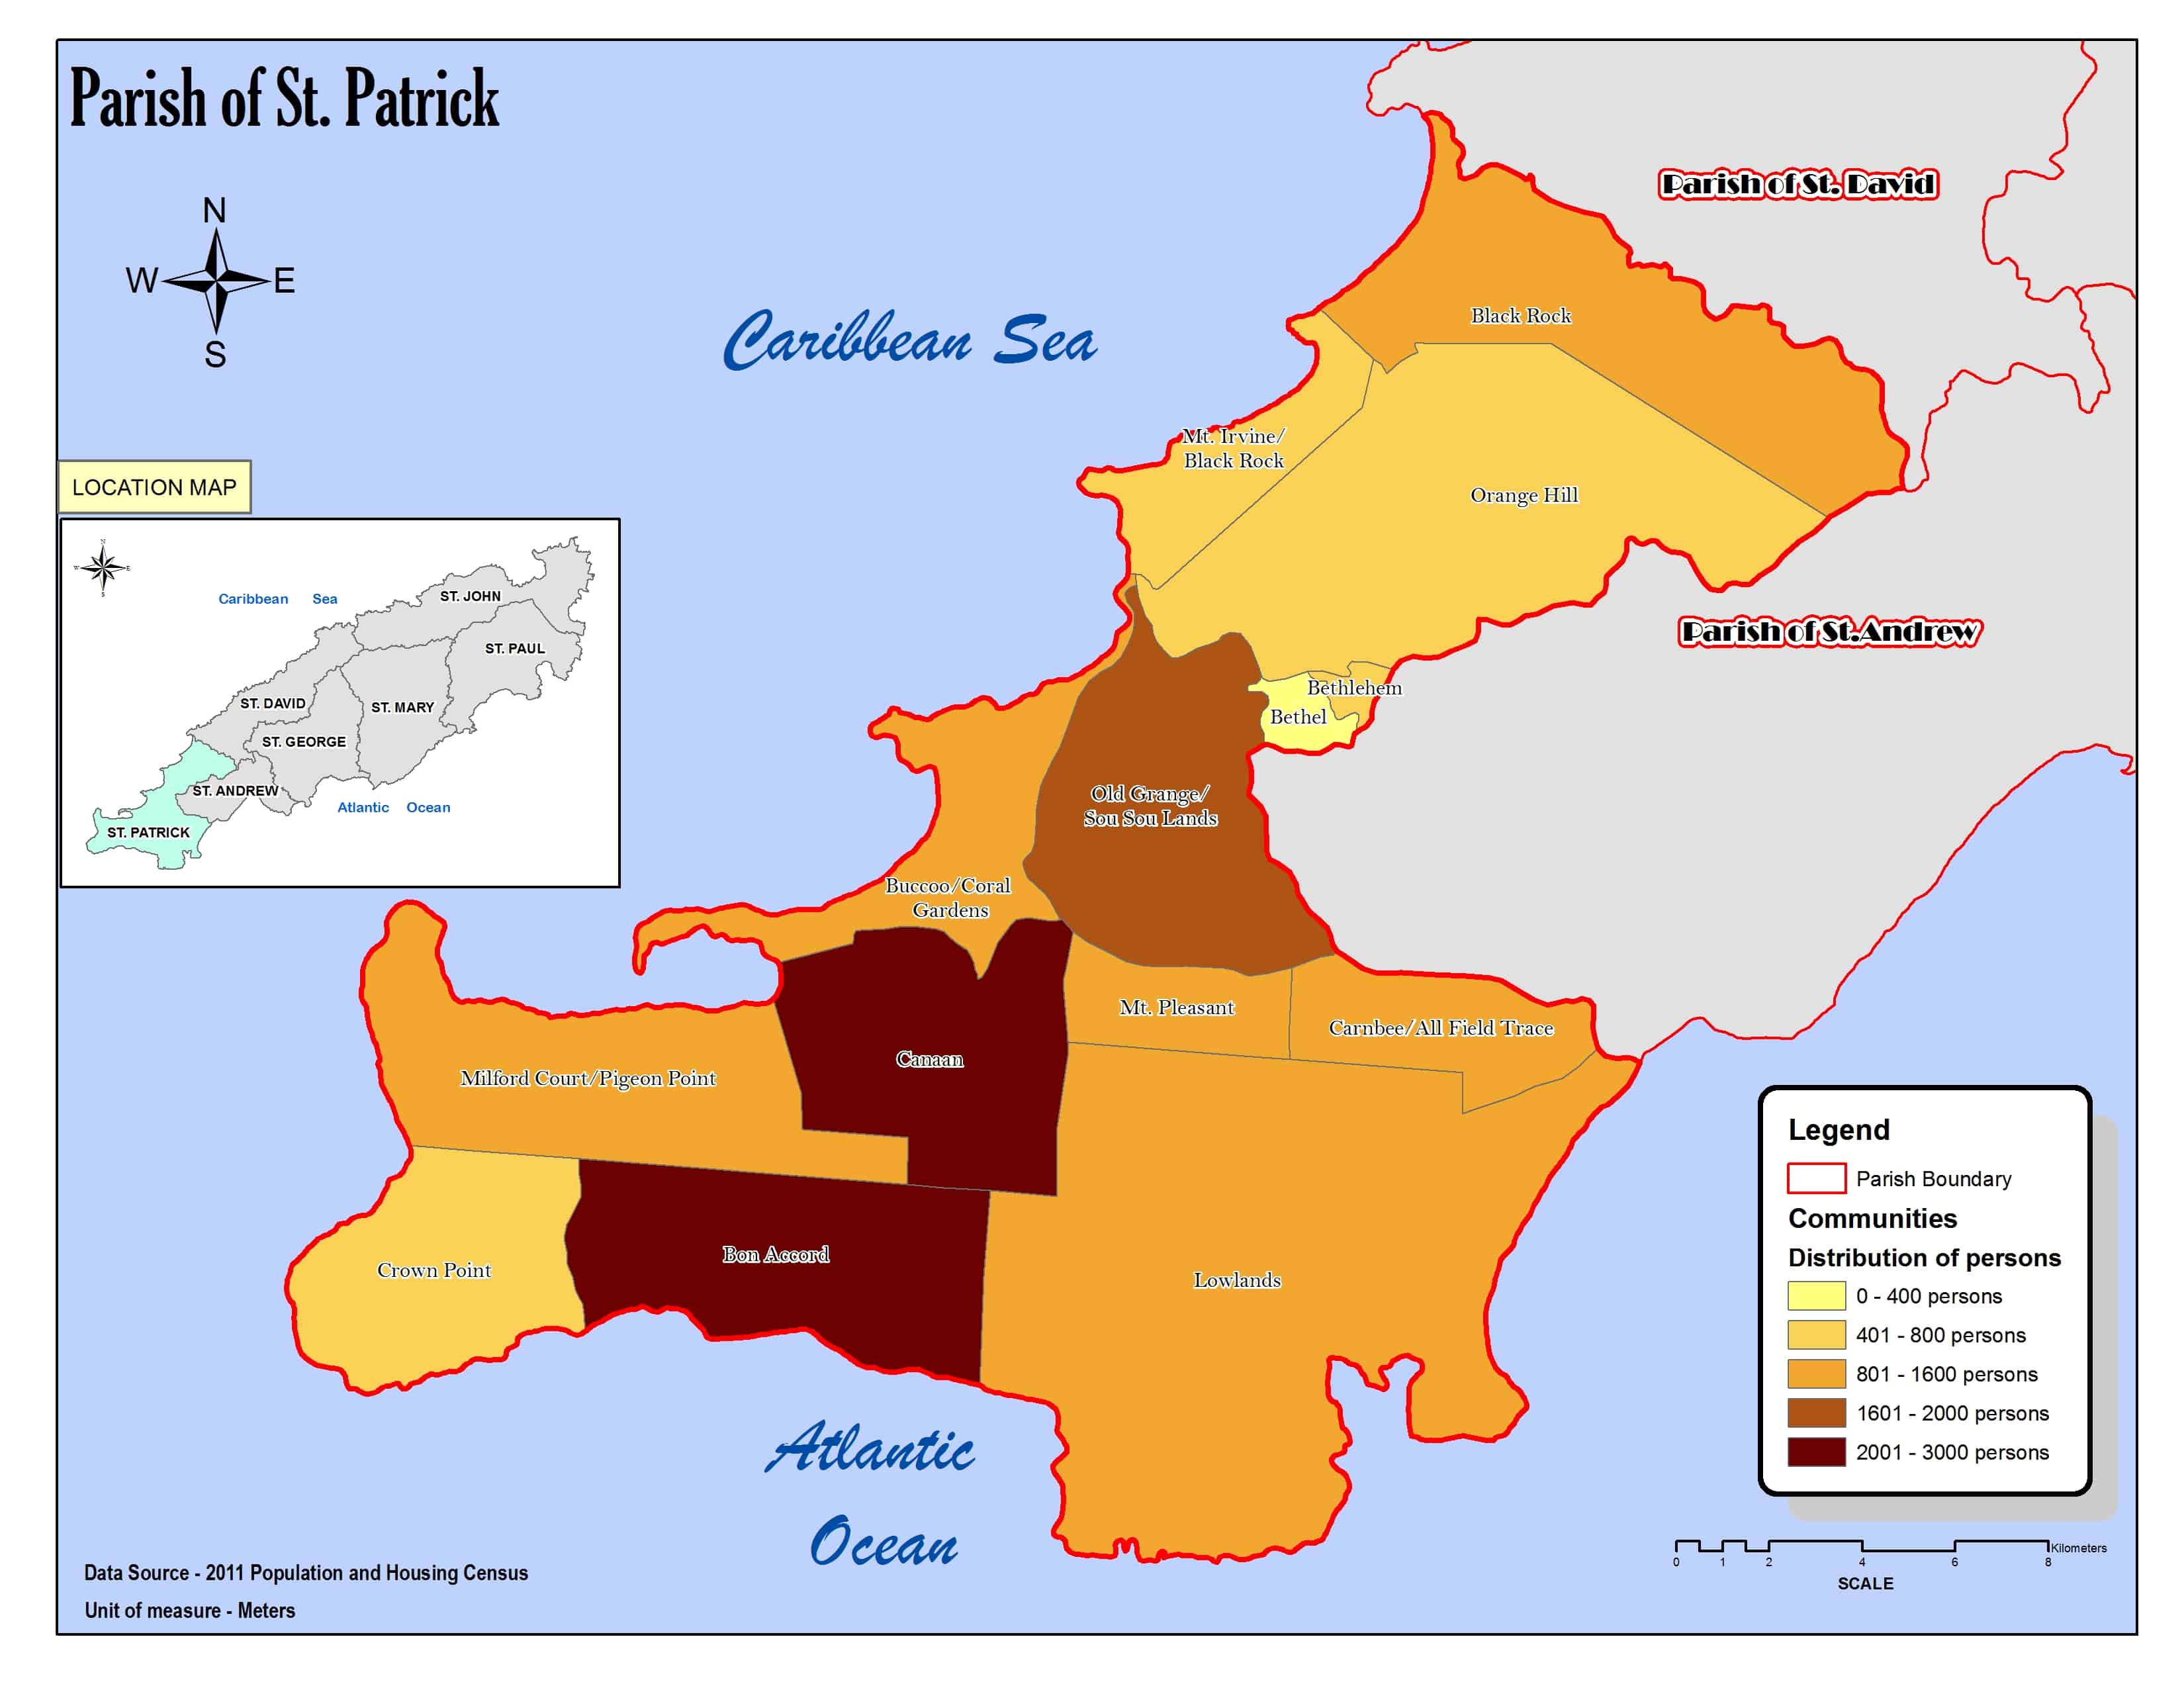
Community Register
The Community Register provides information on the Population by sex, number of buildings, dwelling units, households, business places and institutions by Enumeration District and Community. The data are provided by City, Borough, and Regional Corporations for Trinidad and by Parishes for Tobago.
By following this button link👇,you can browse data organised by enumeration districts (EDs) and communities.
 View Table
Unit Definitions

Dwellings
| A room or group of rooms with a separate entrance not accessed through someone else’s living quarters. |

Households
| Consists of one or more persons living together (sleeping most nights of the week) and sharing at least one of the main daily meals. Members are not necessarily related. |

Collective Dwellings
| Structurally separate and independent places of abode intended for habitation by large groups of households or several households and are occupied at the time of the census. This includes hotels, lodging houses, institutions, ships in harbor, and camps. |
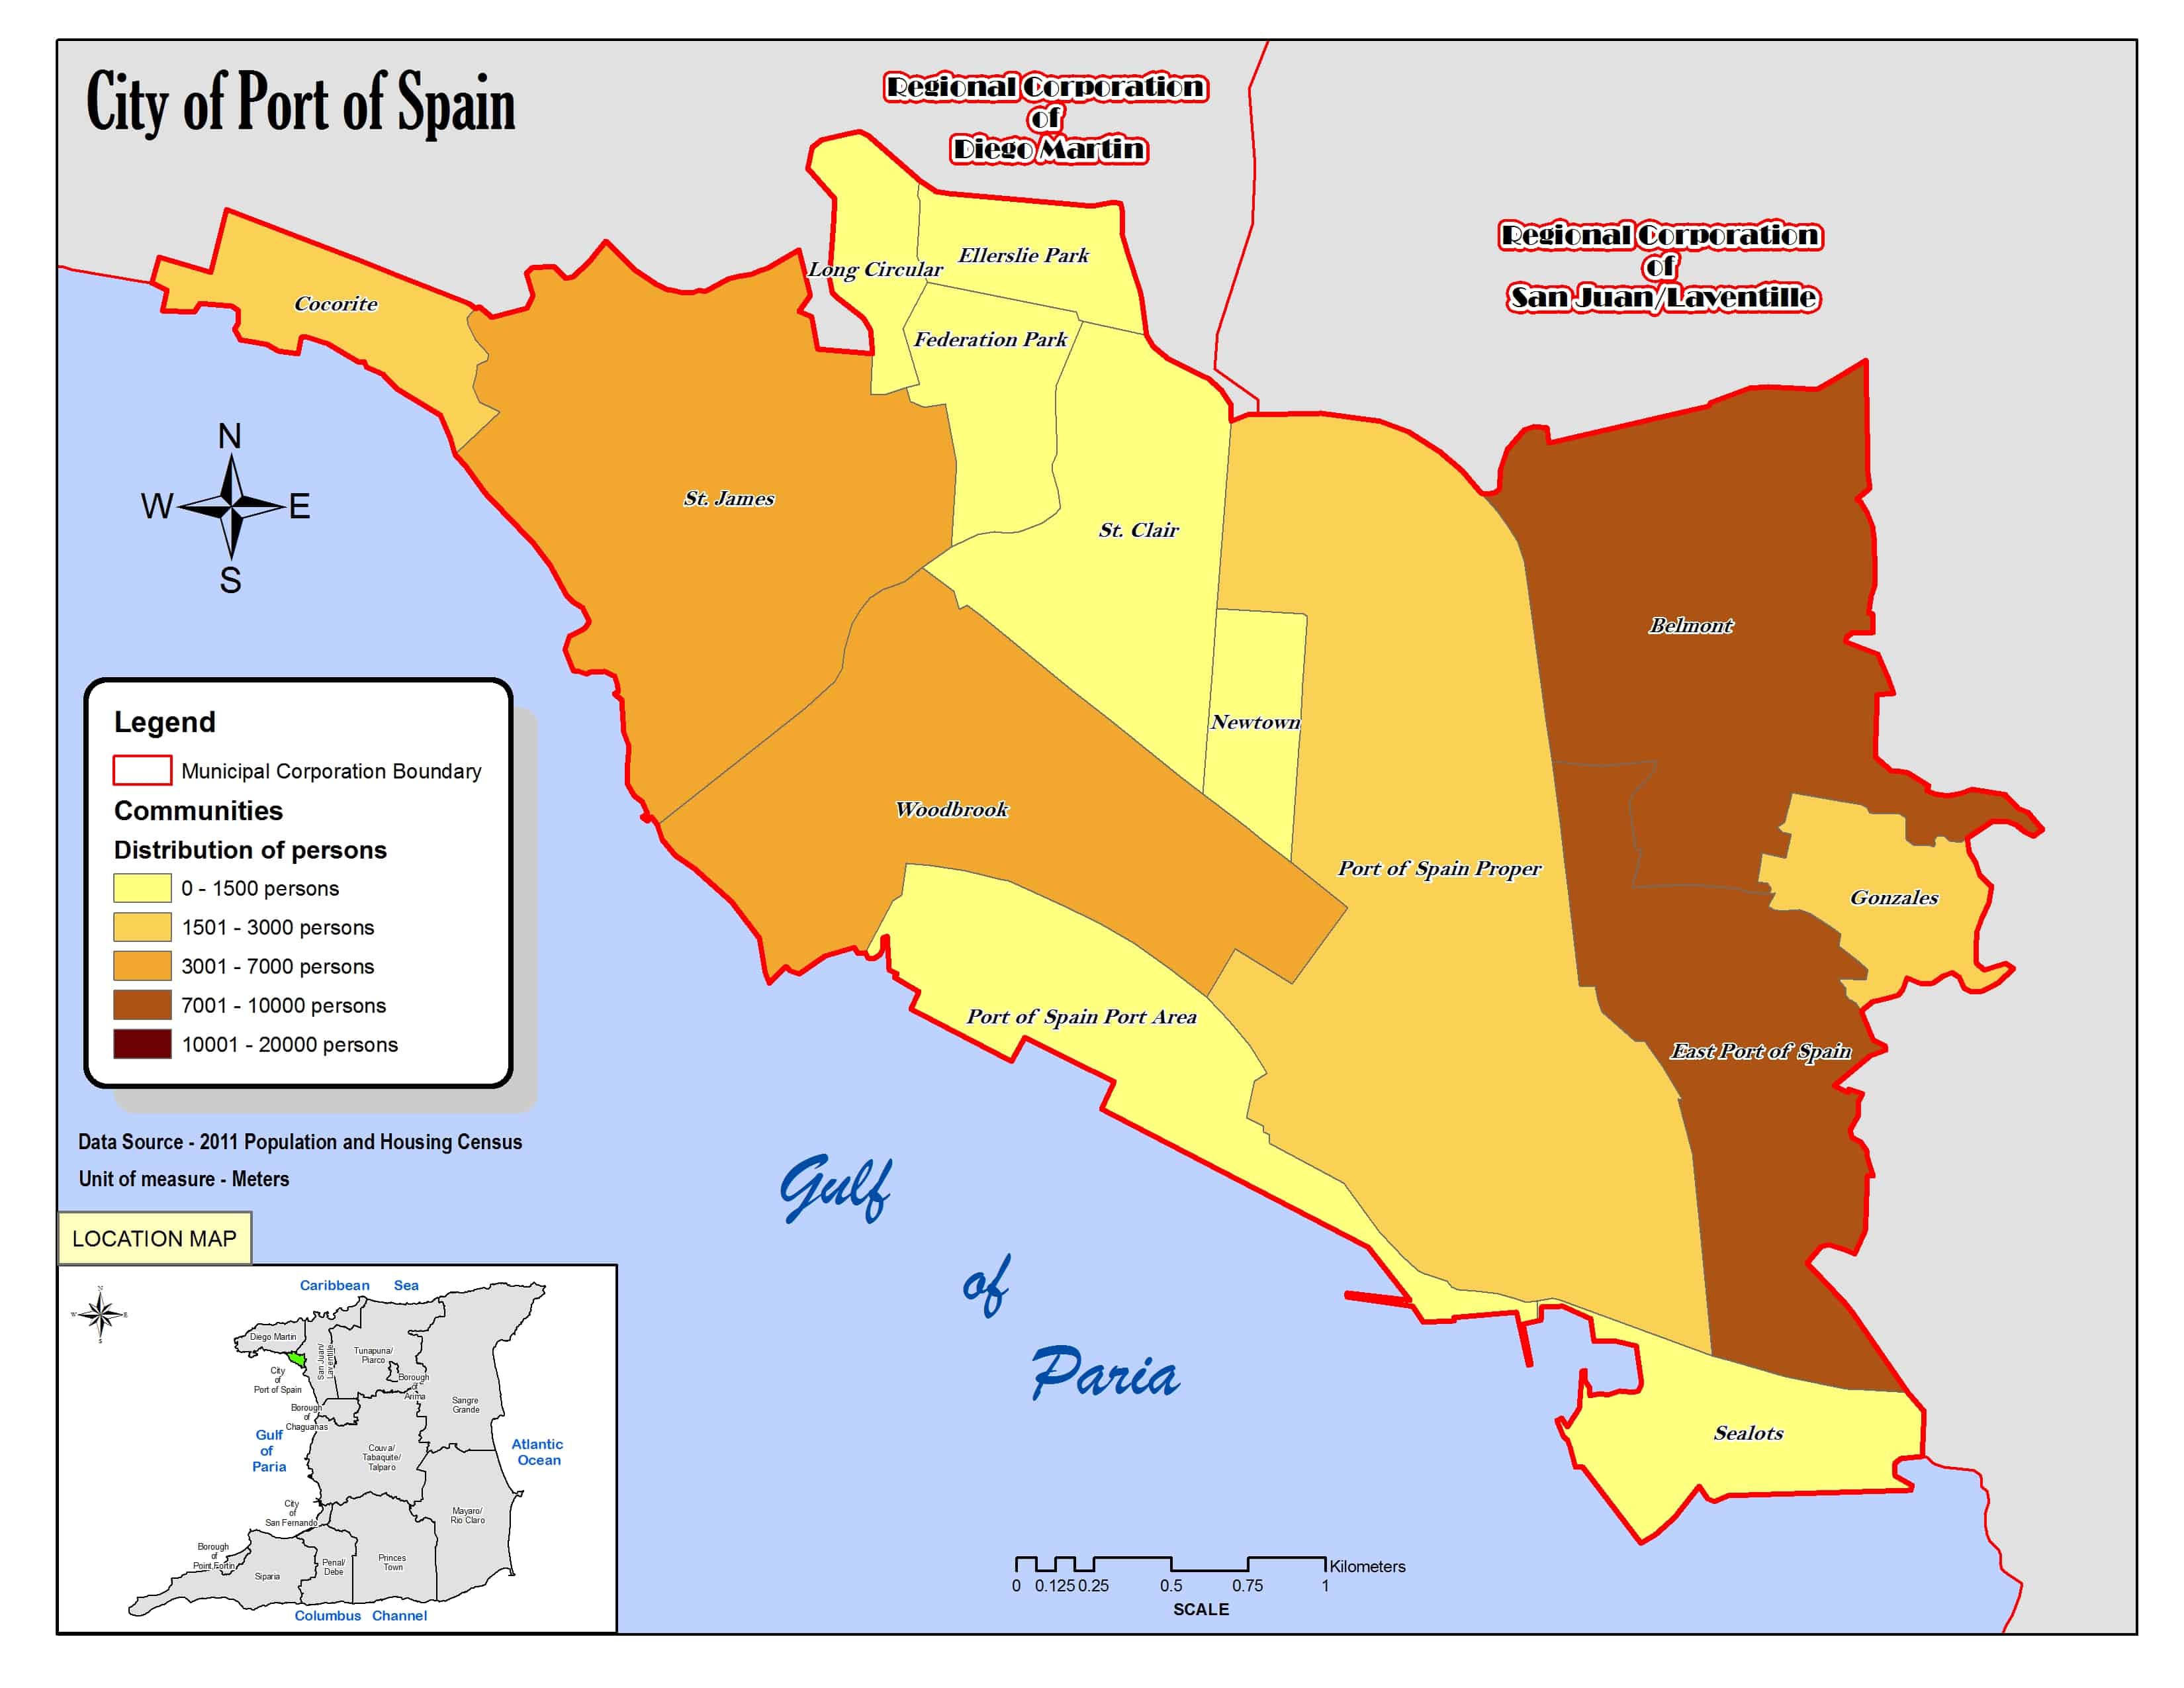
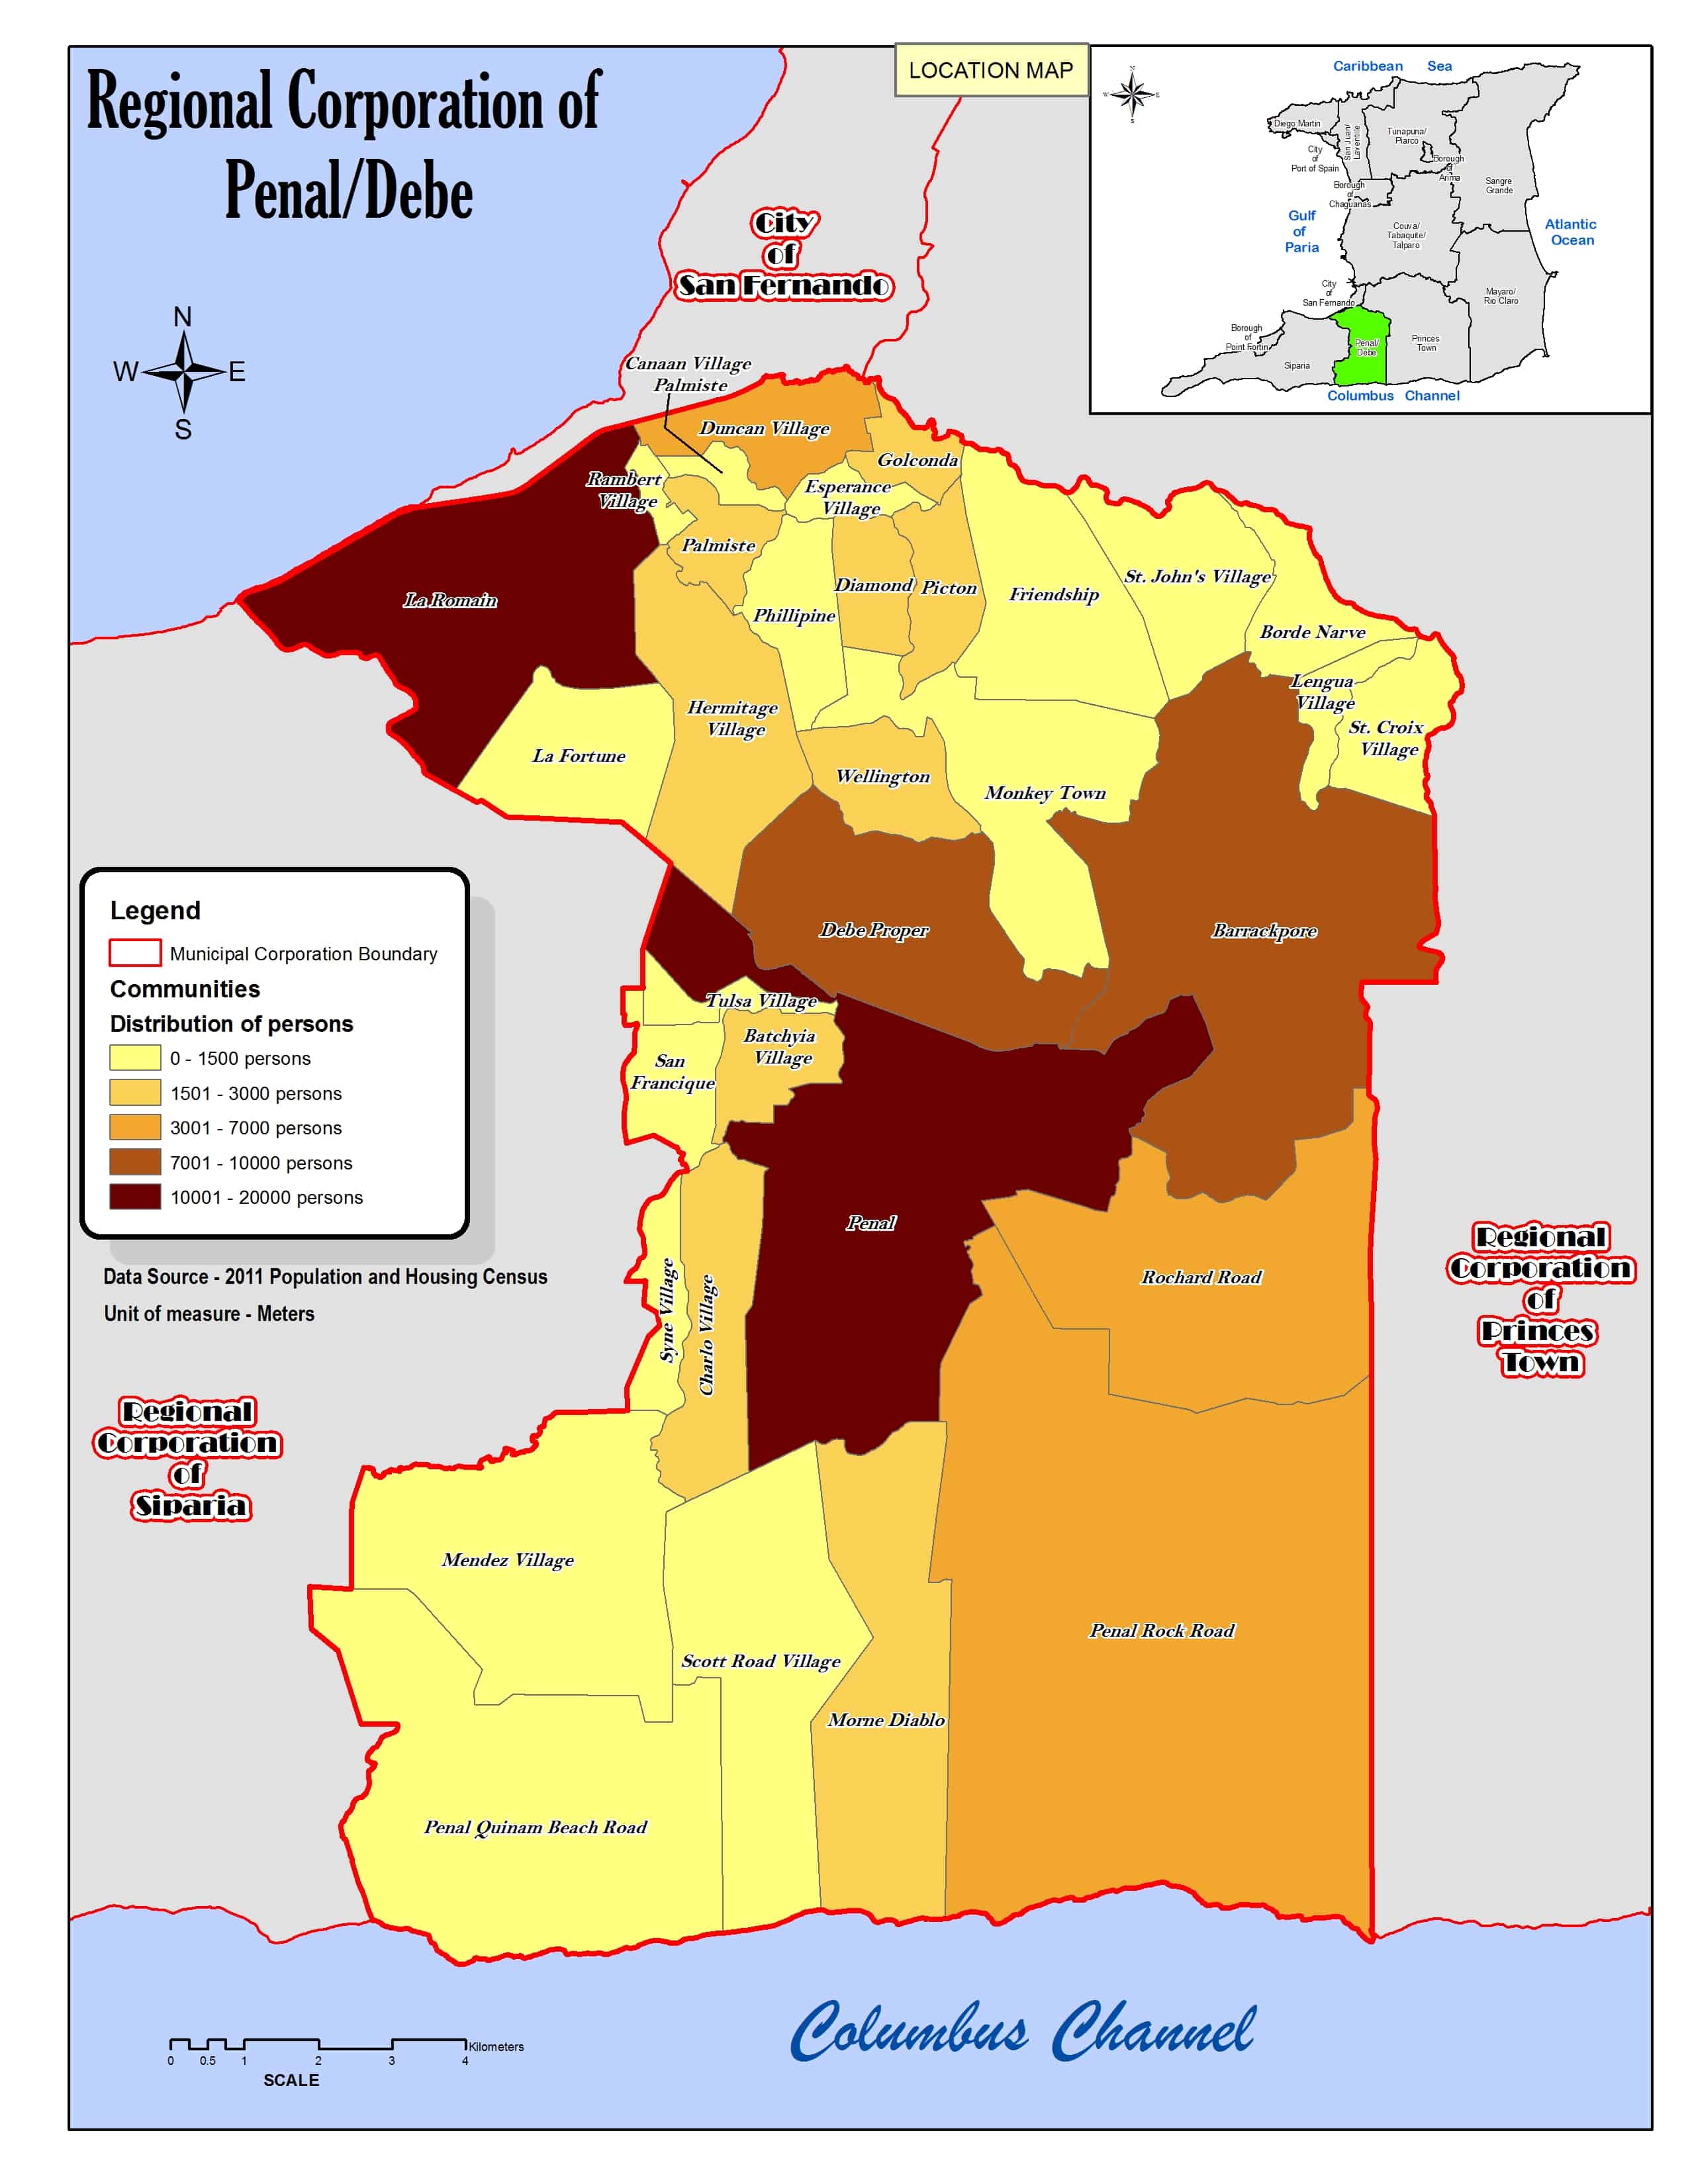
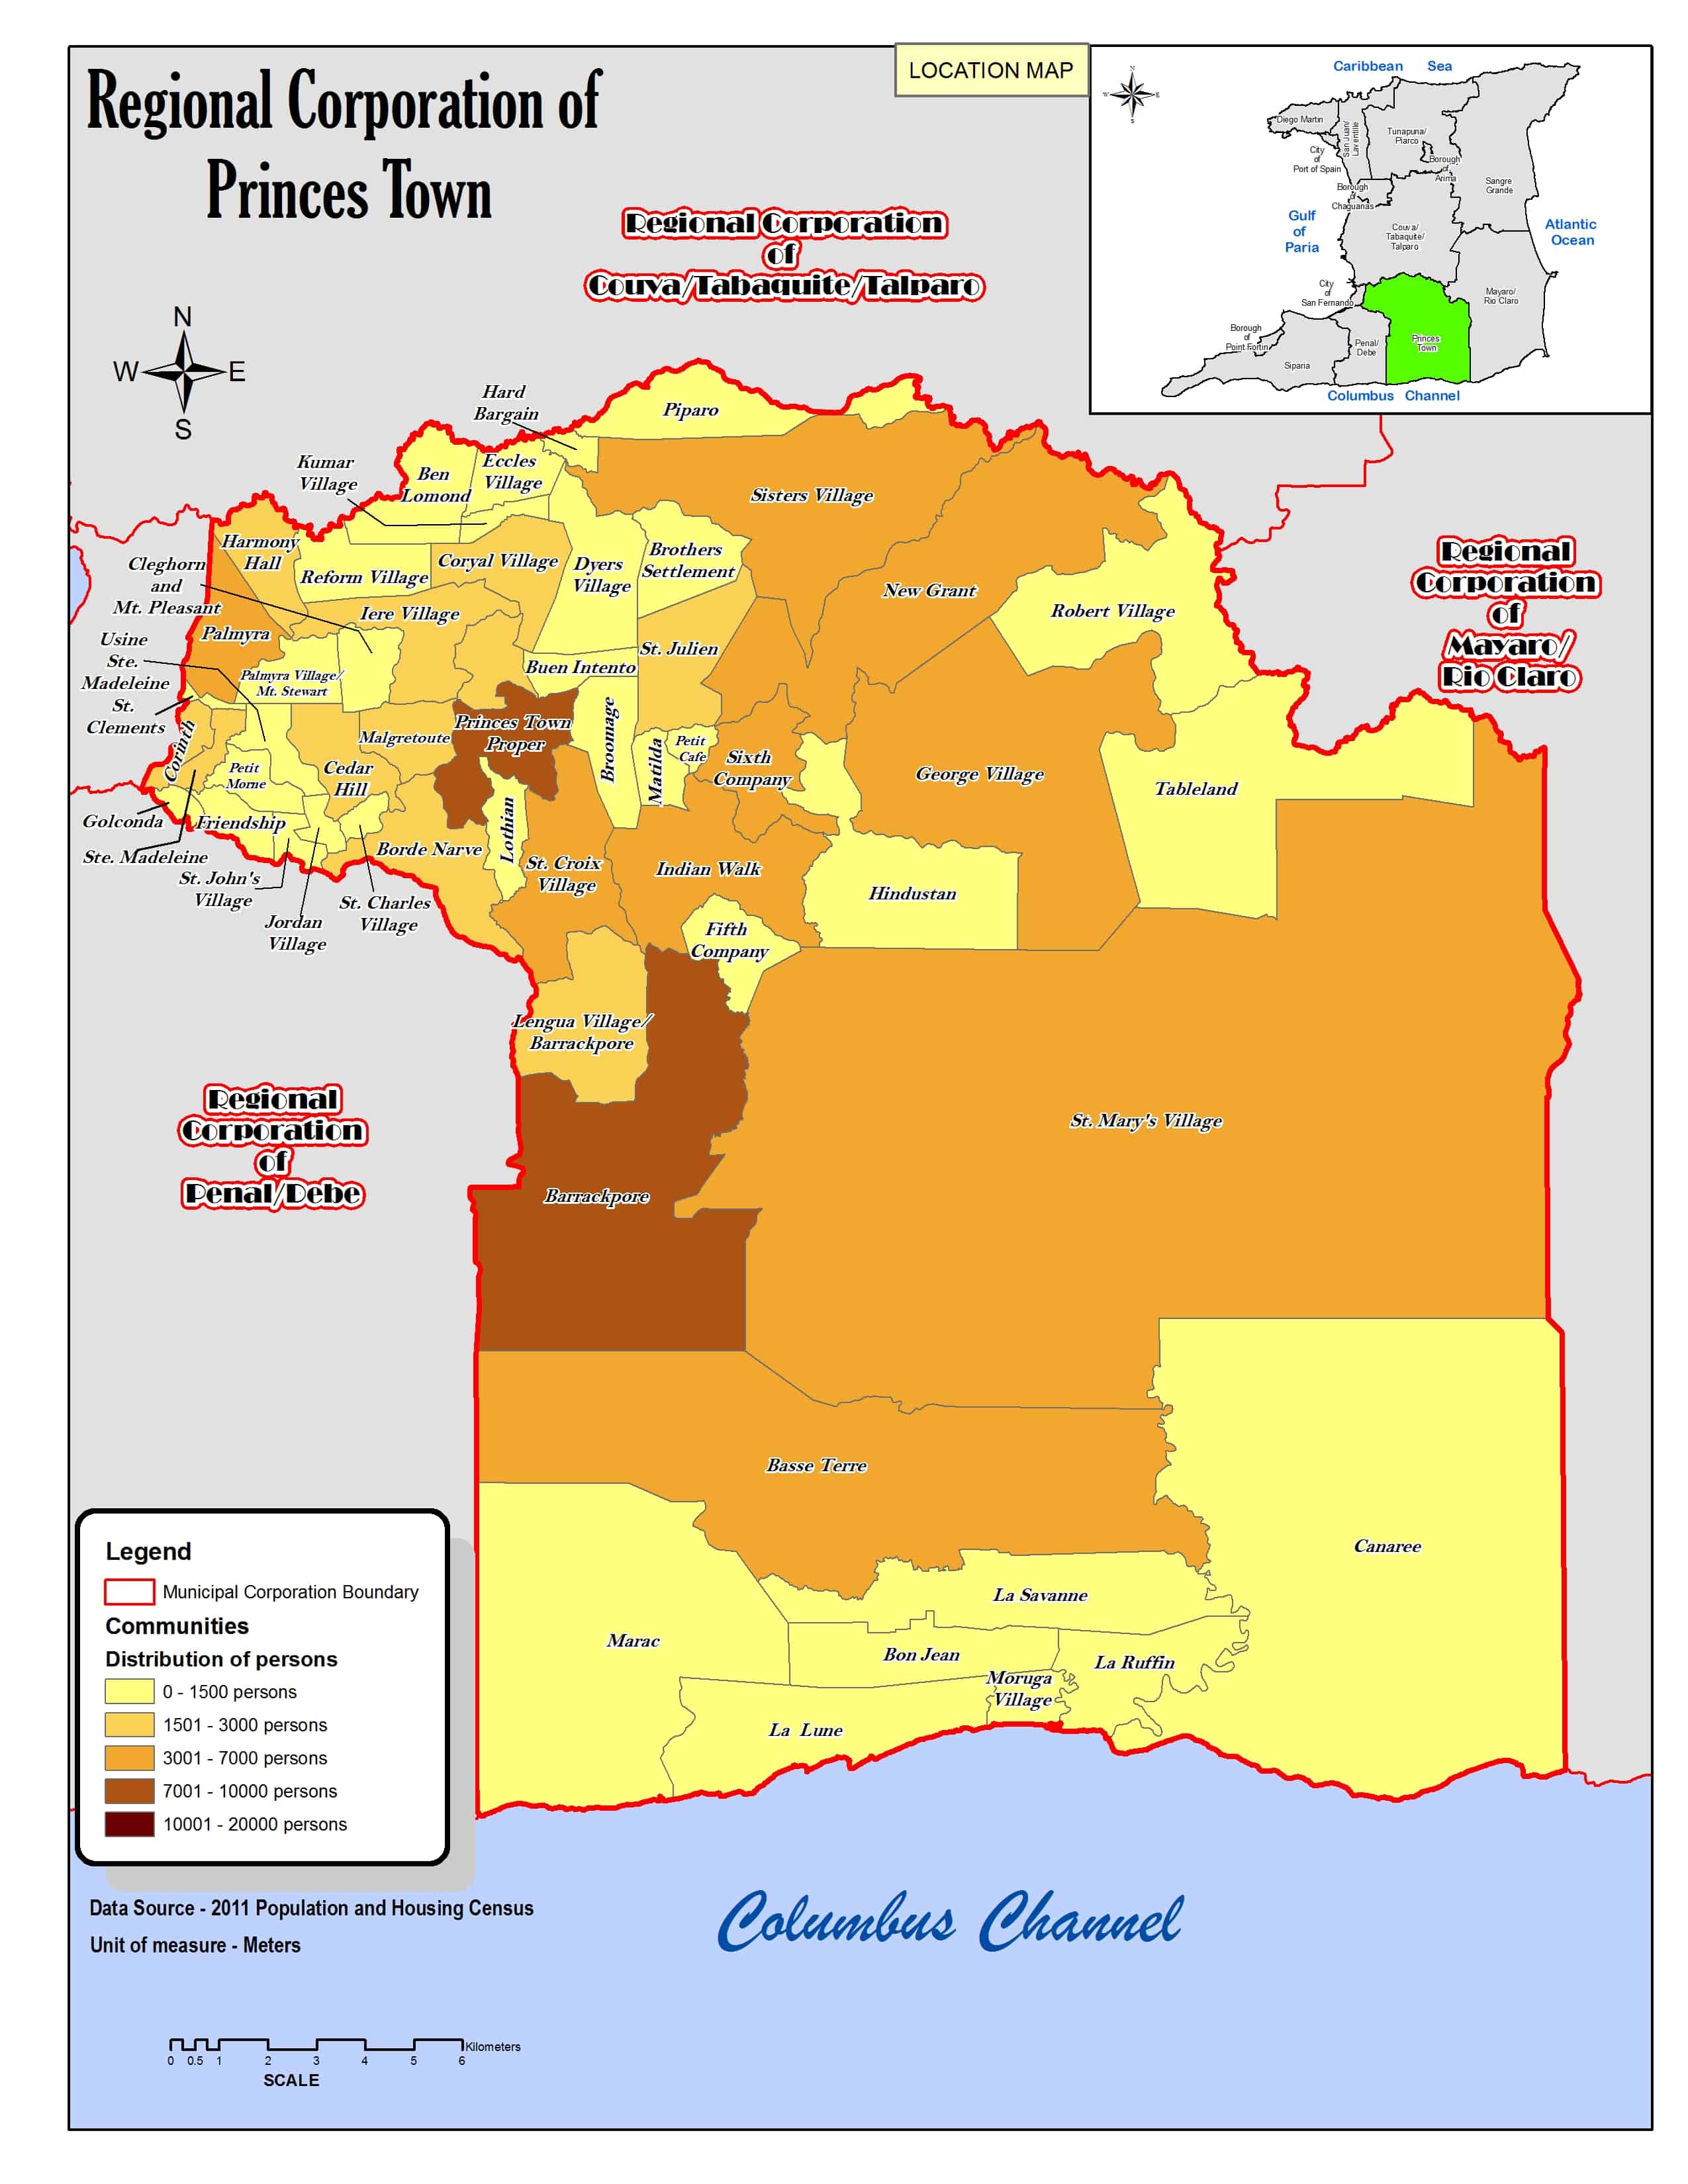
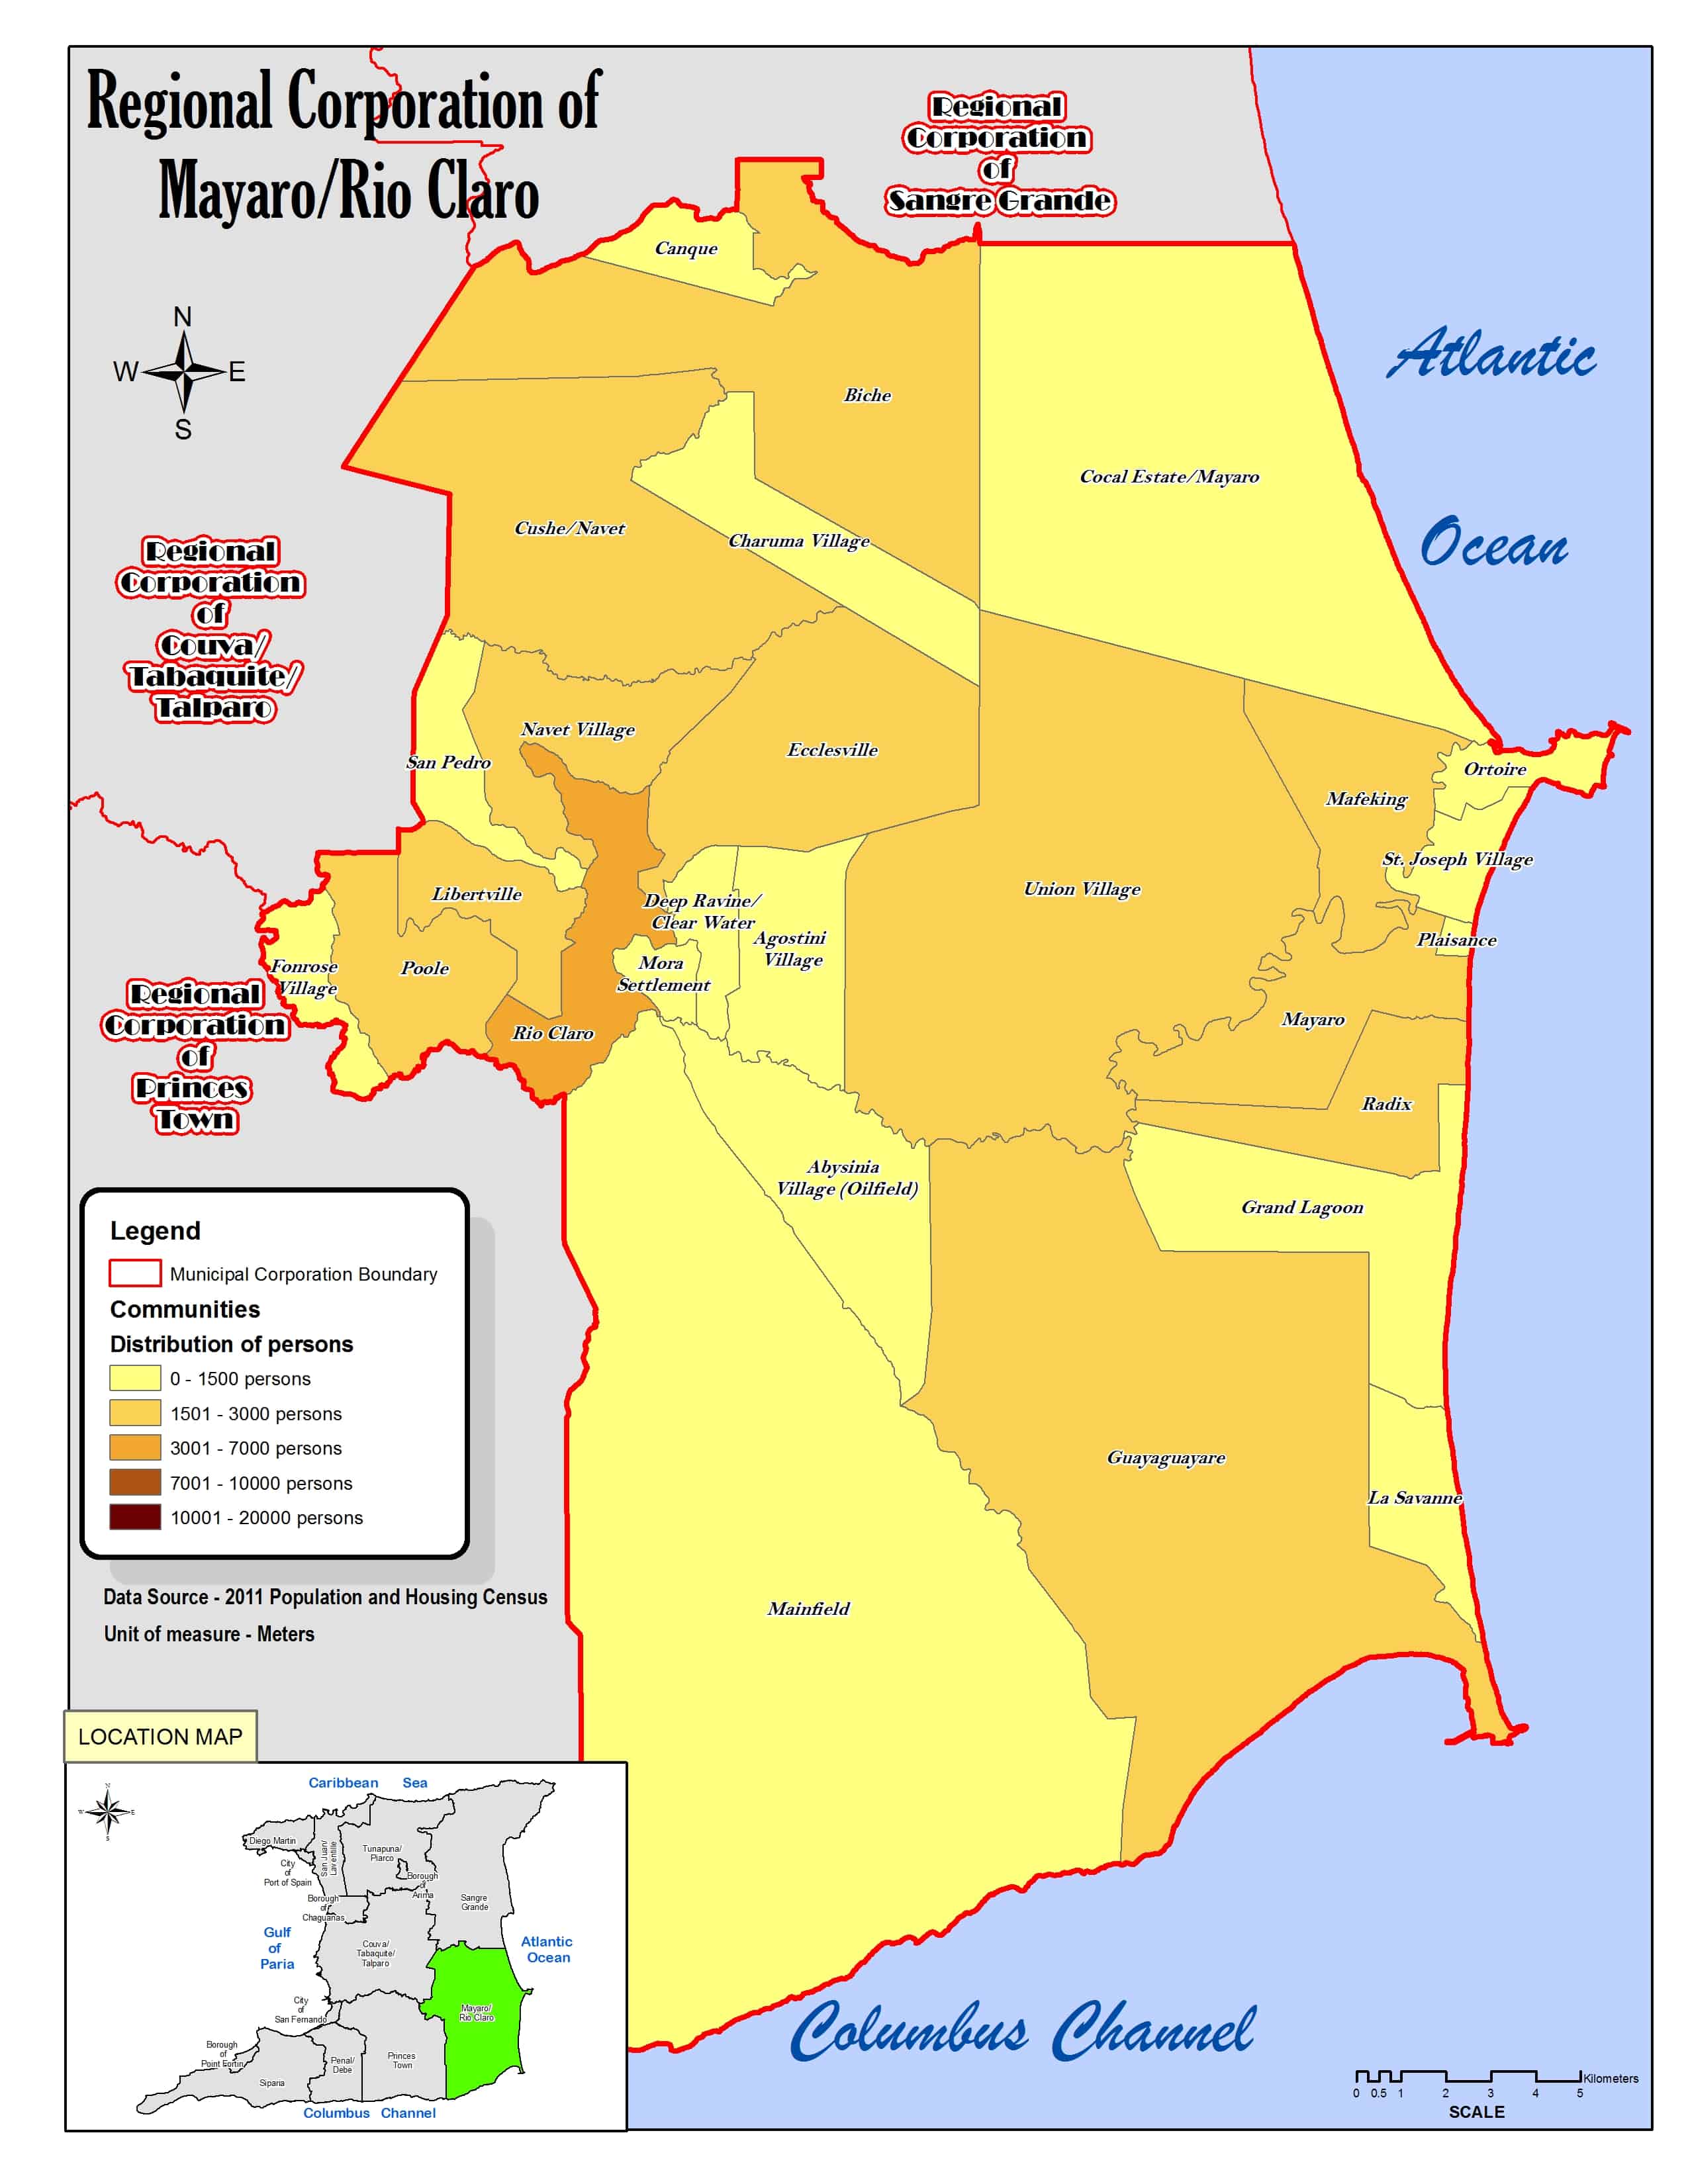
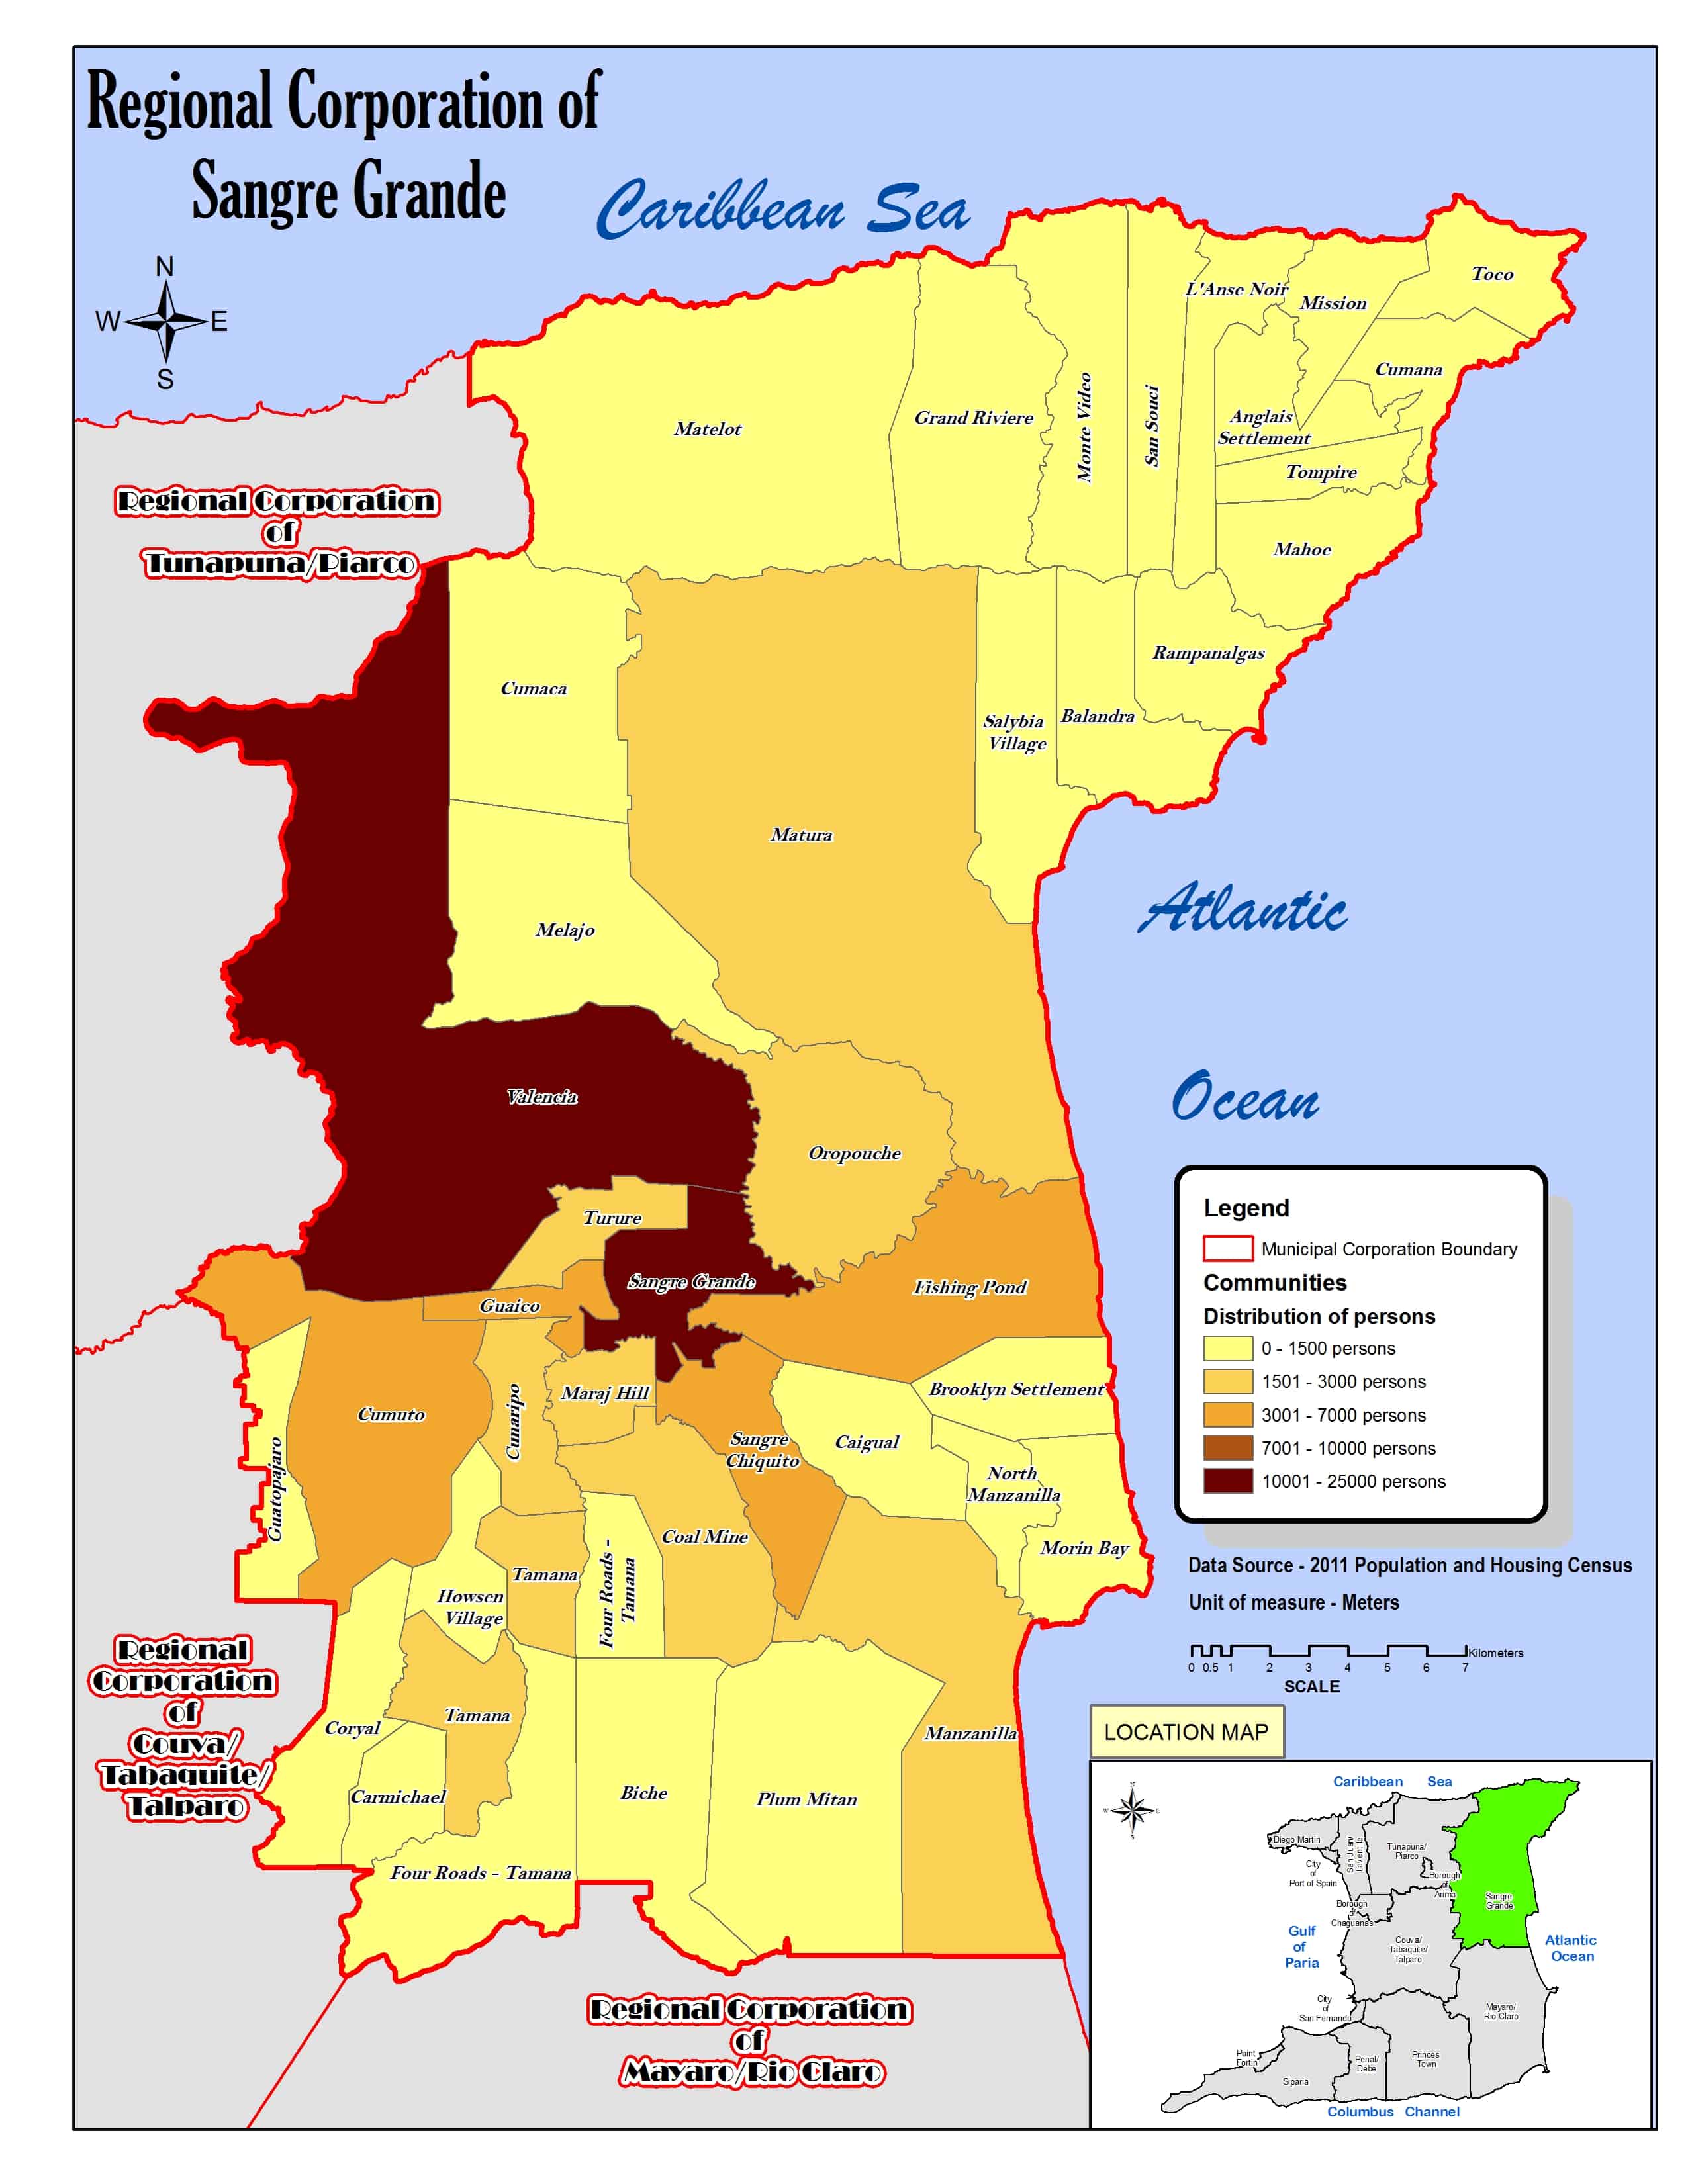
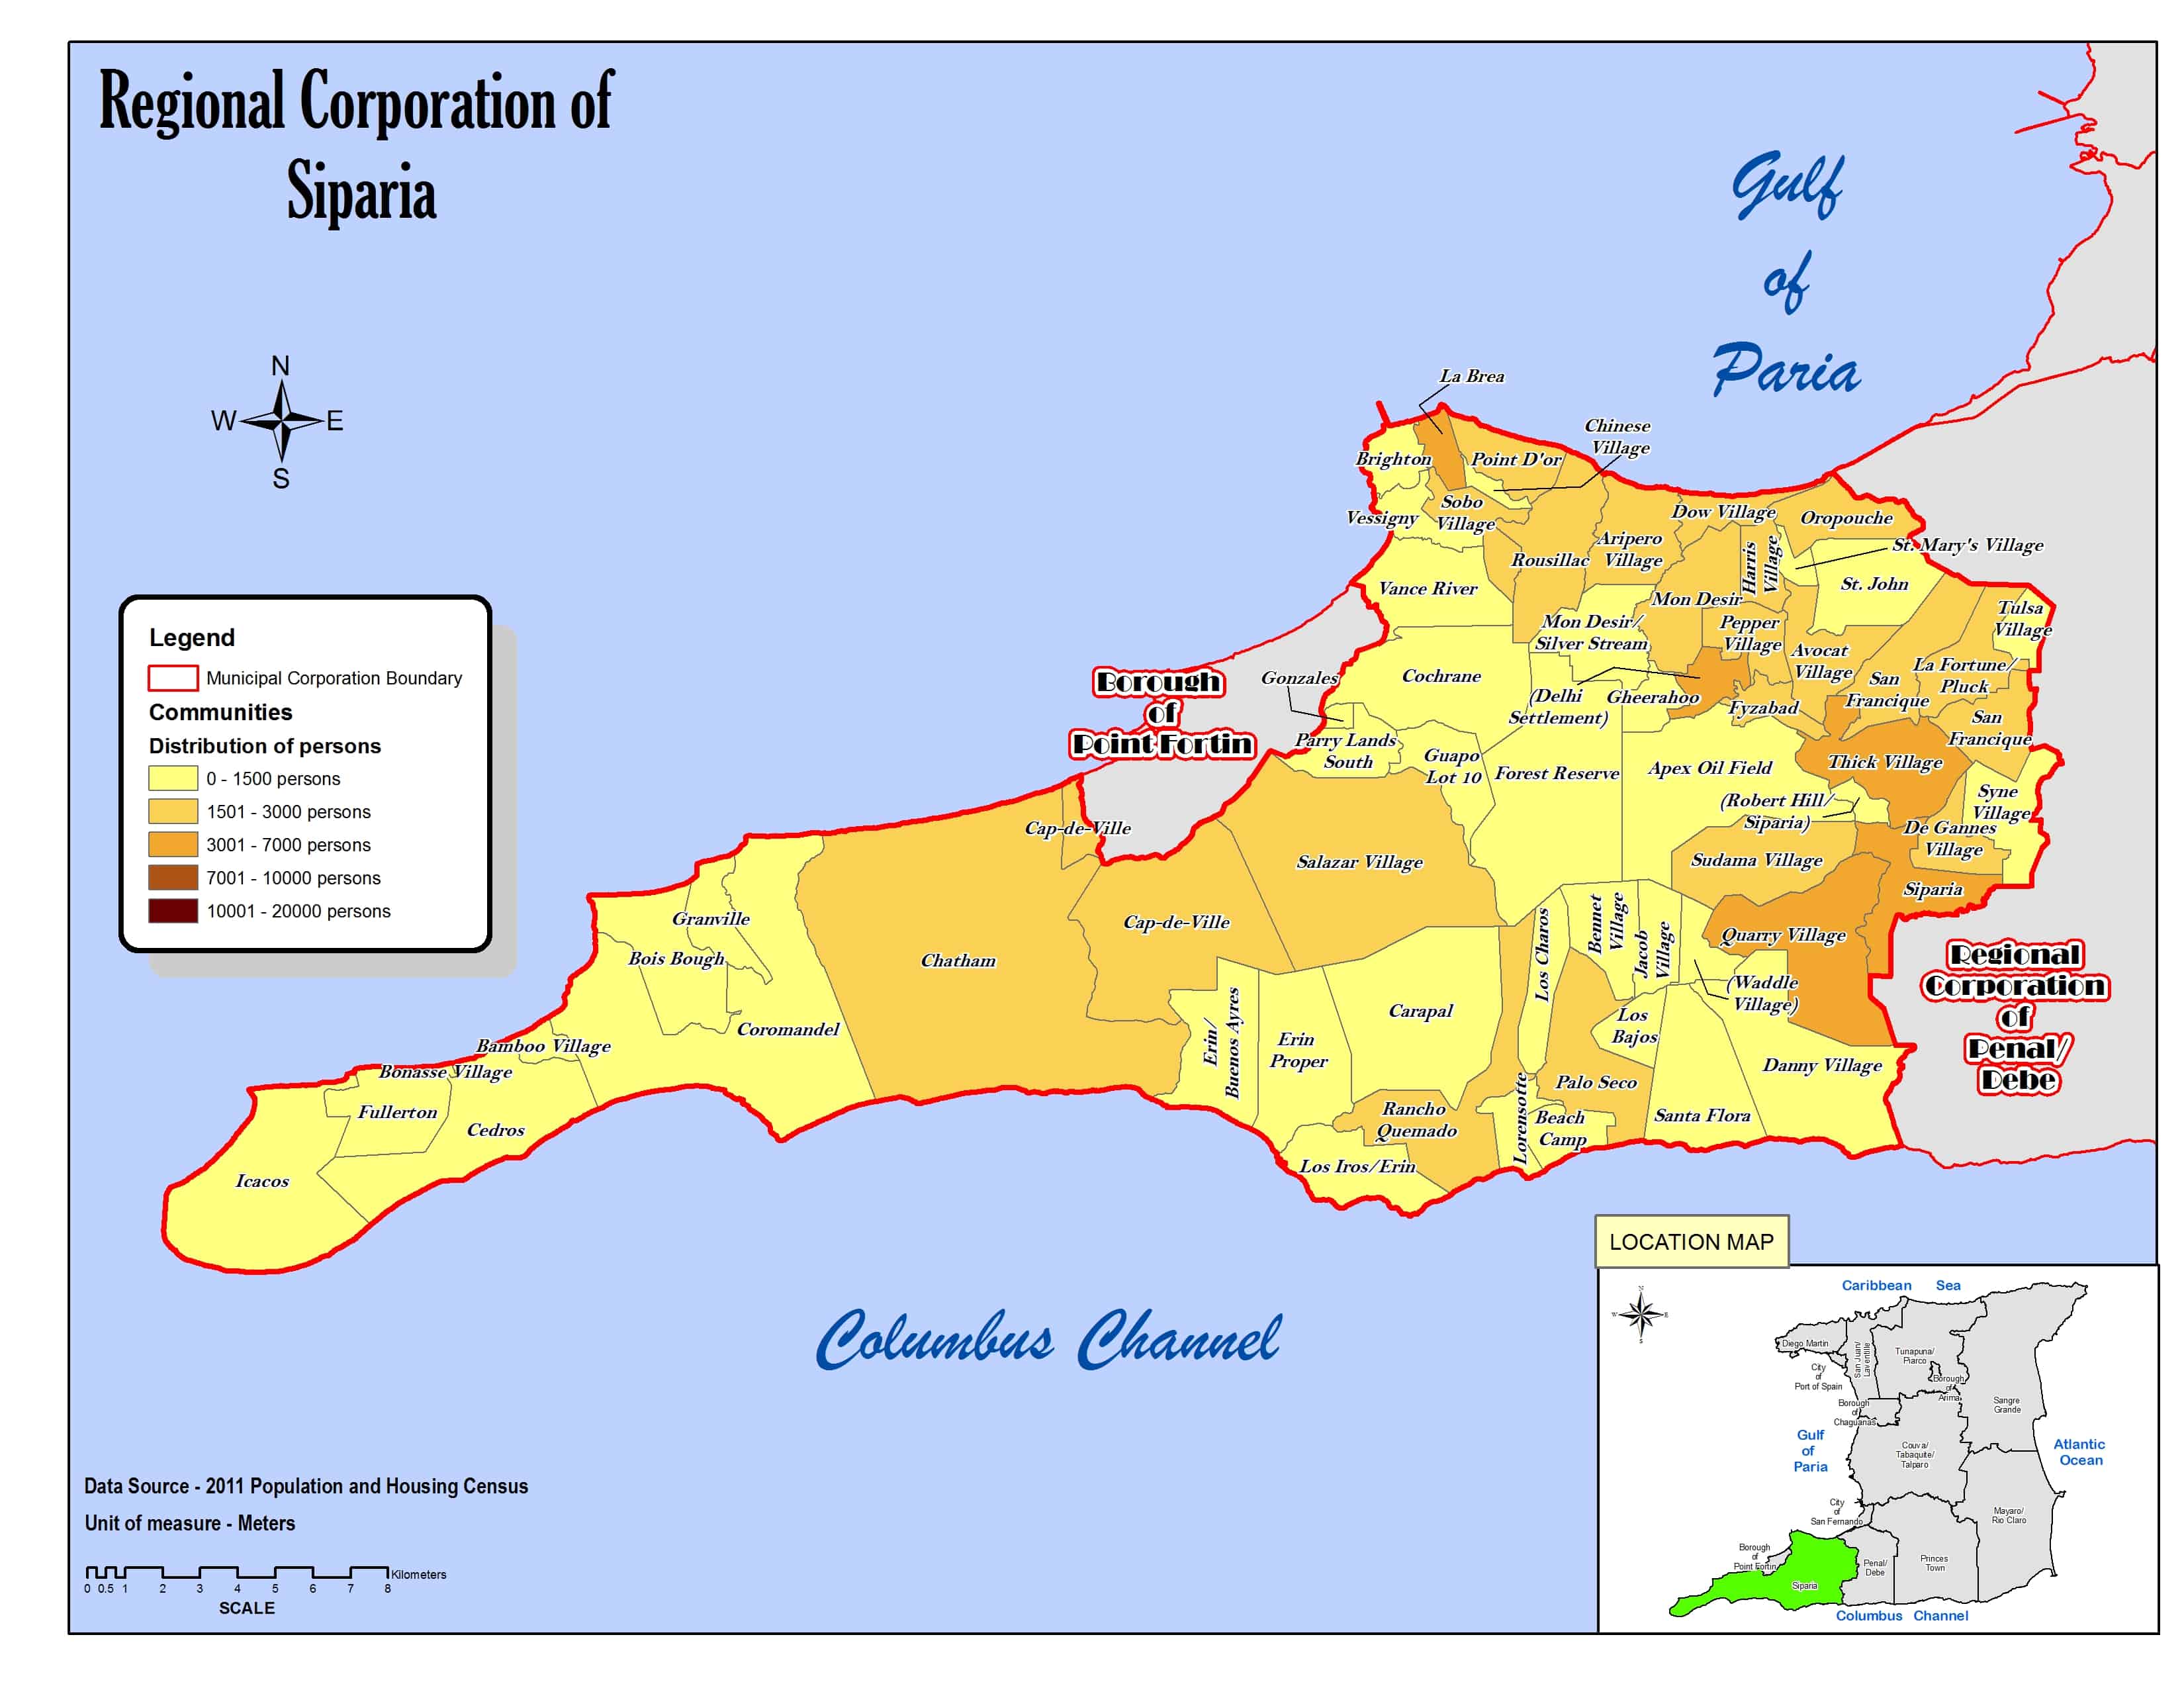
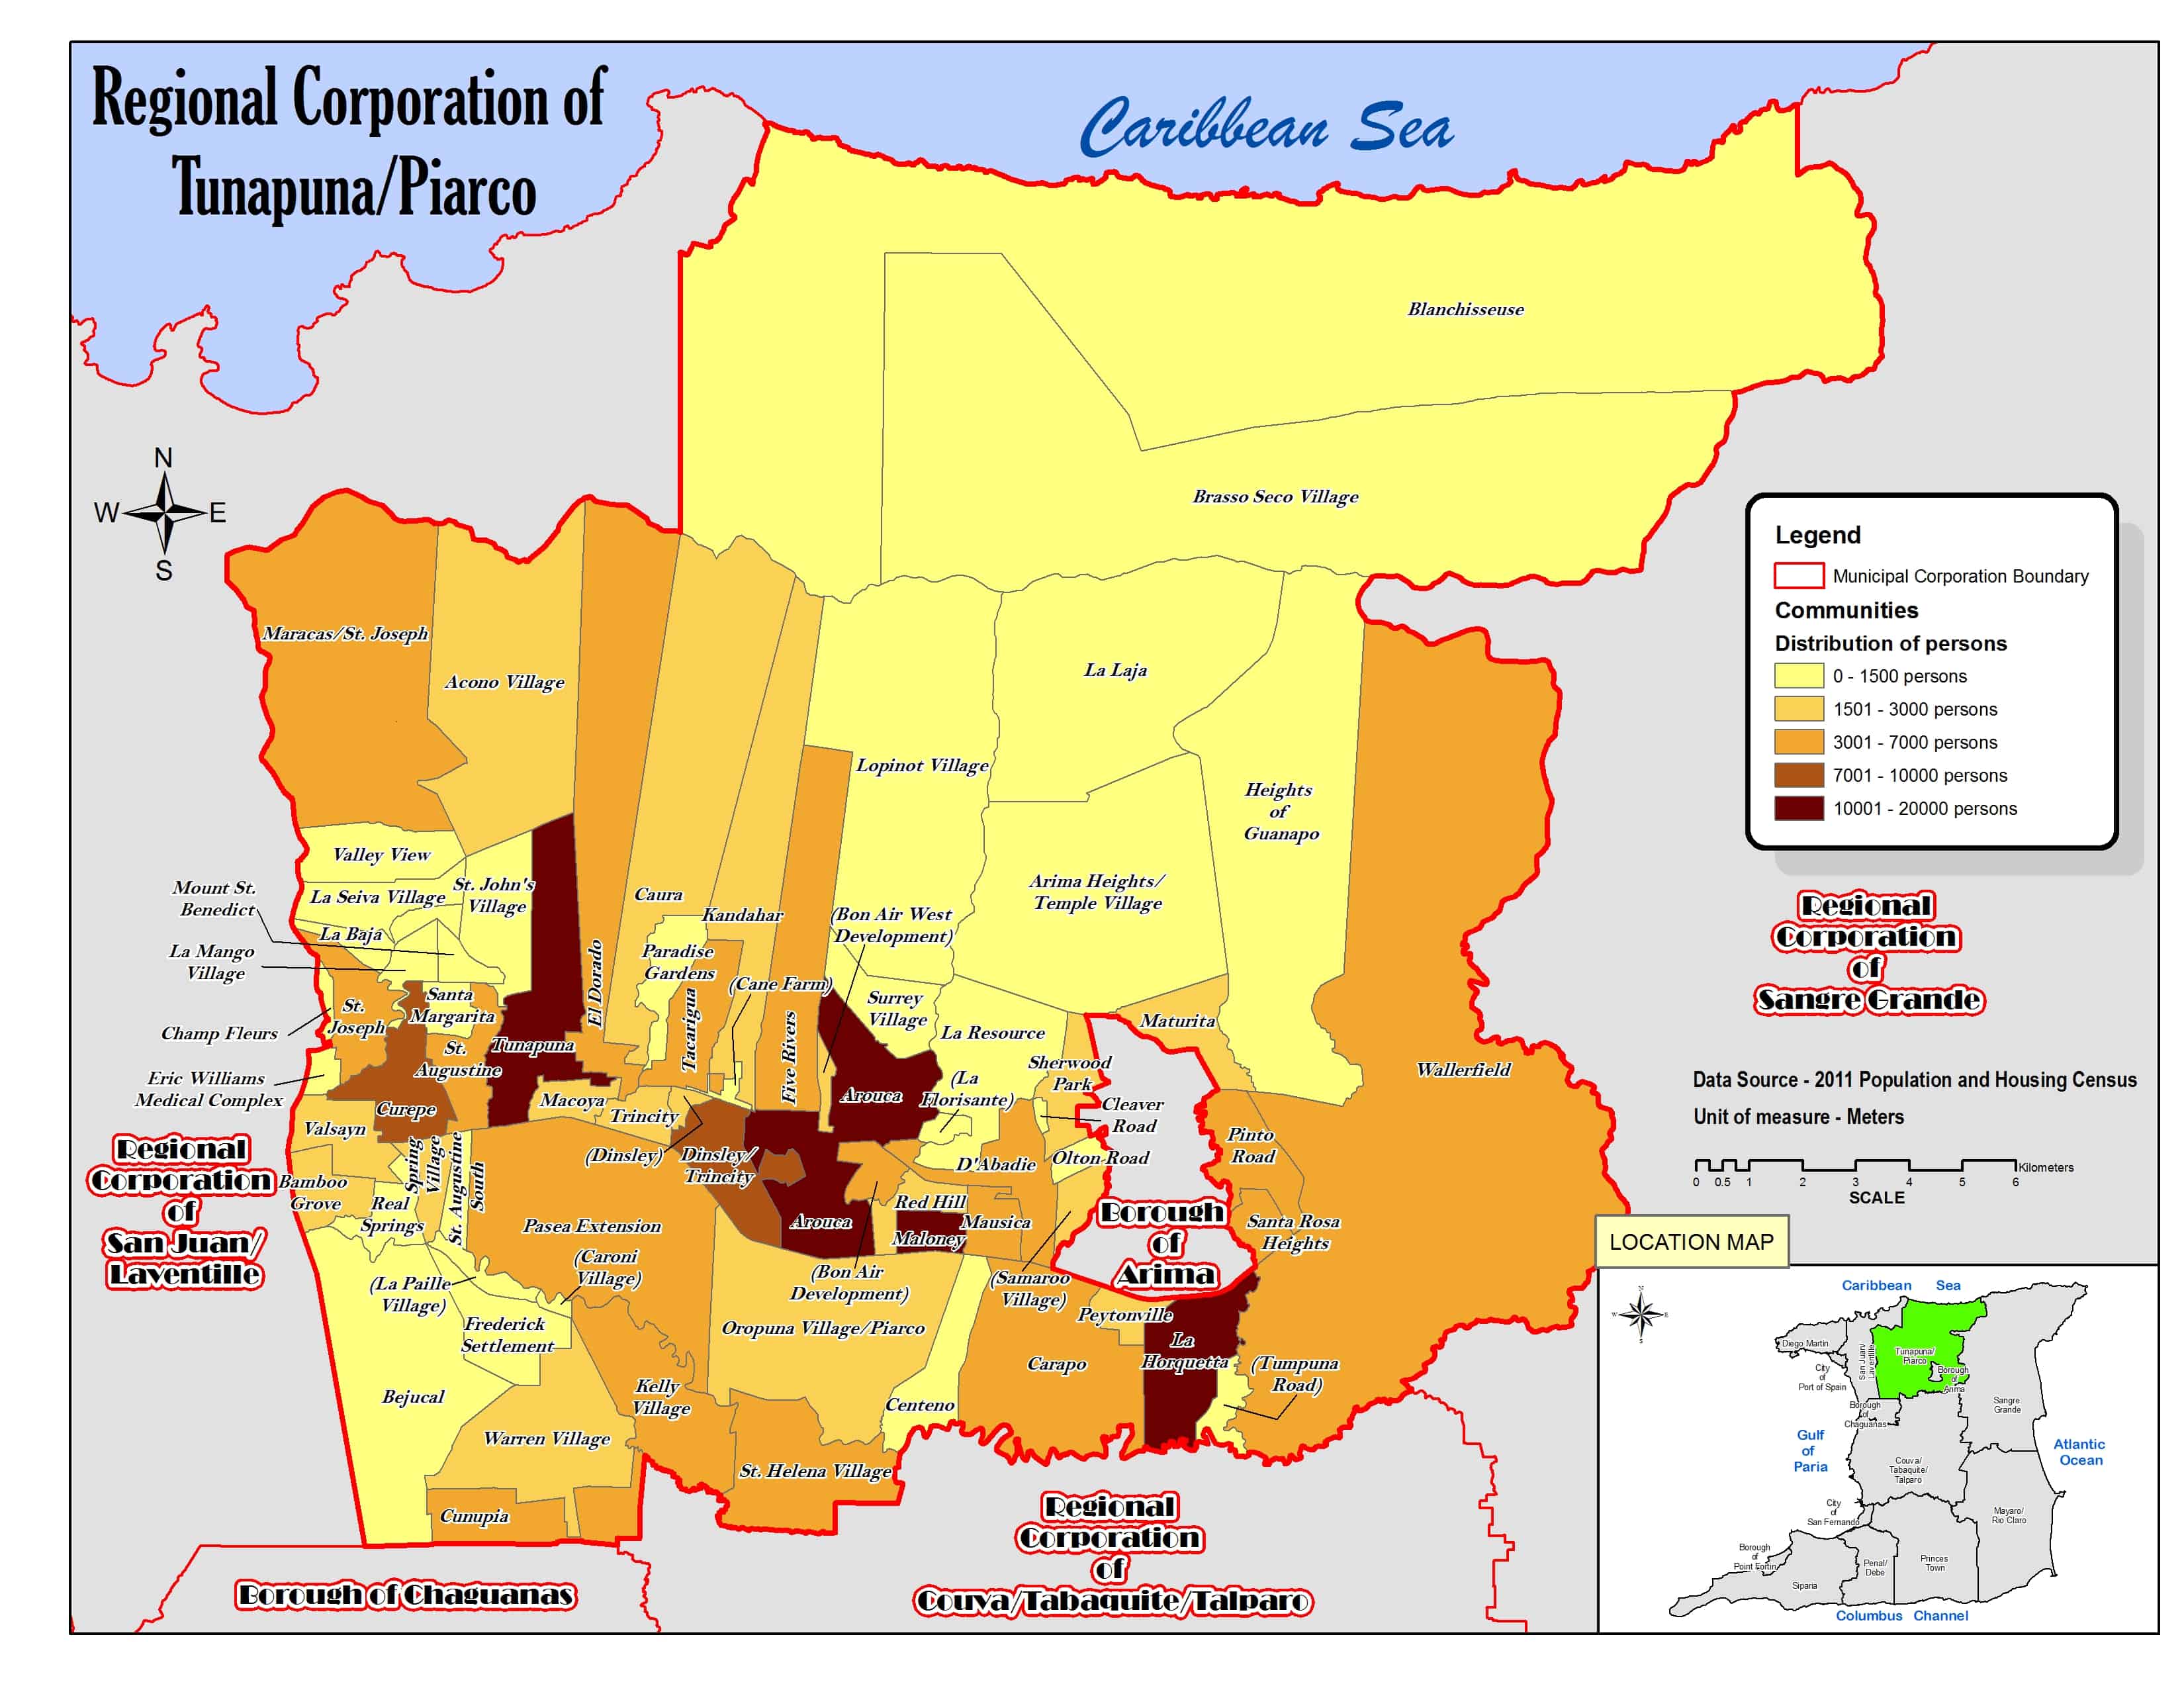
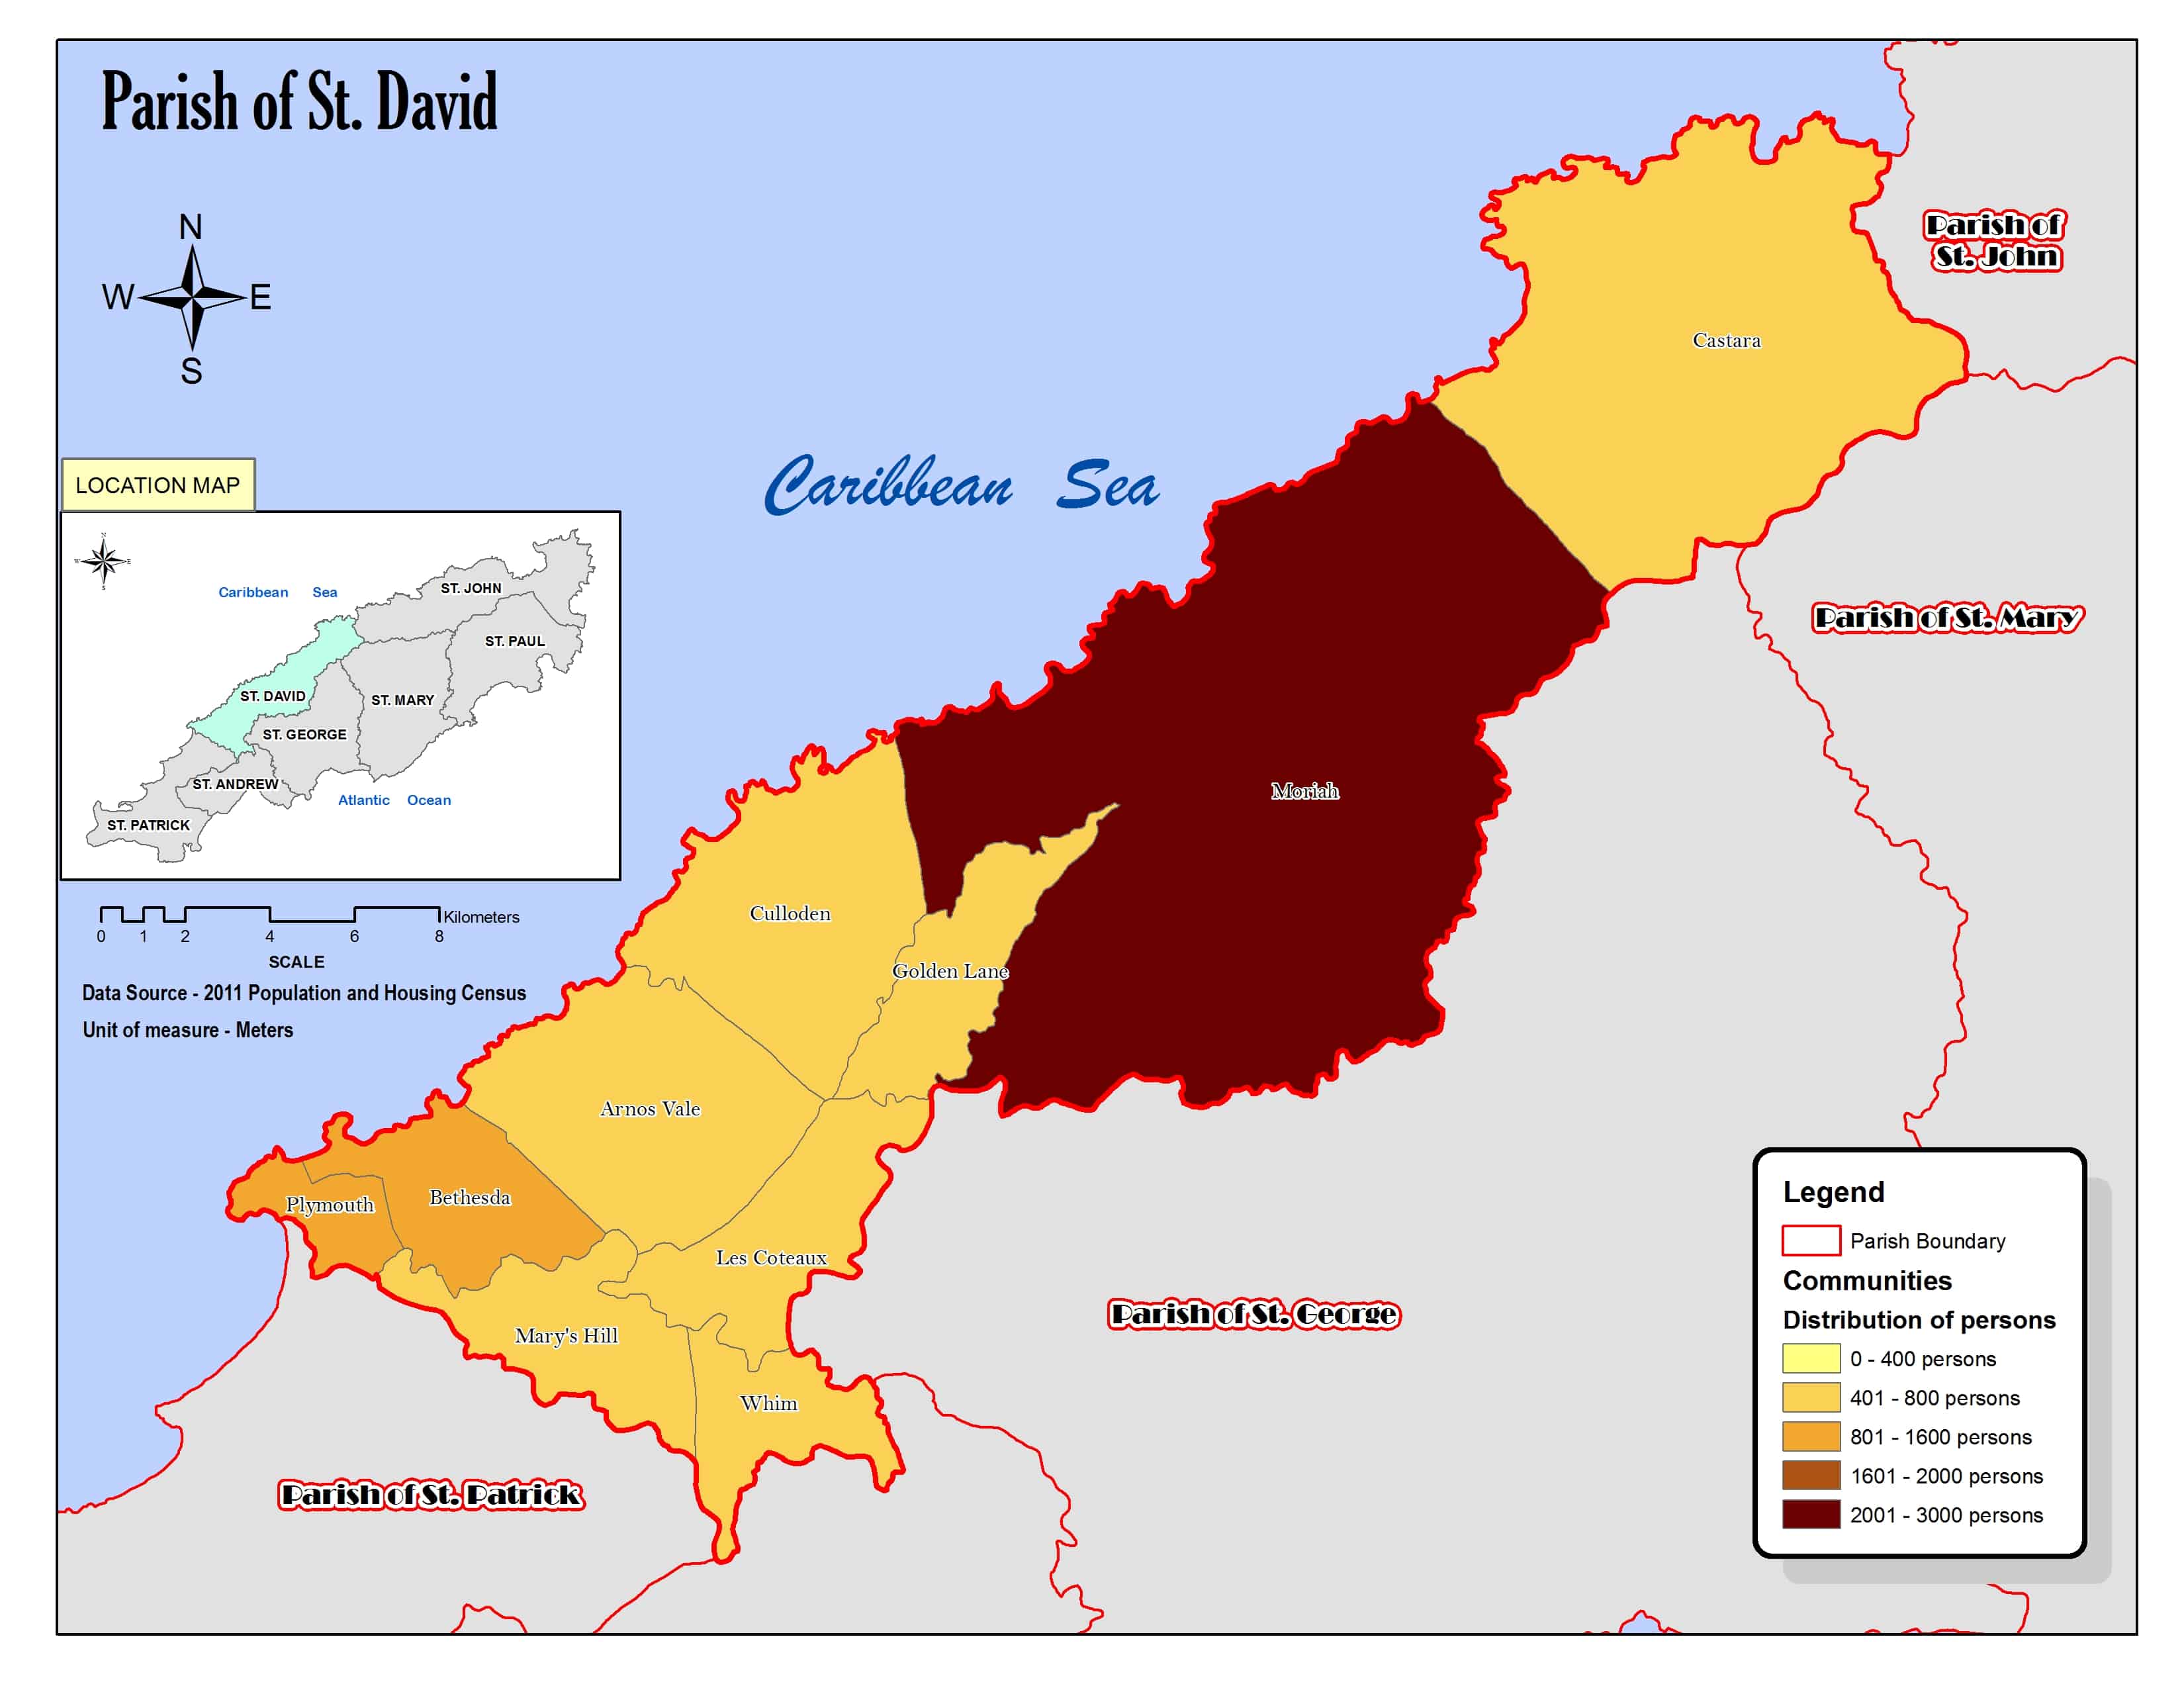
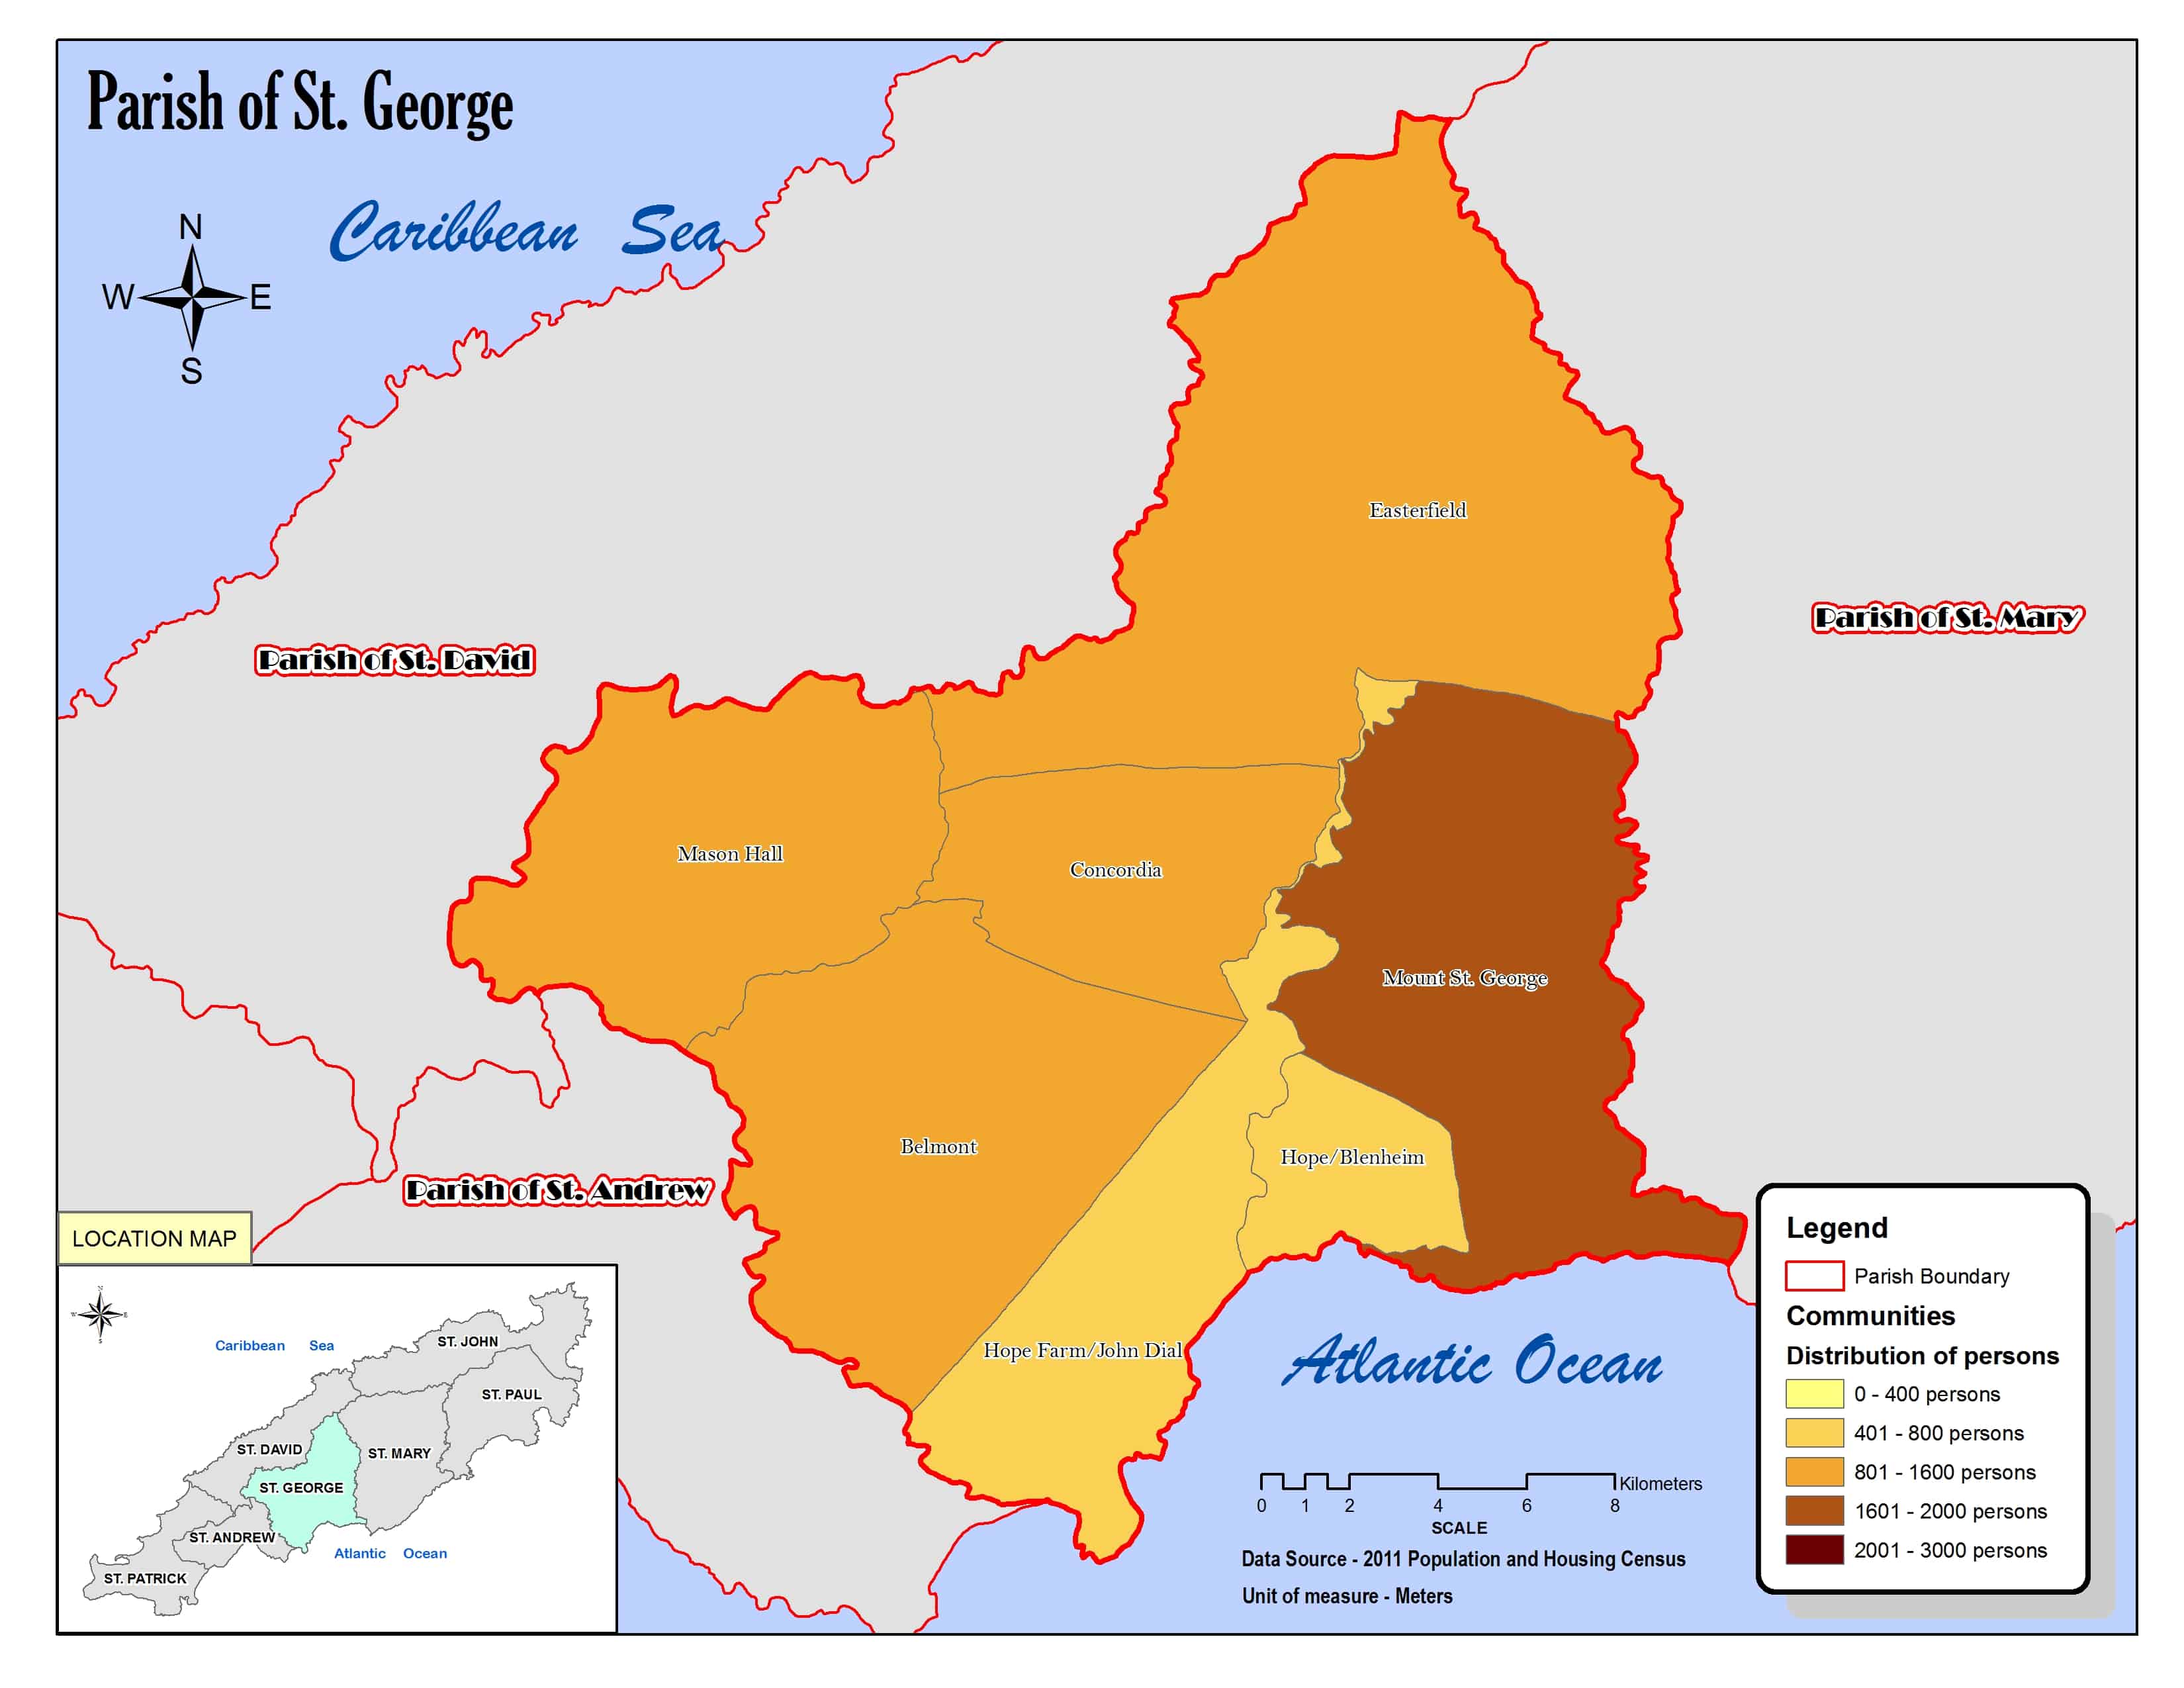
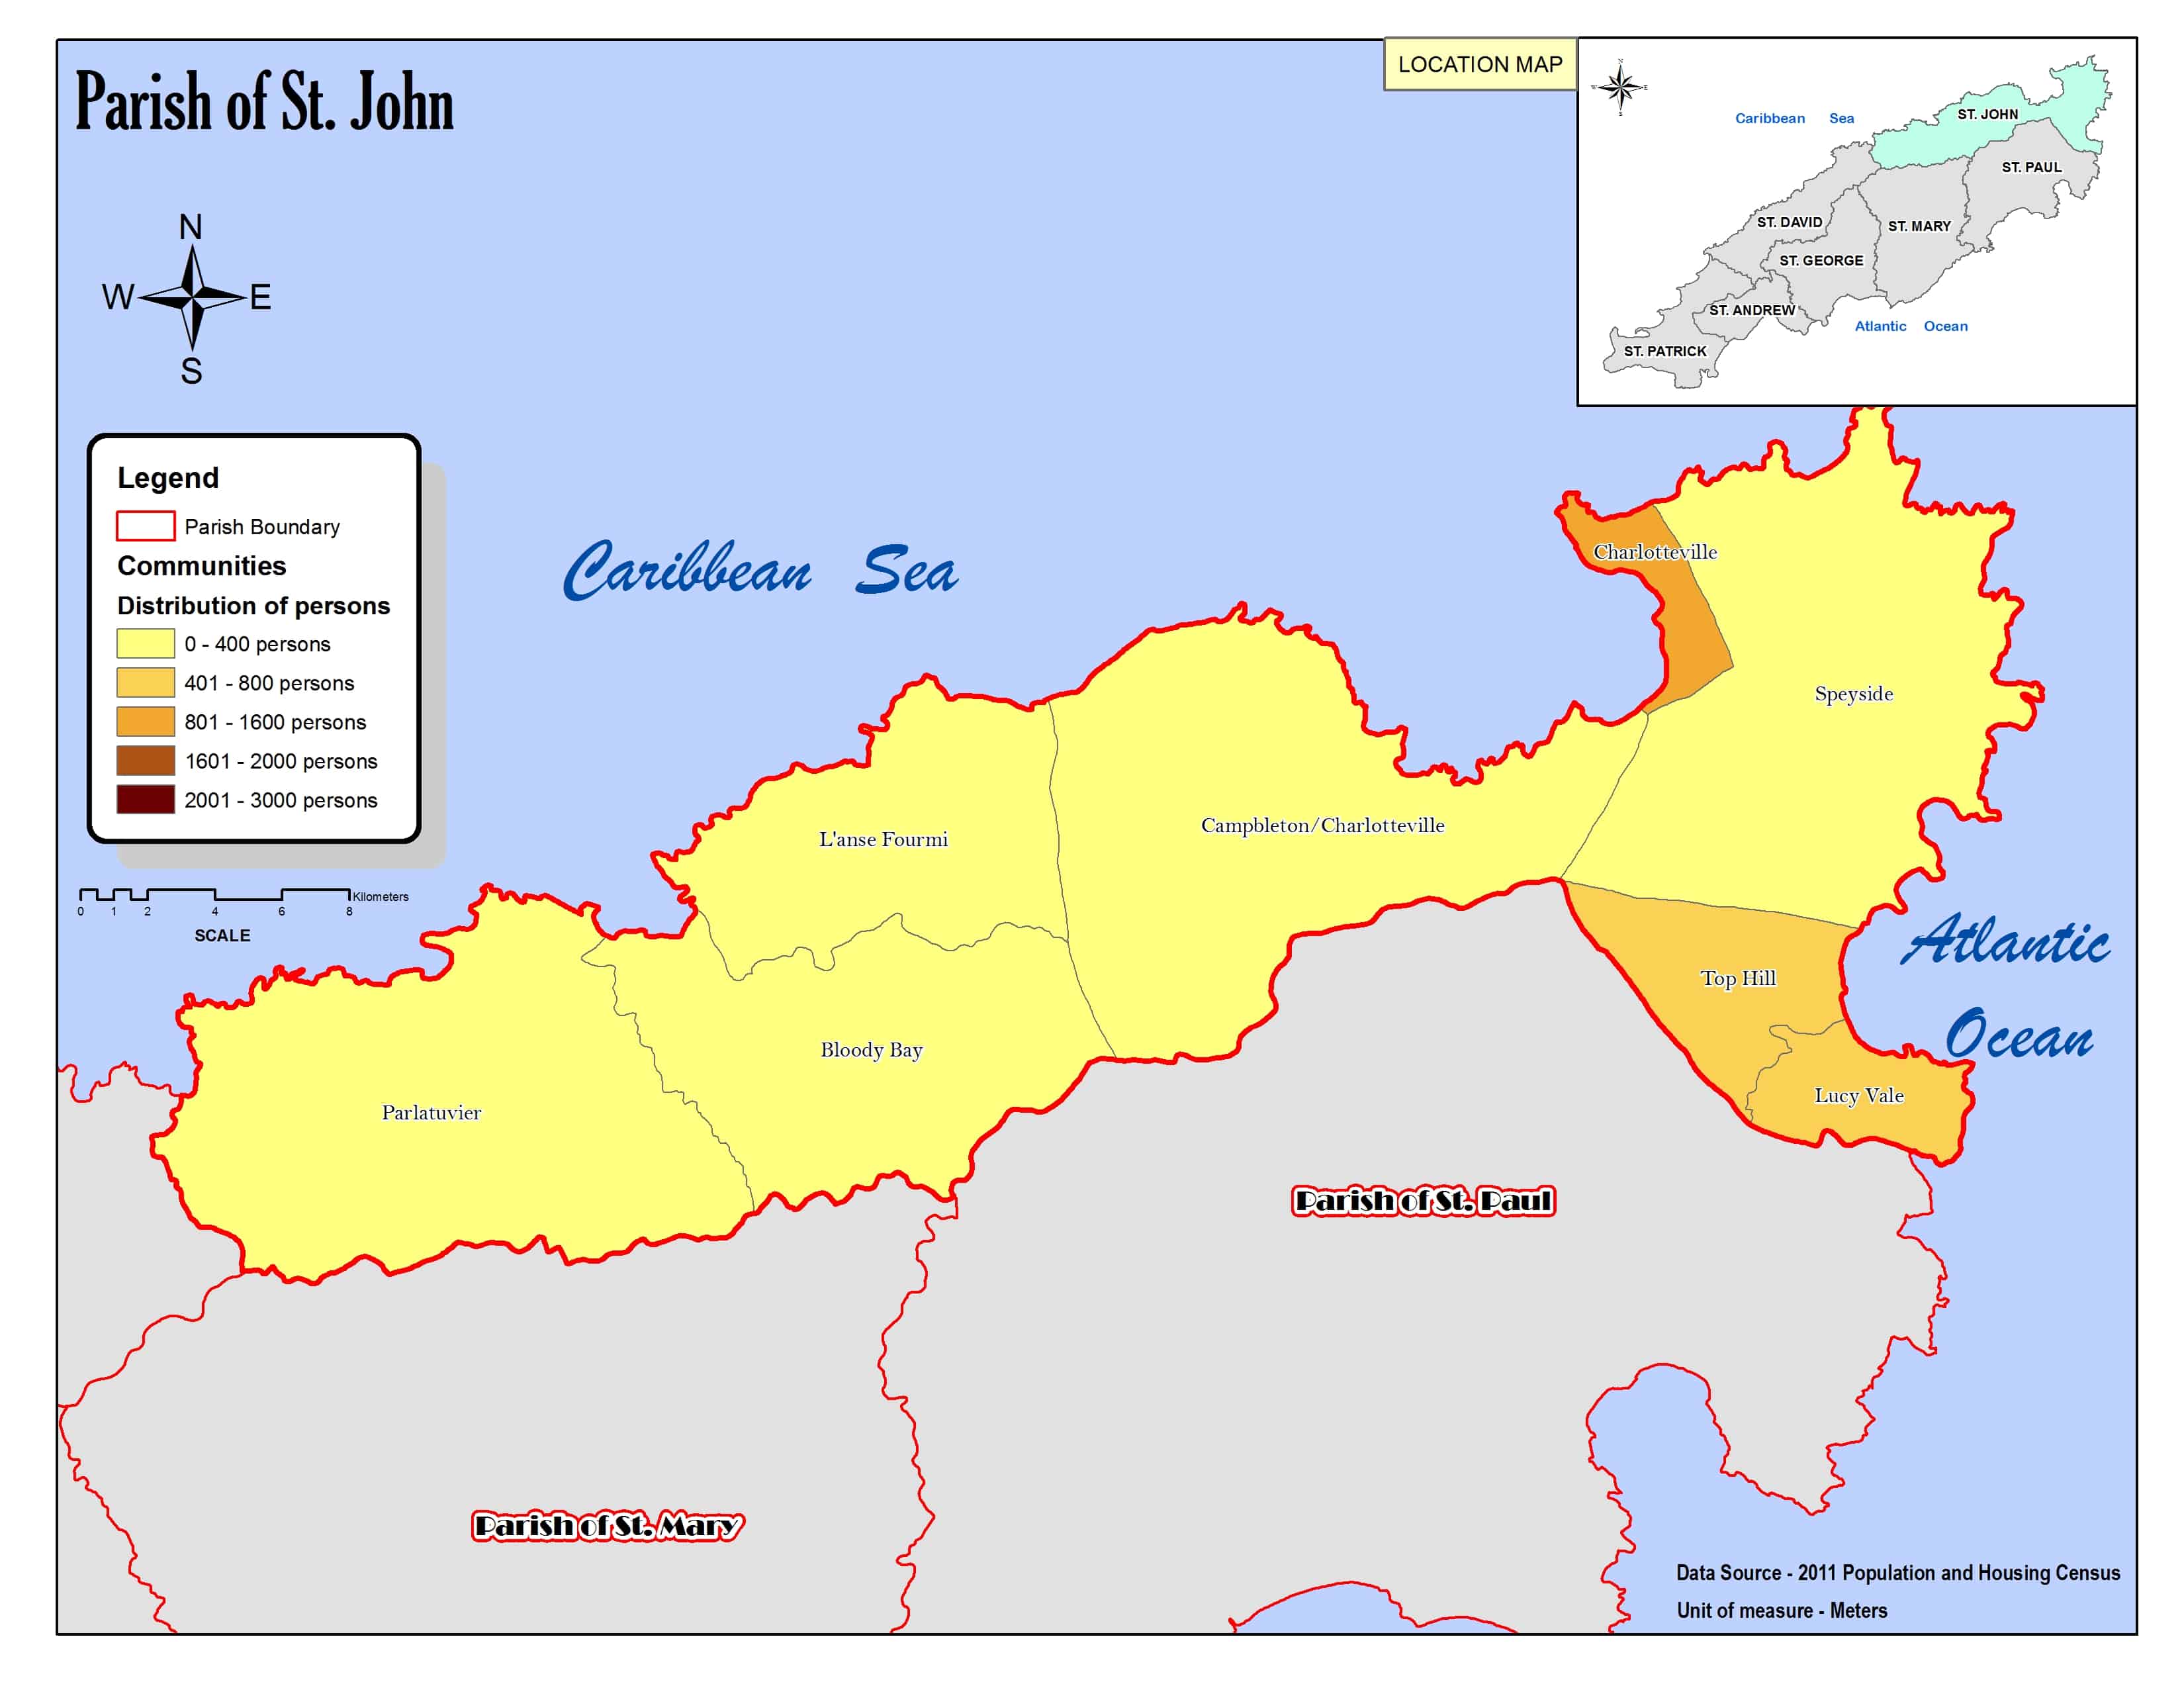
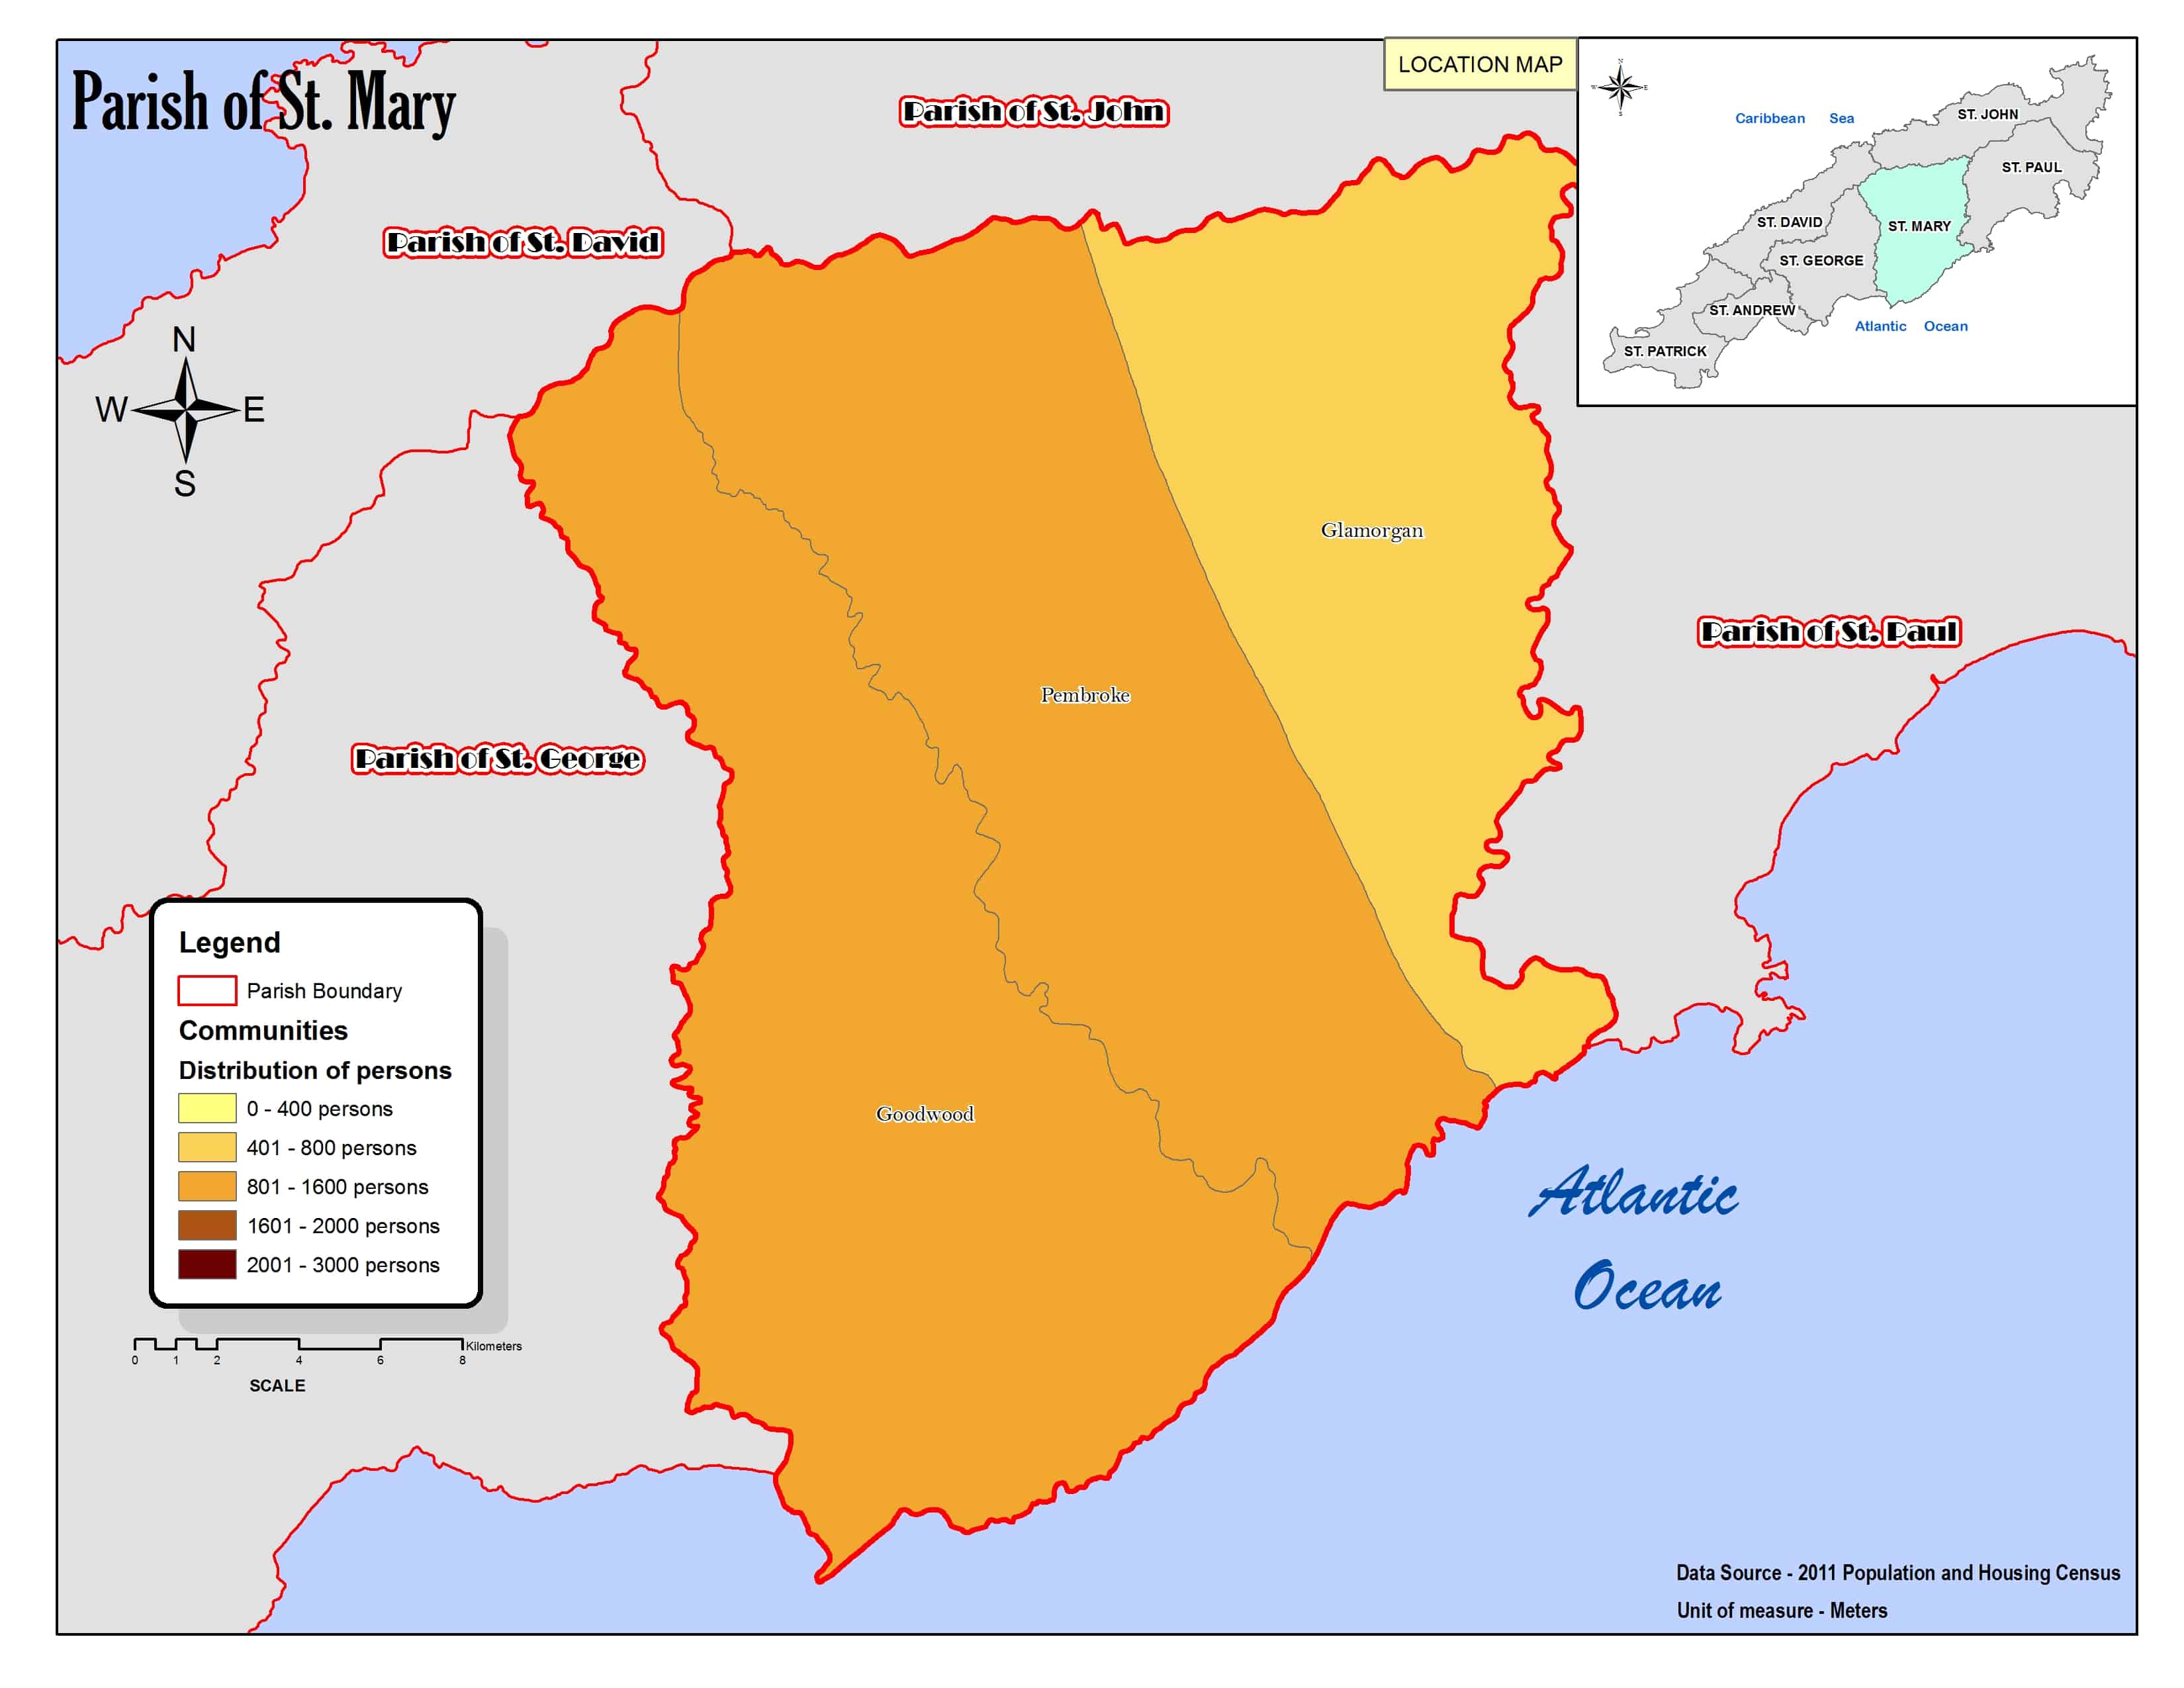
Census Maps
Community Register Maps available for download
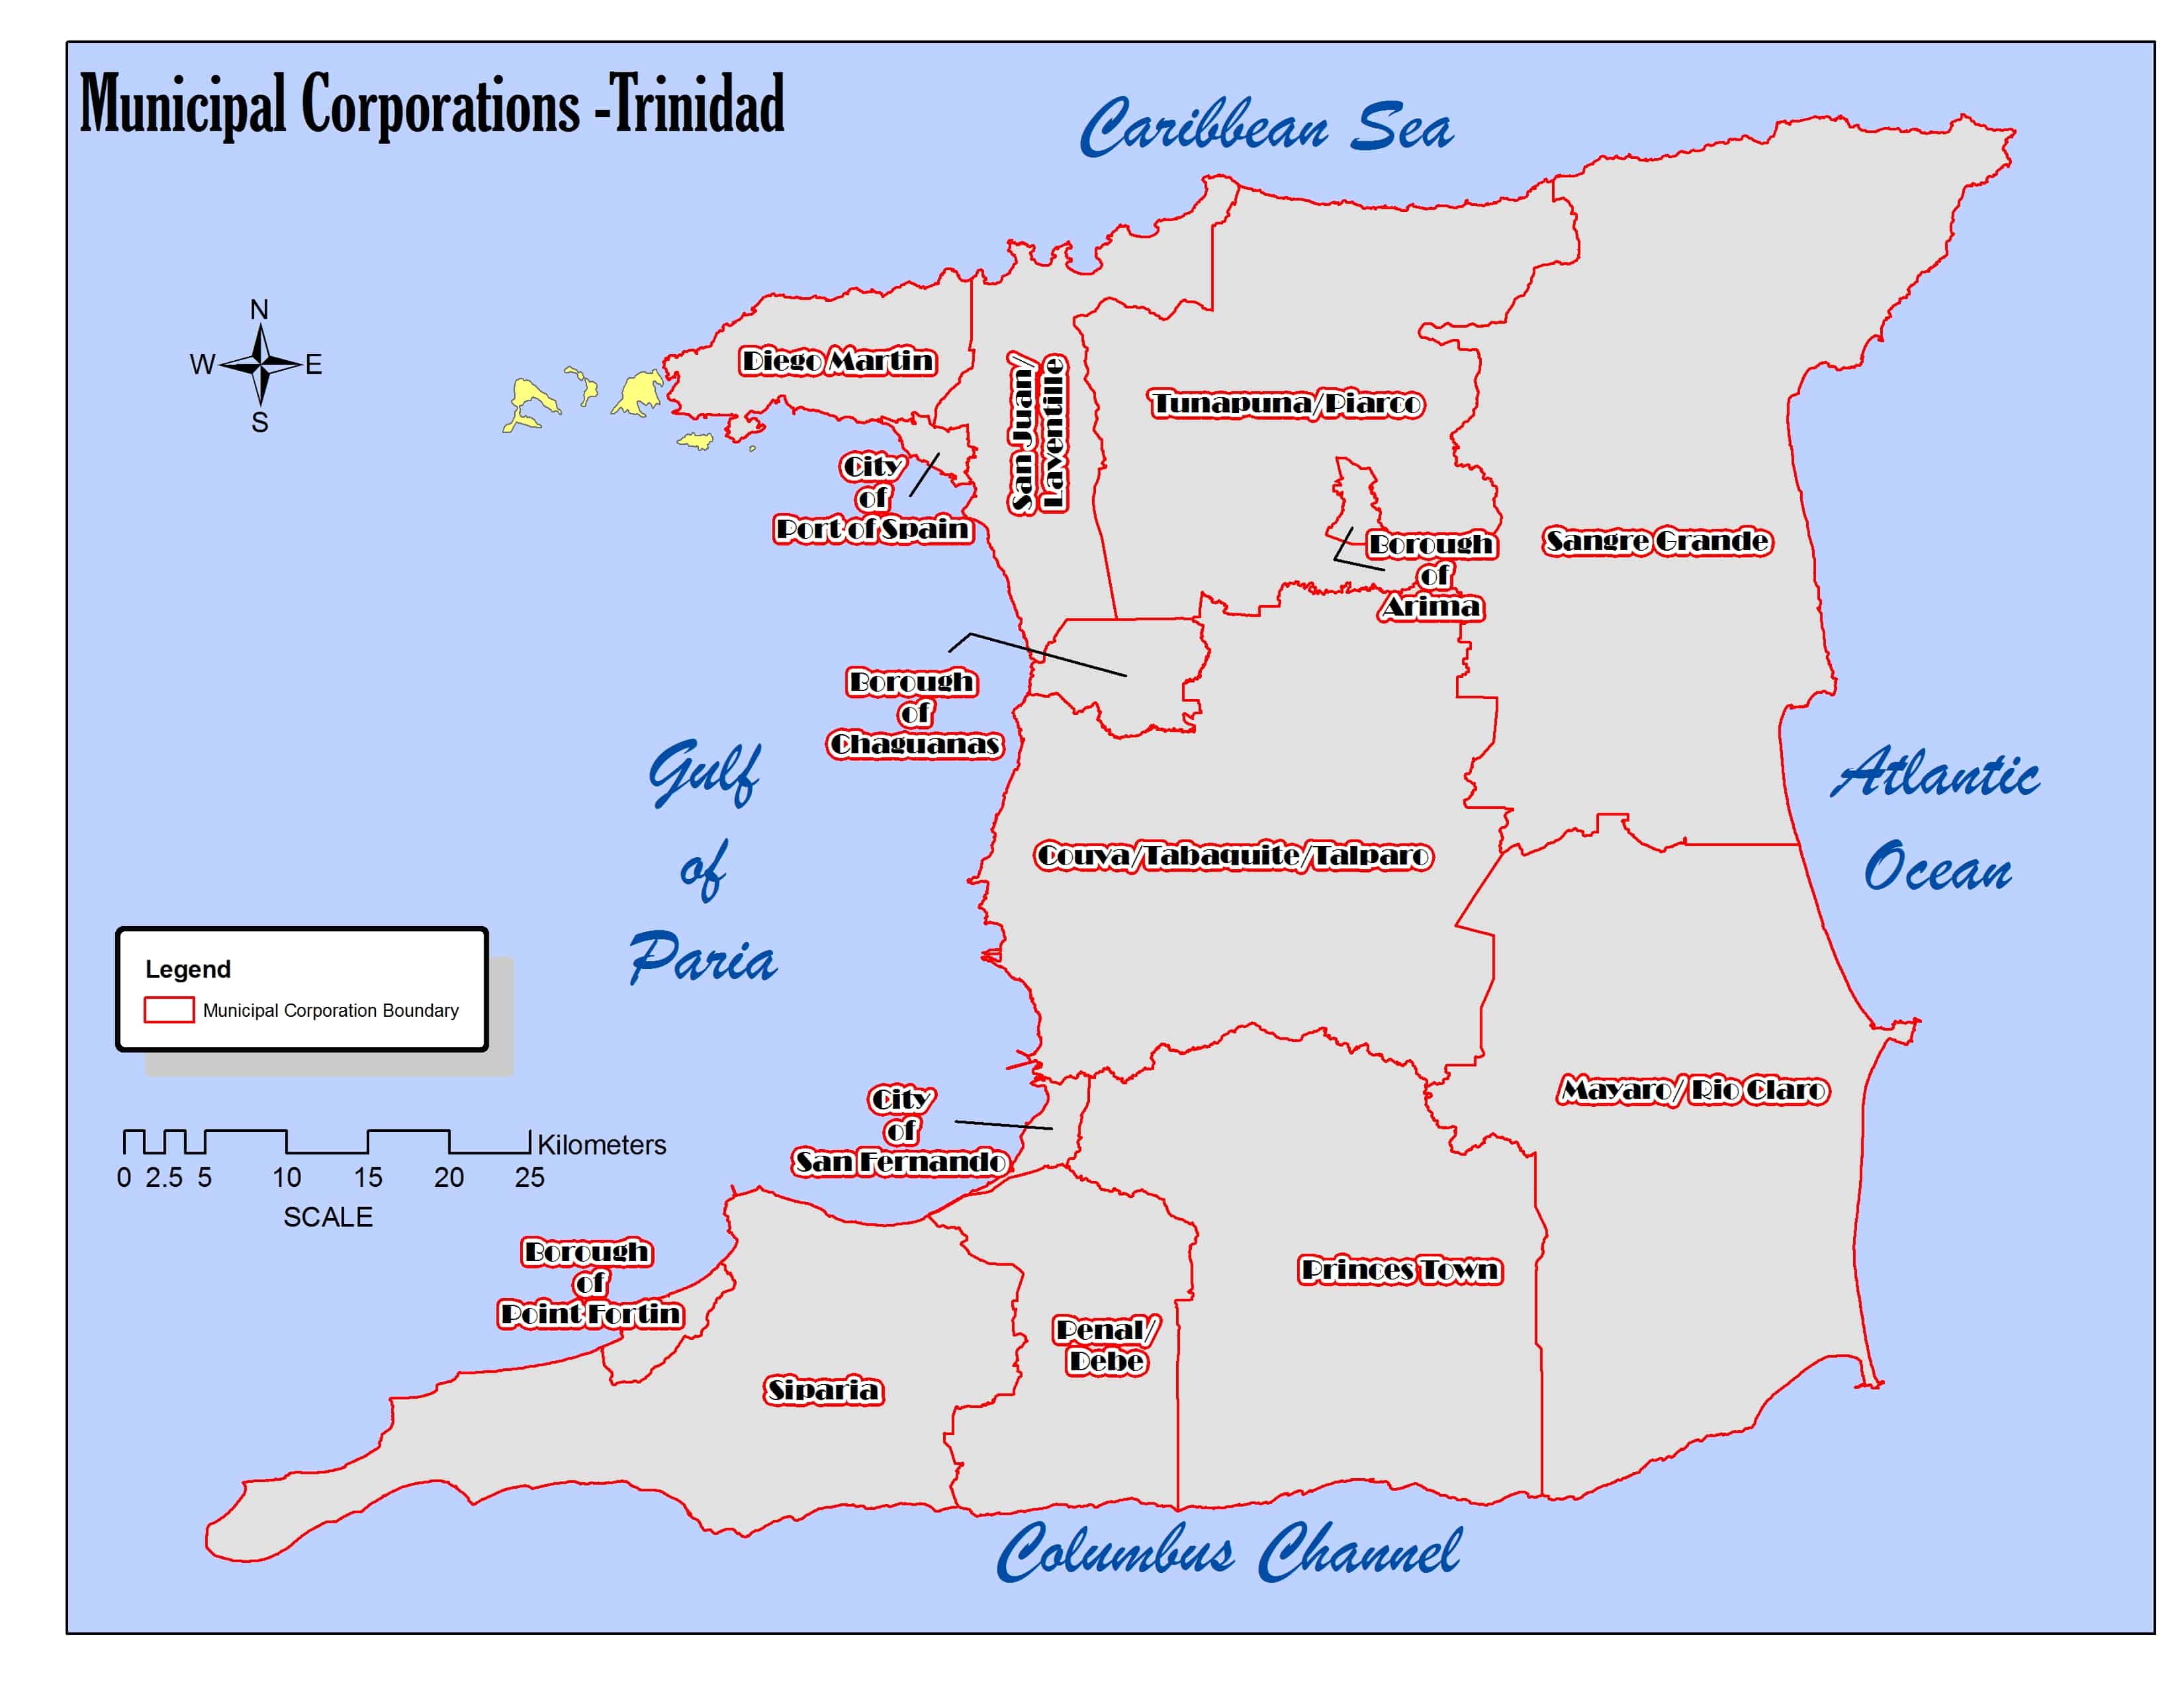
City Corporations

Borough Corporations
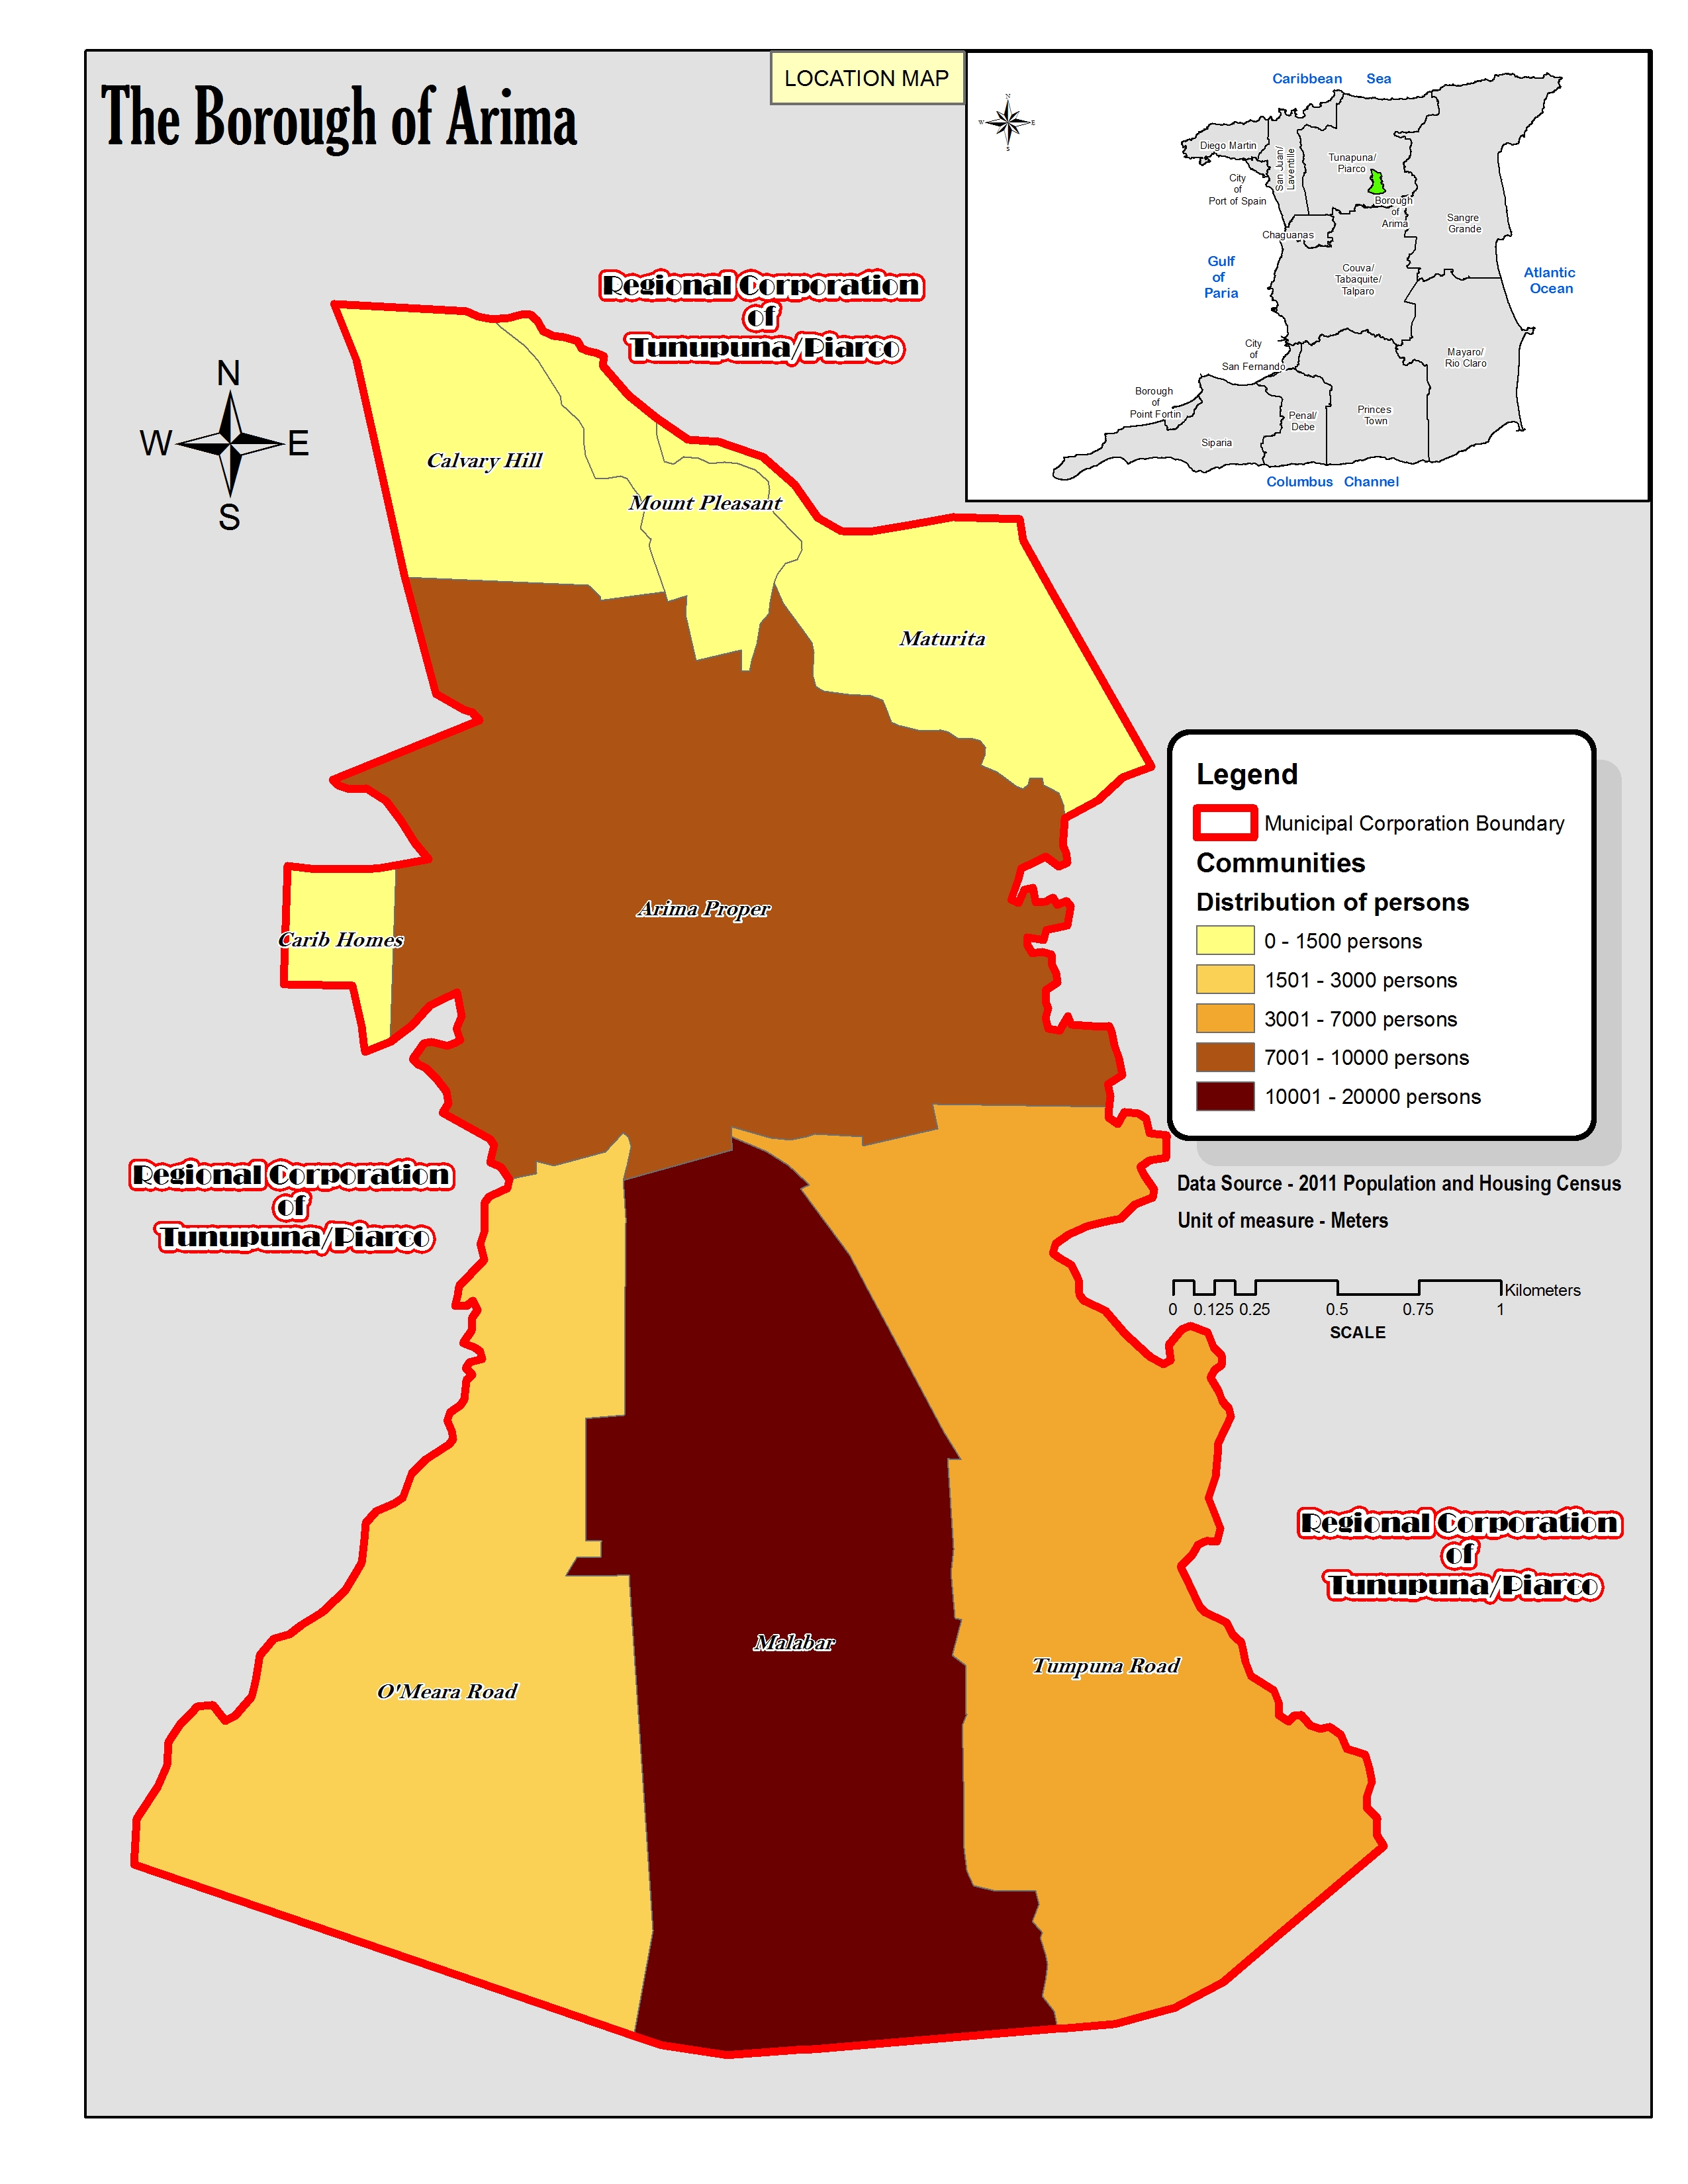 Arima
Arima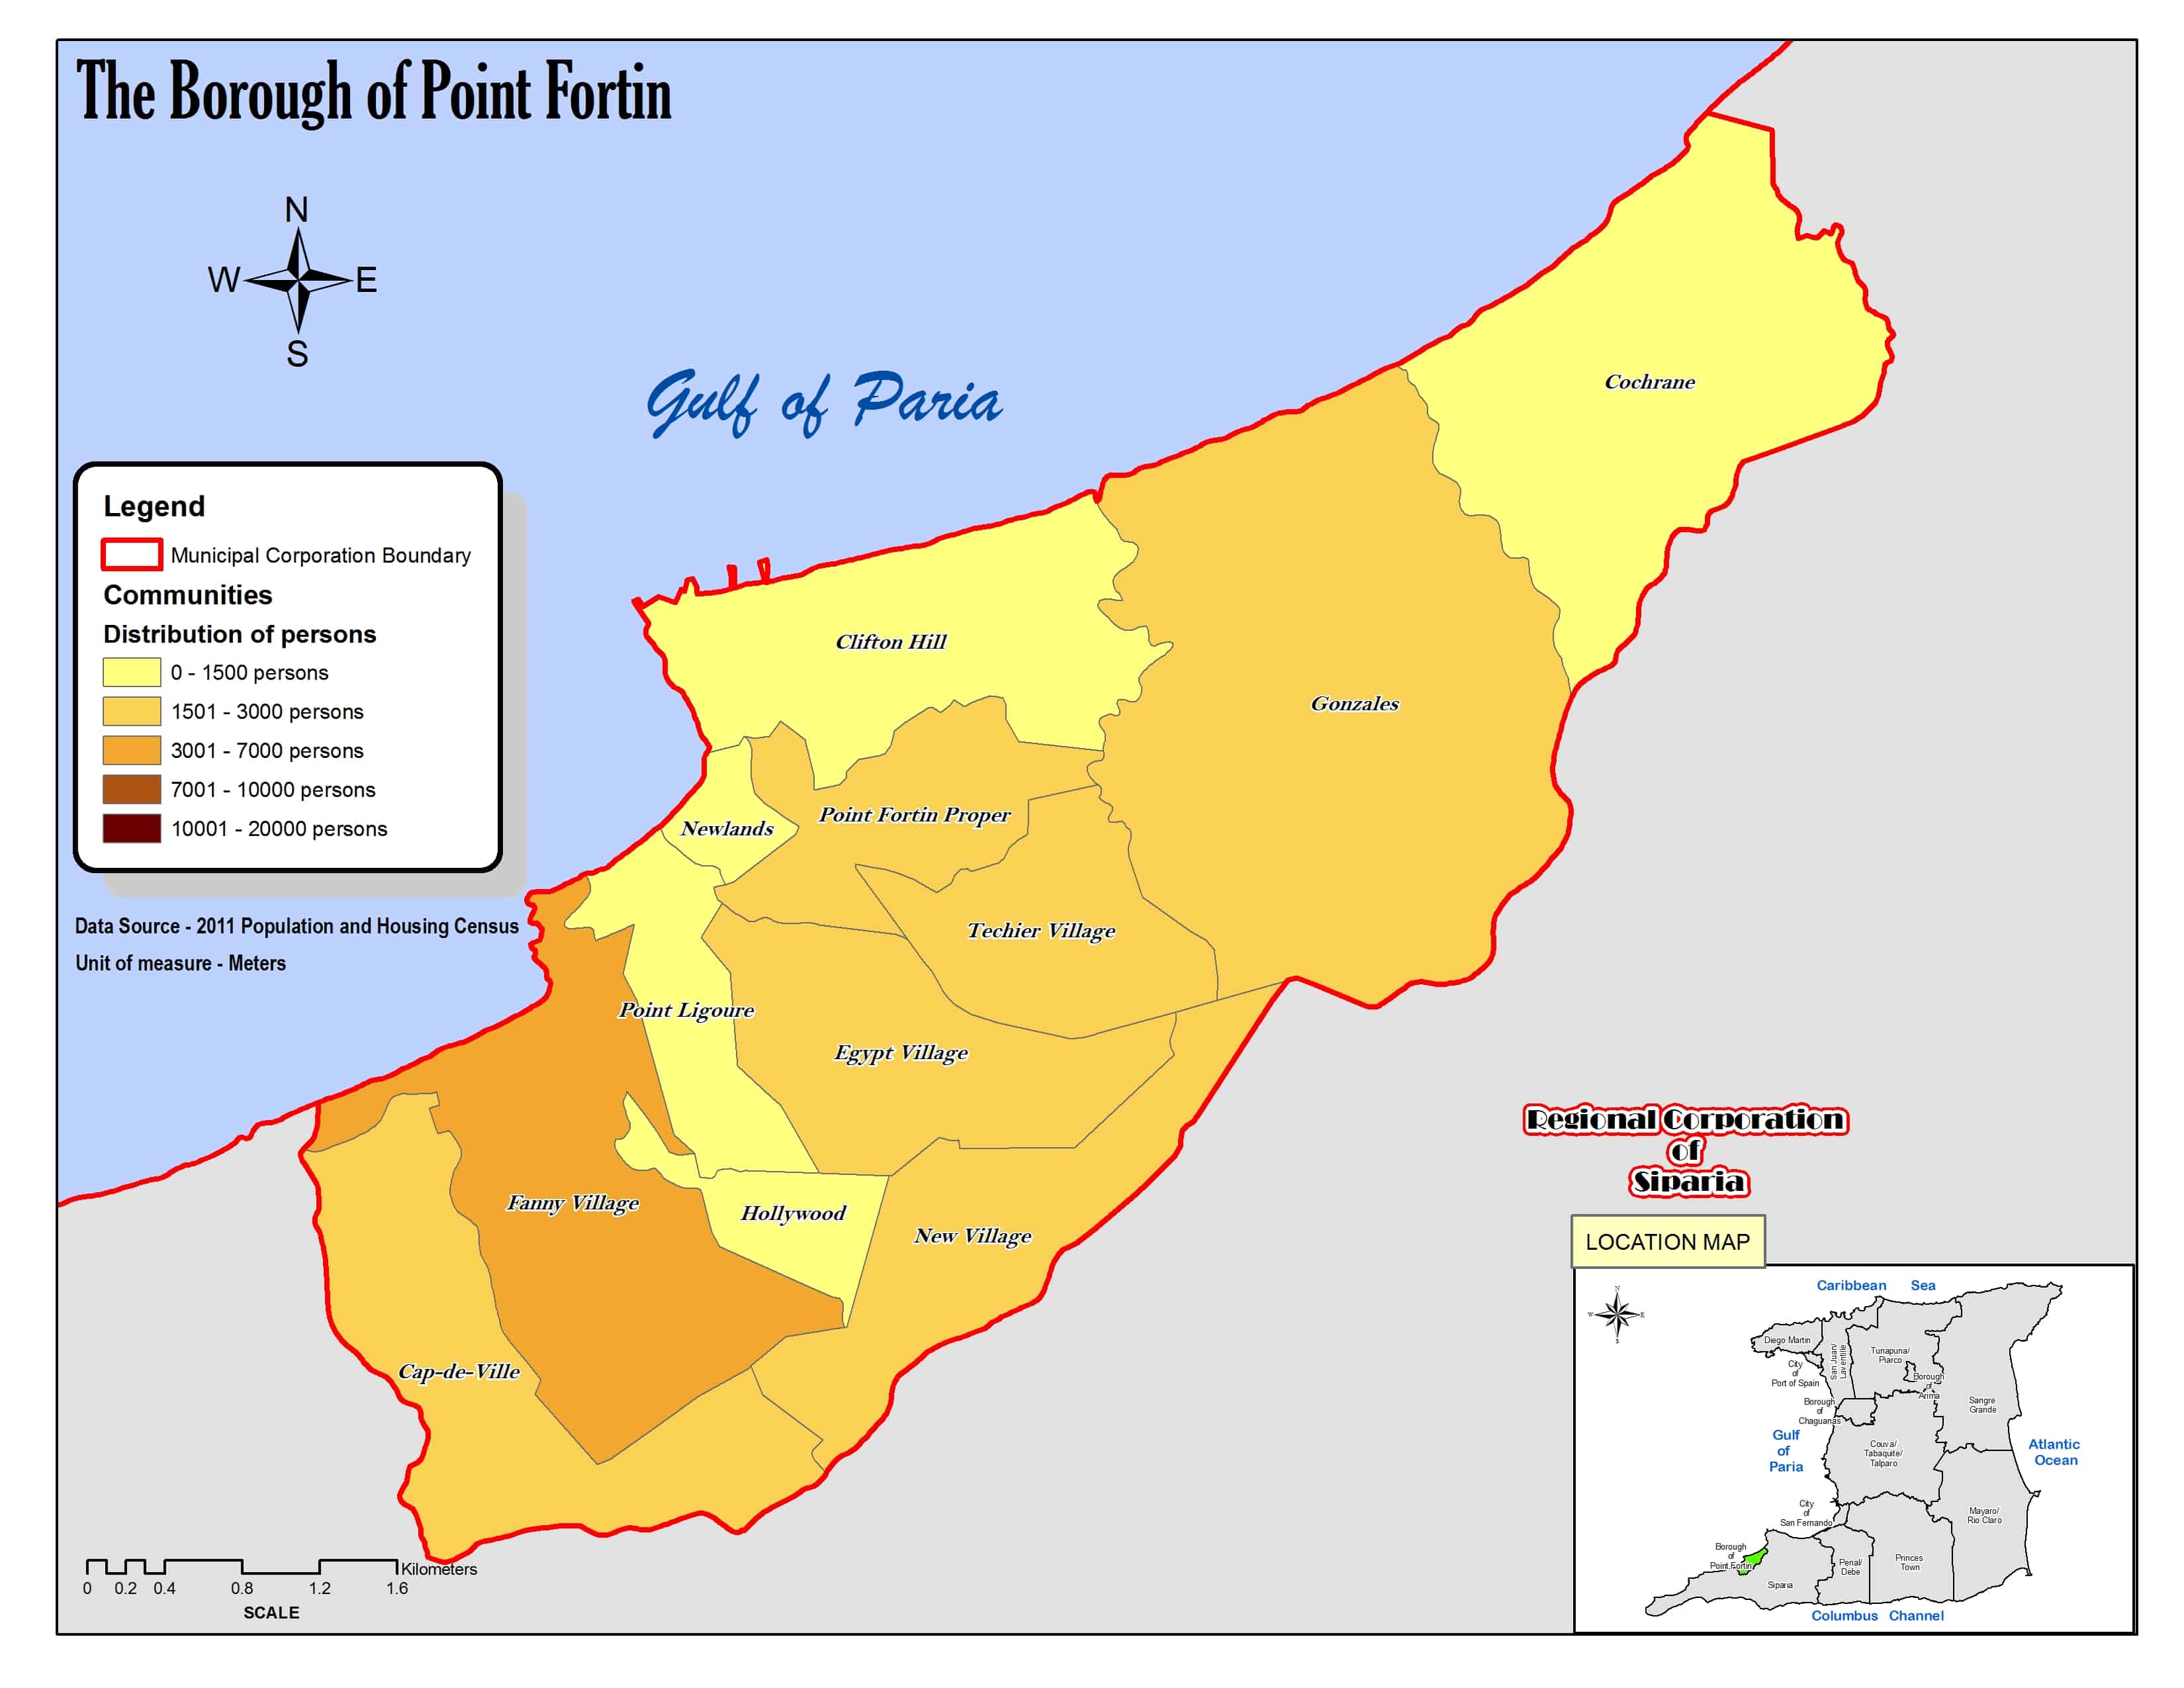
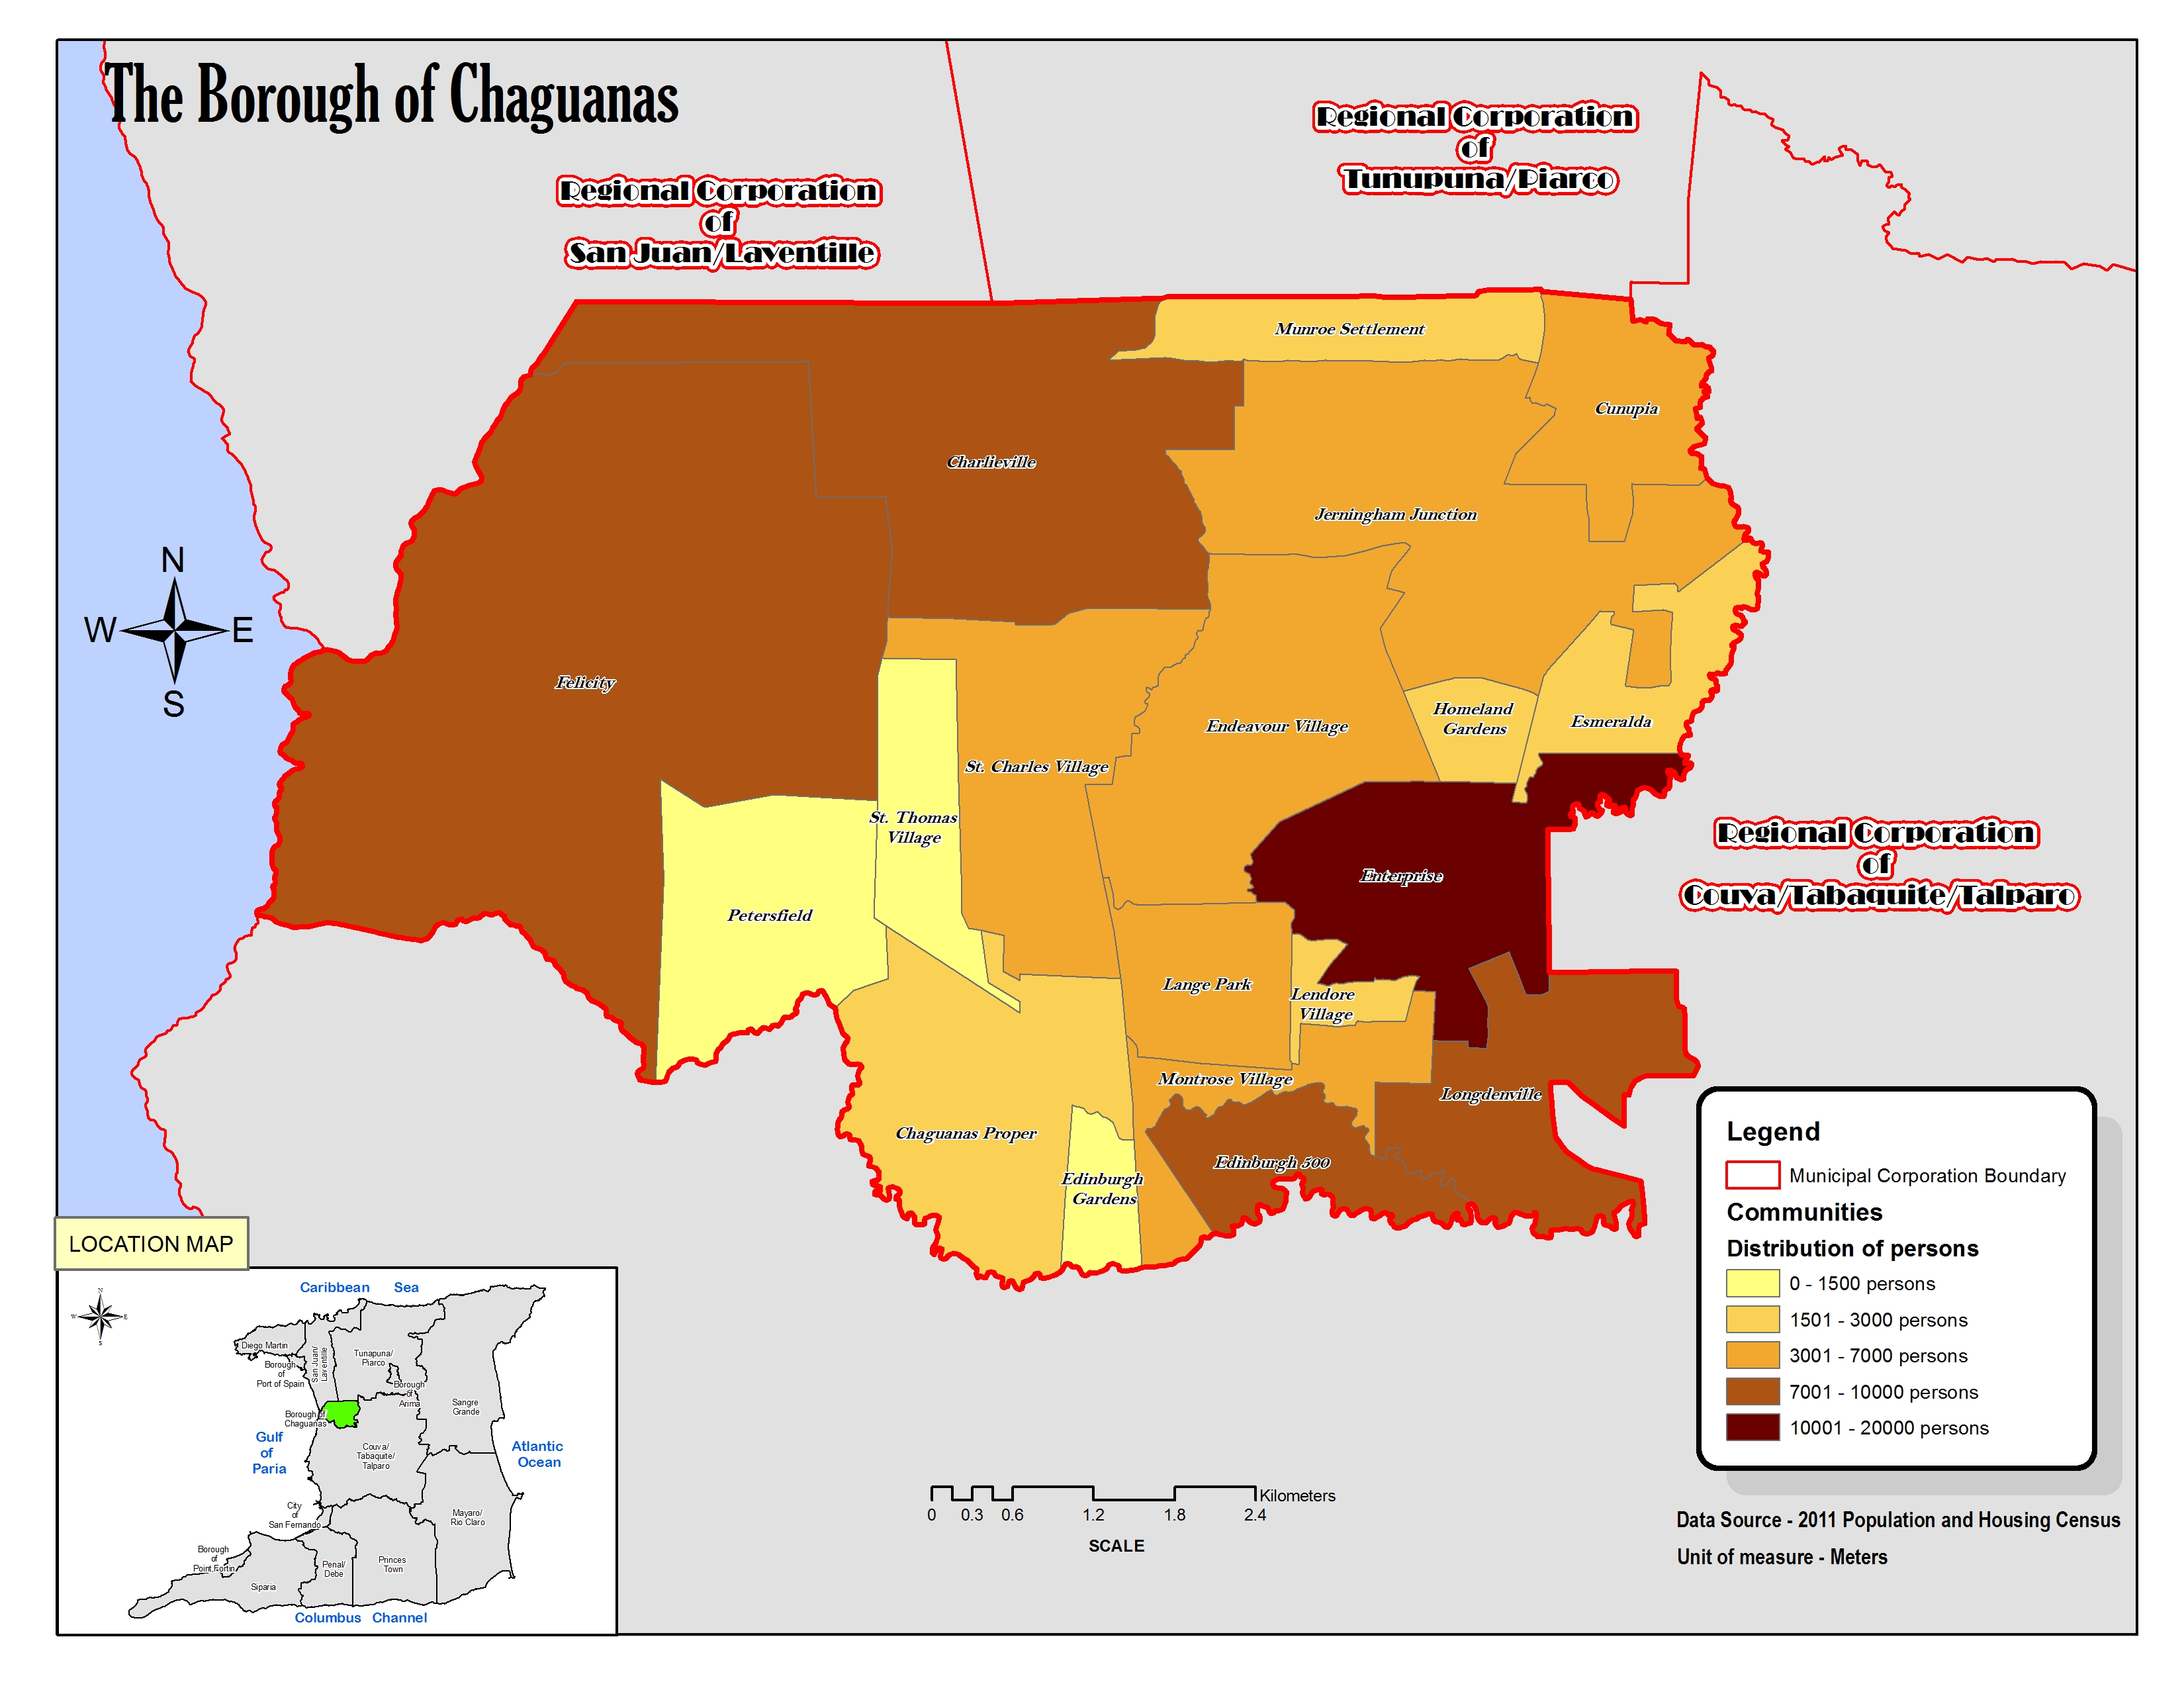 Chaguanas
Regional Corporations
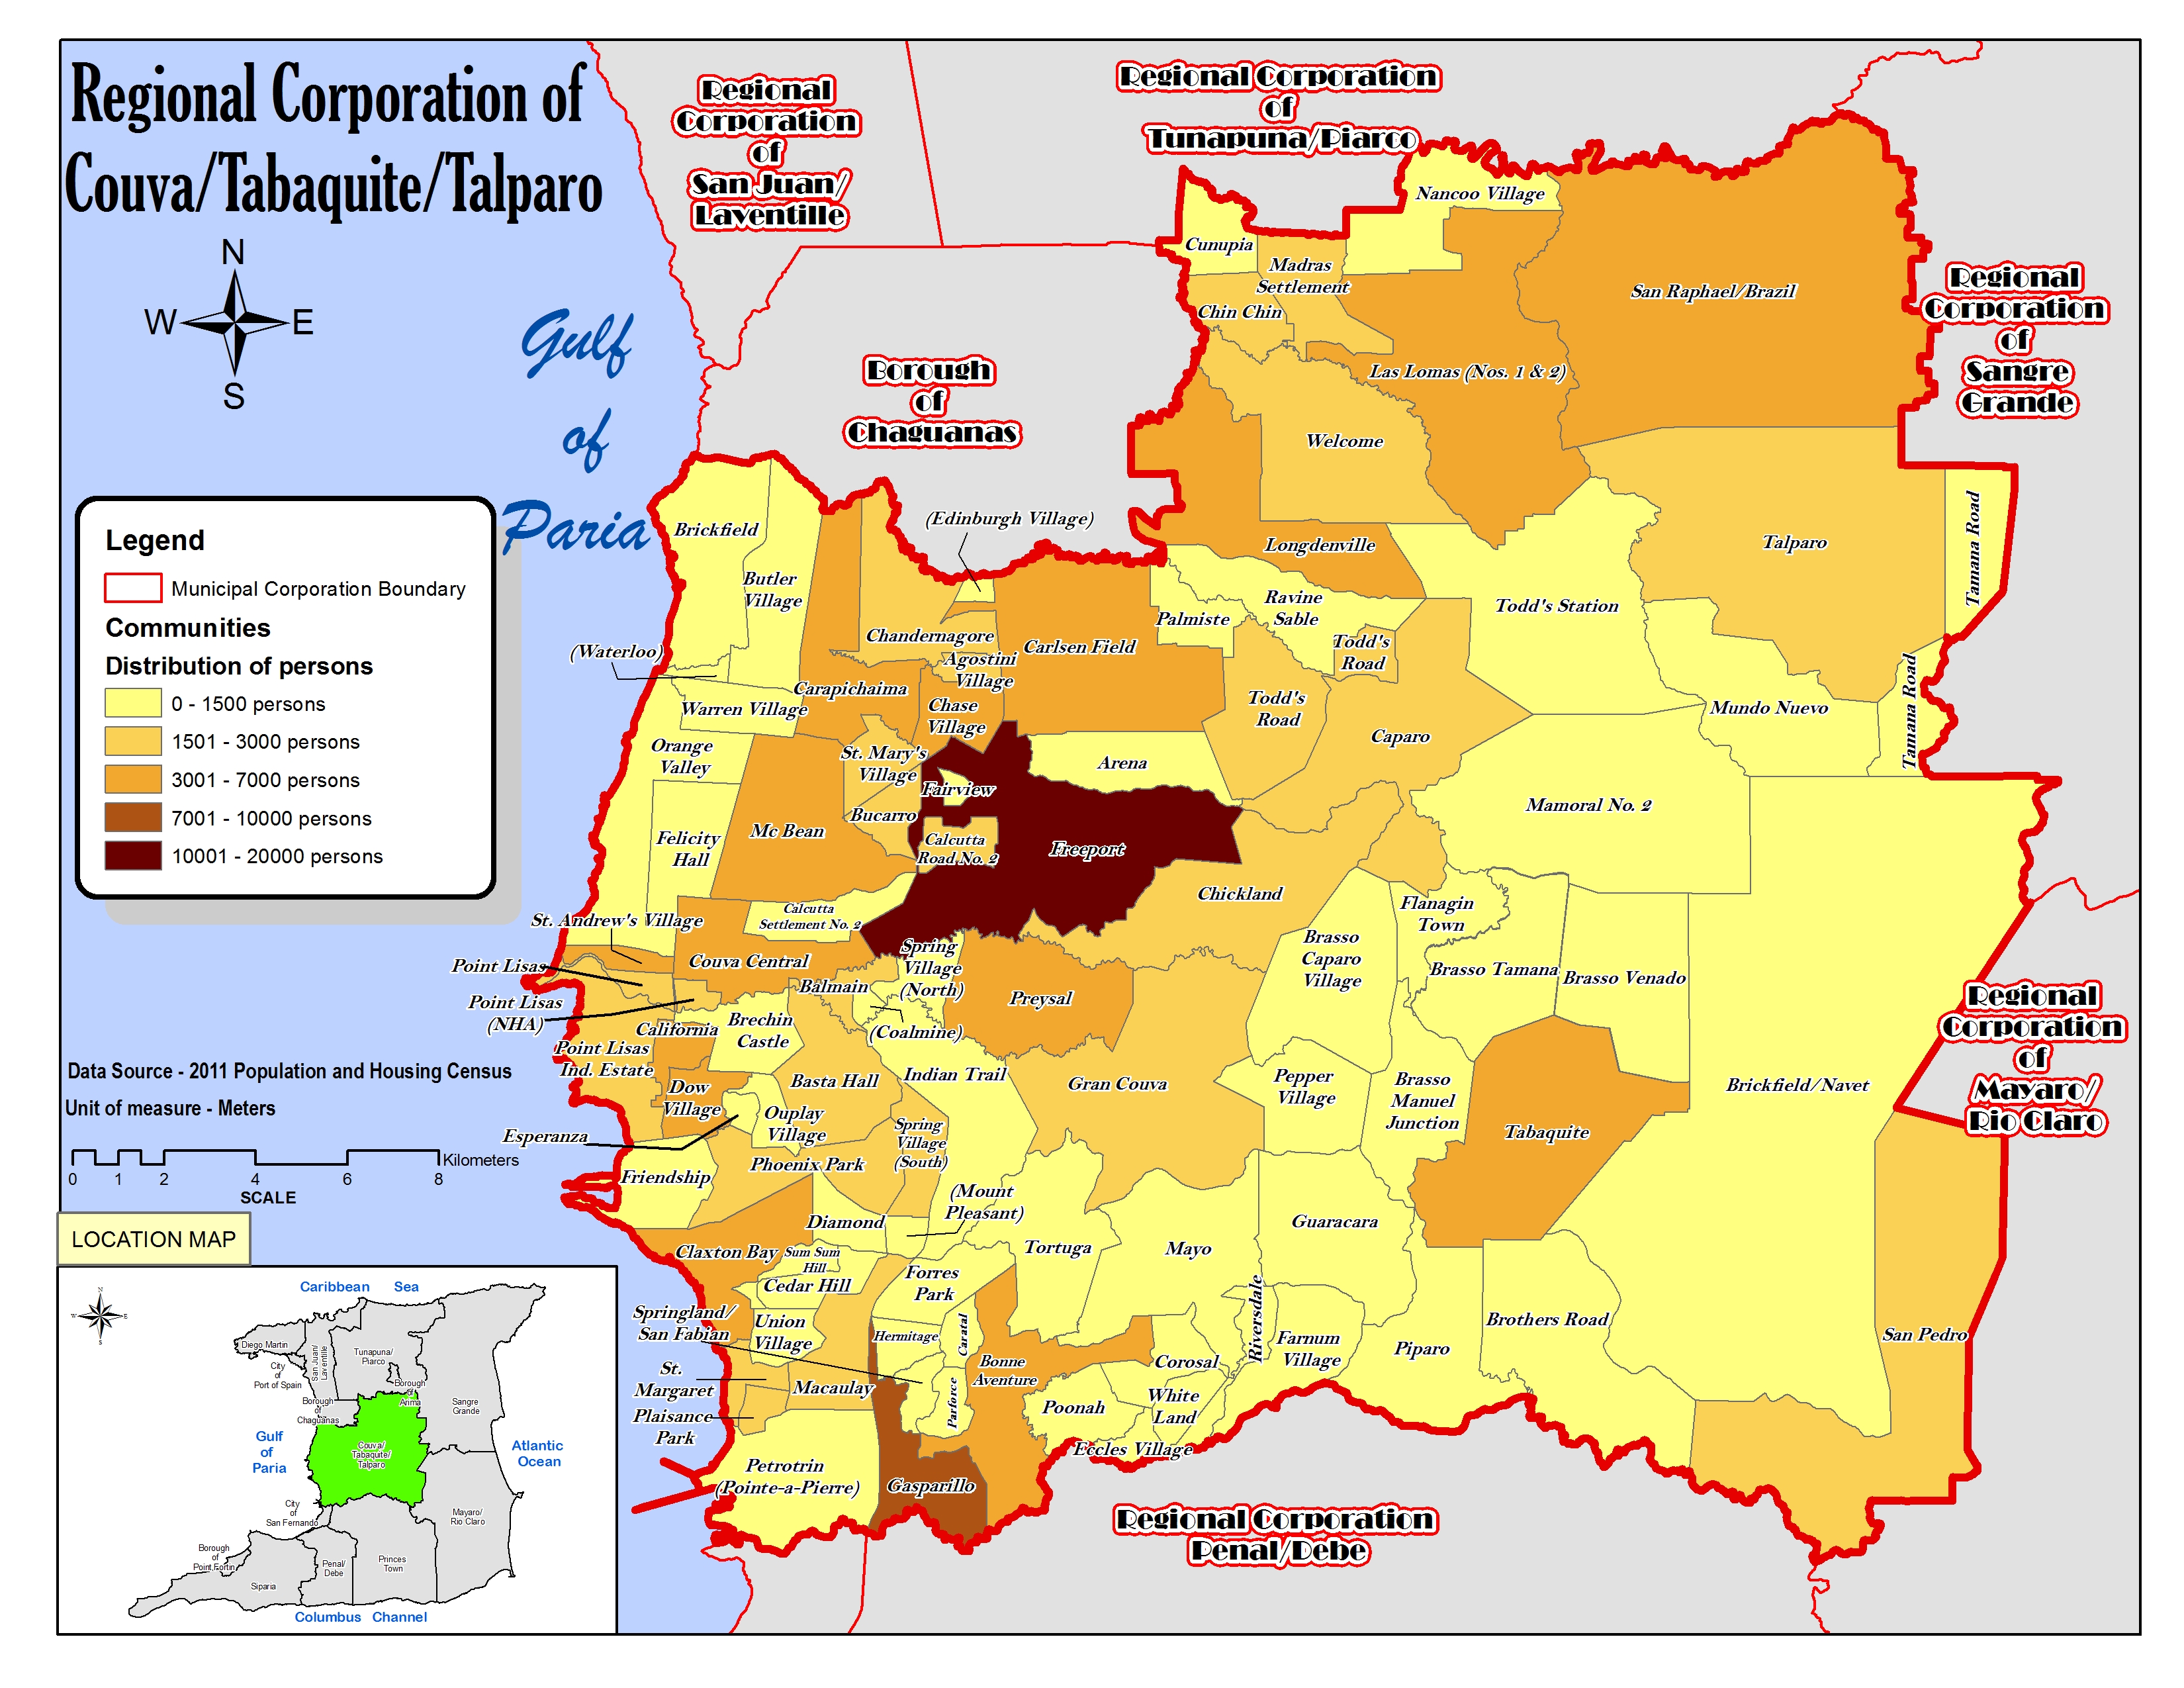 Couva/Tabaquite/Talparo
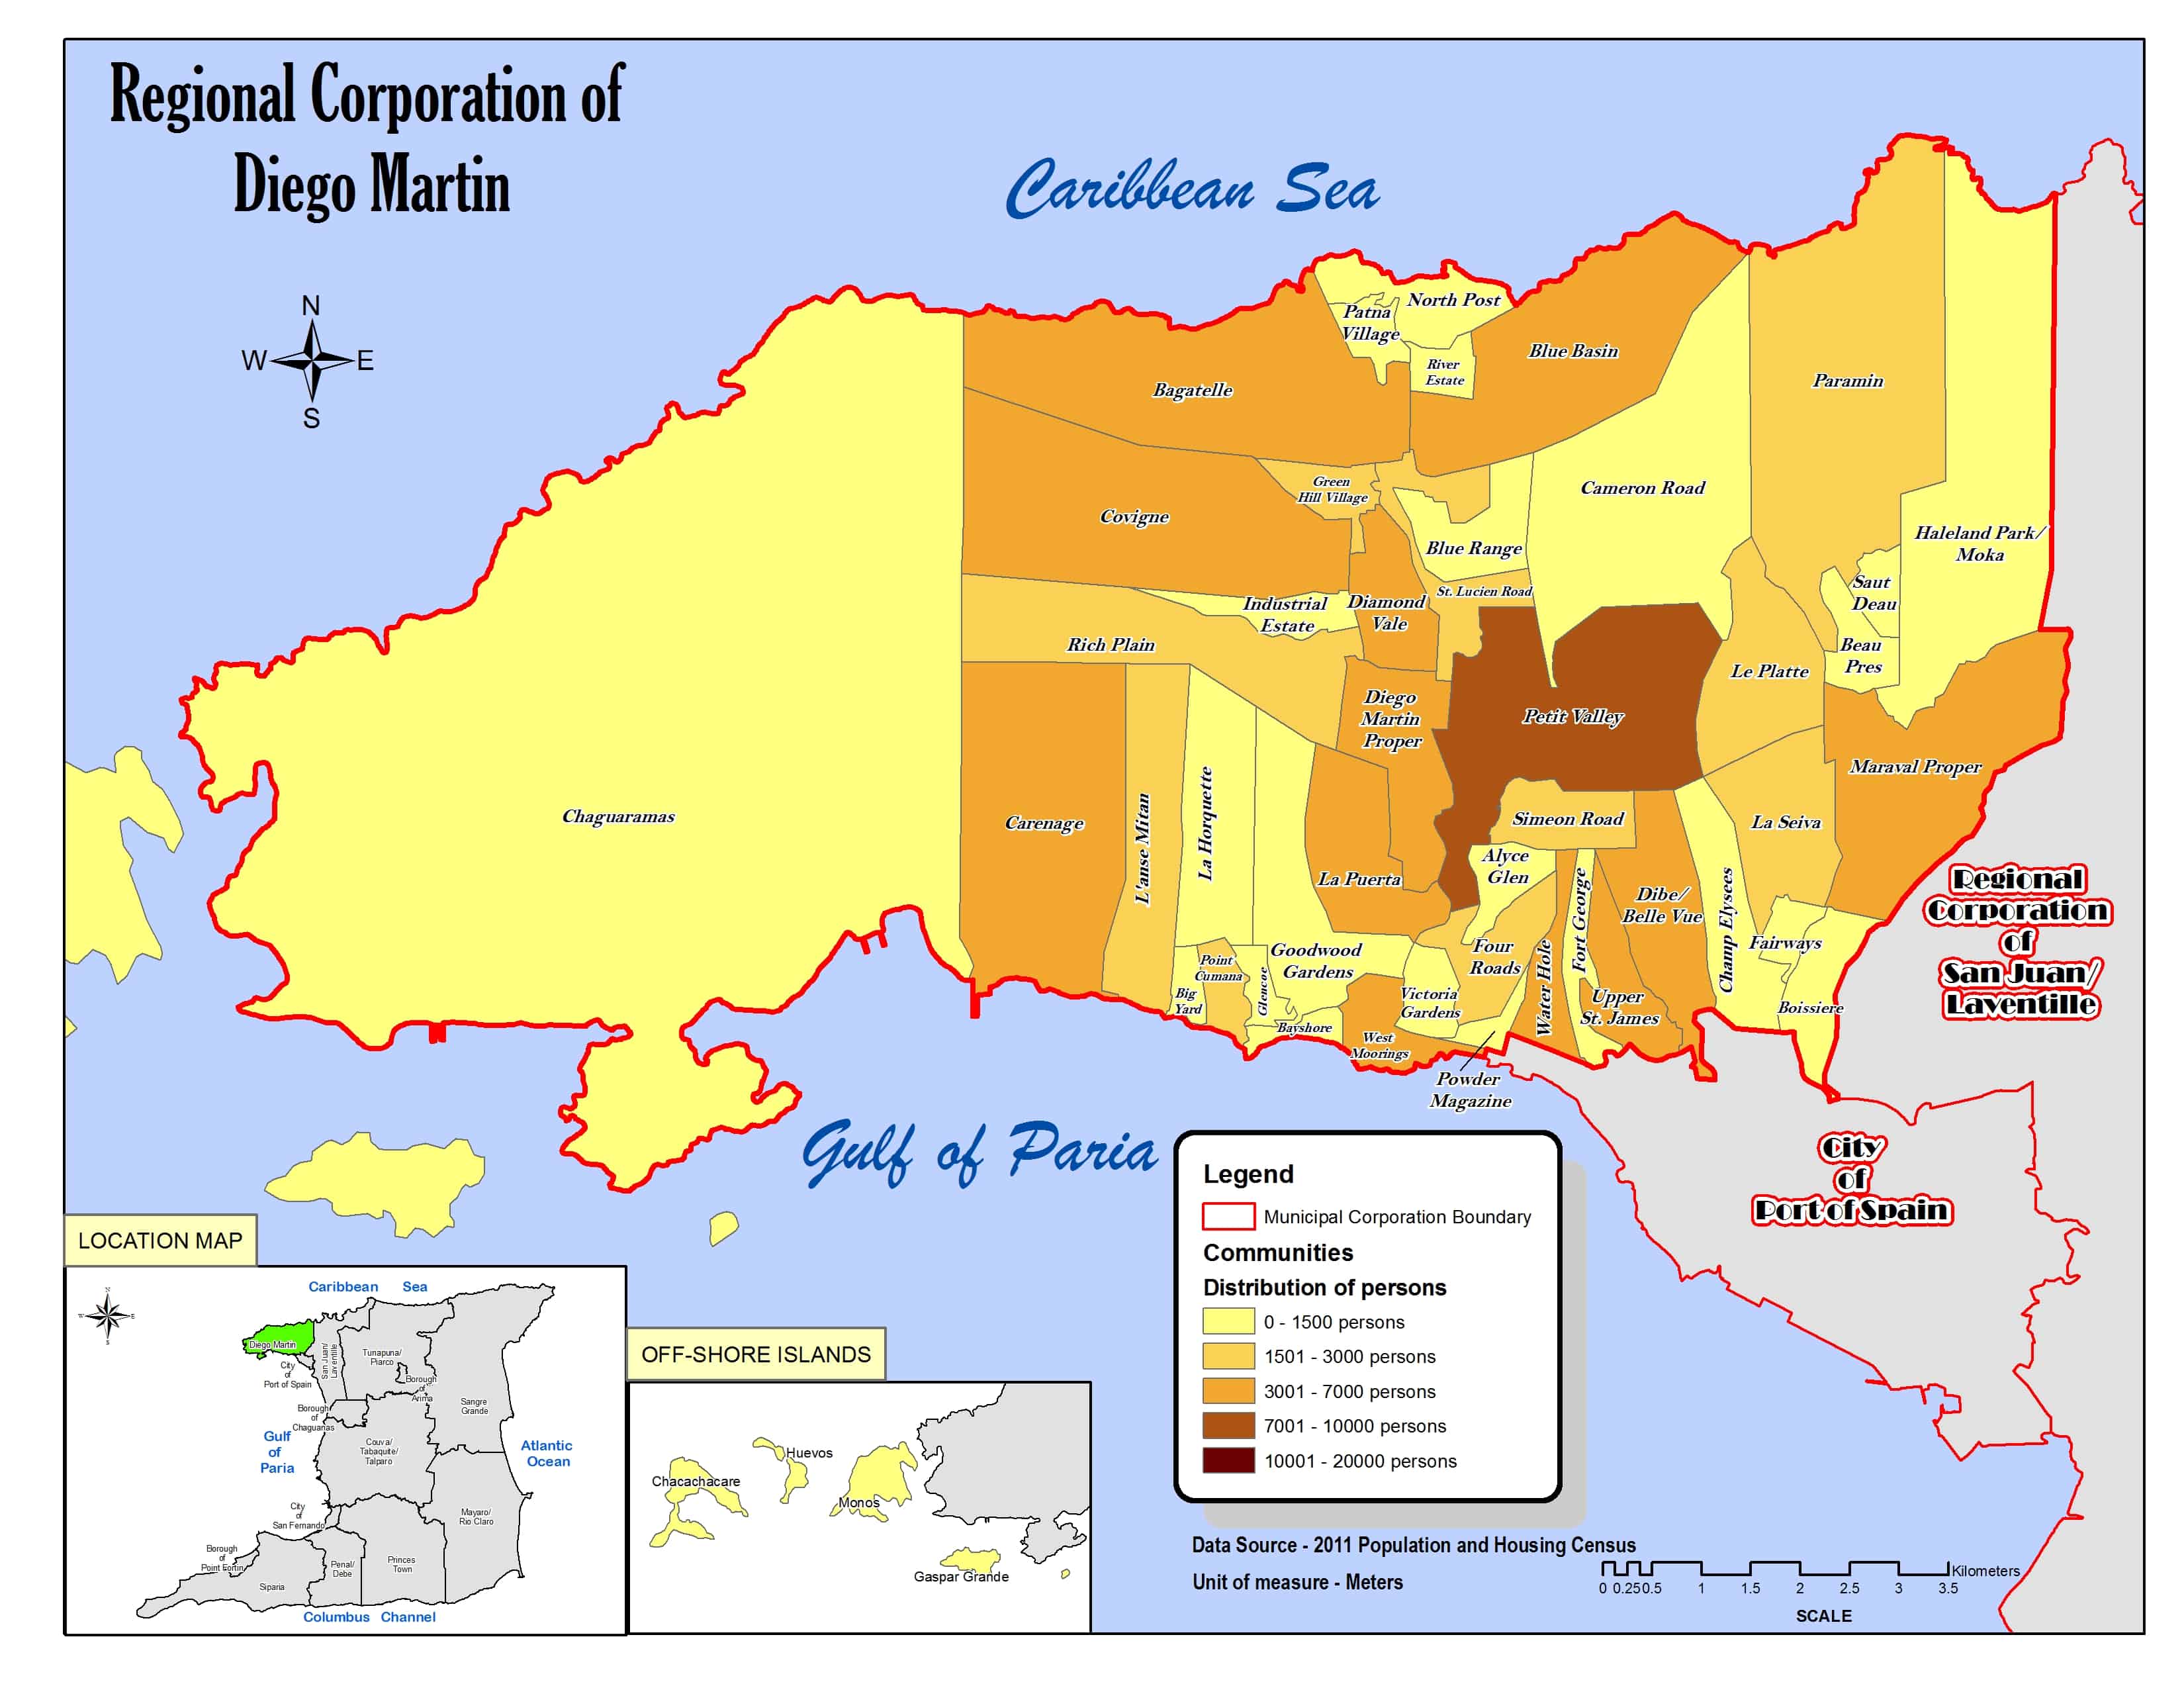

Trinidad Cross Communities
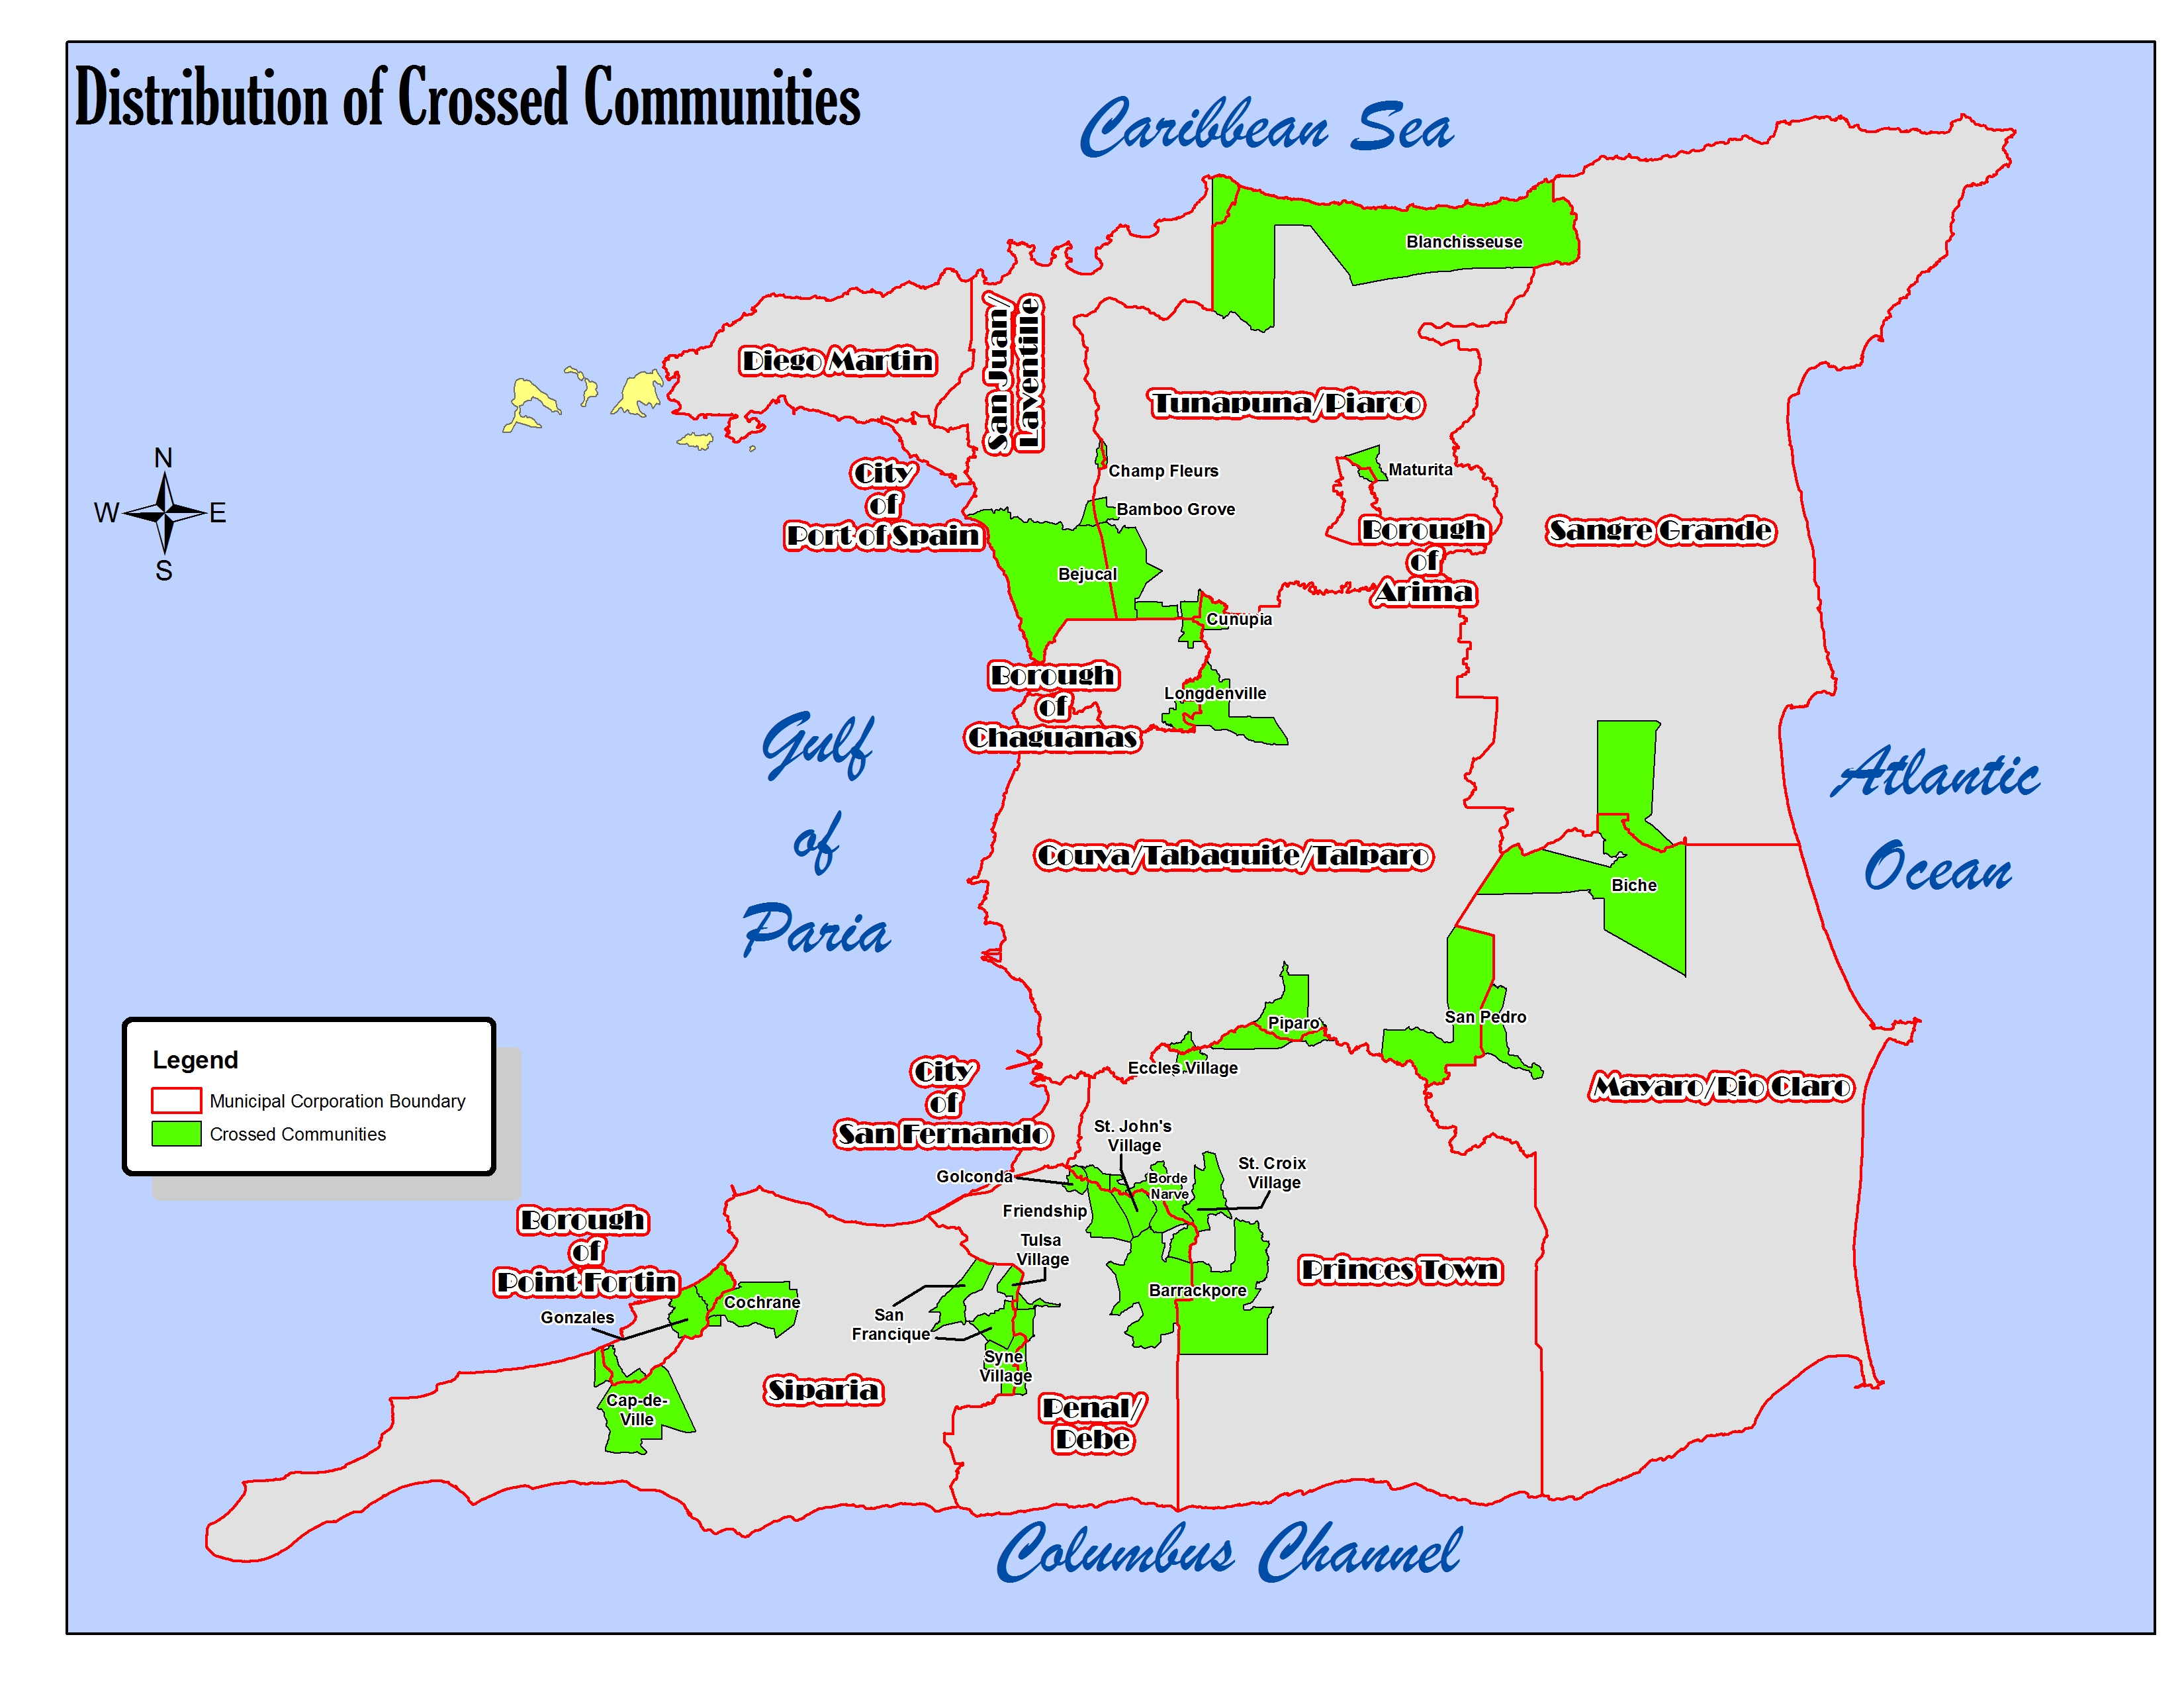 Trinidad Cross Communities
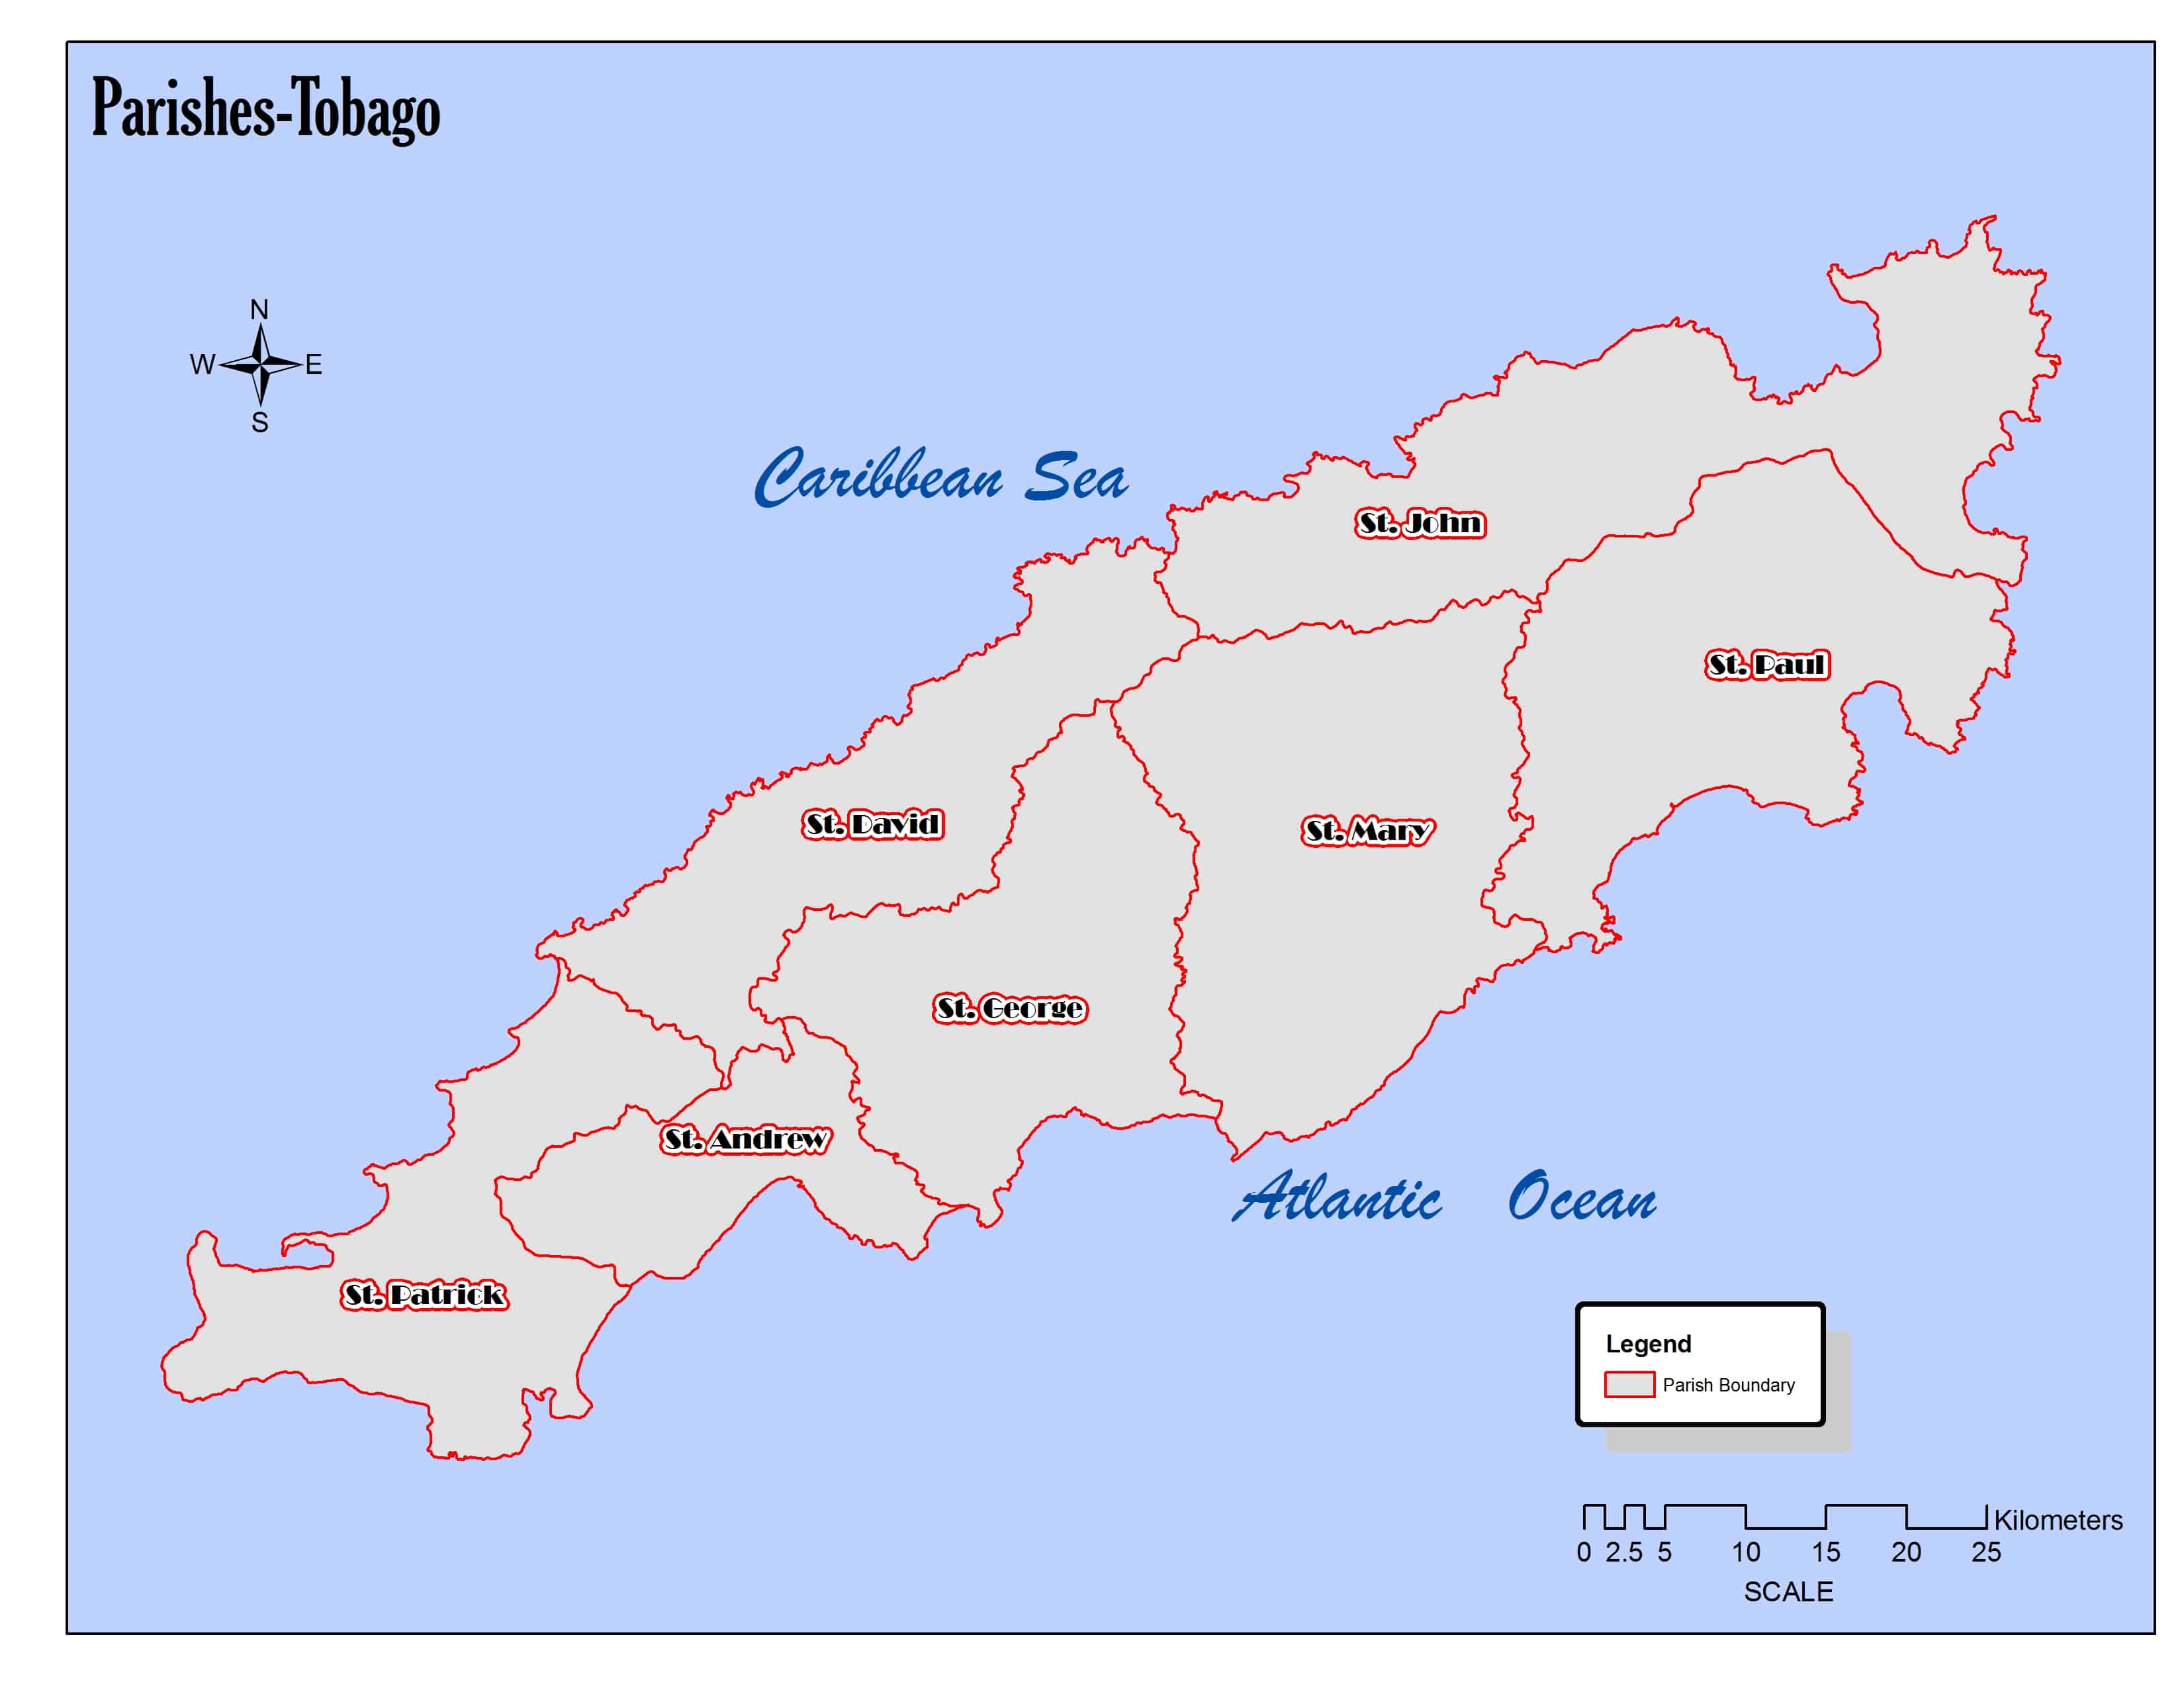
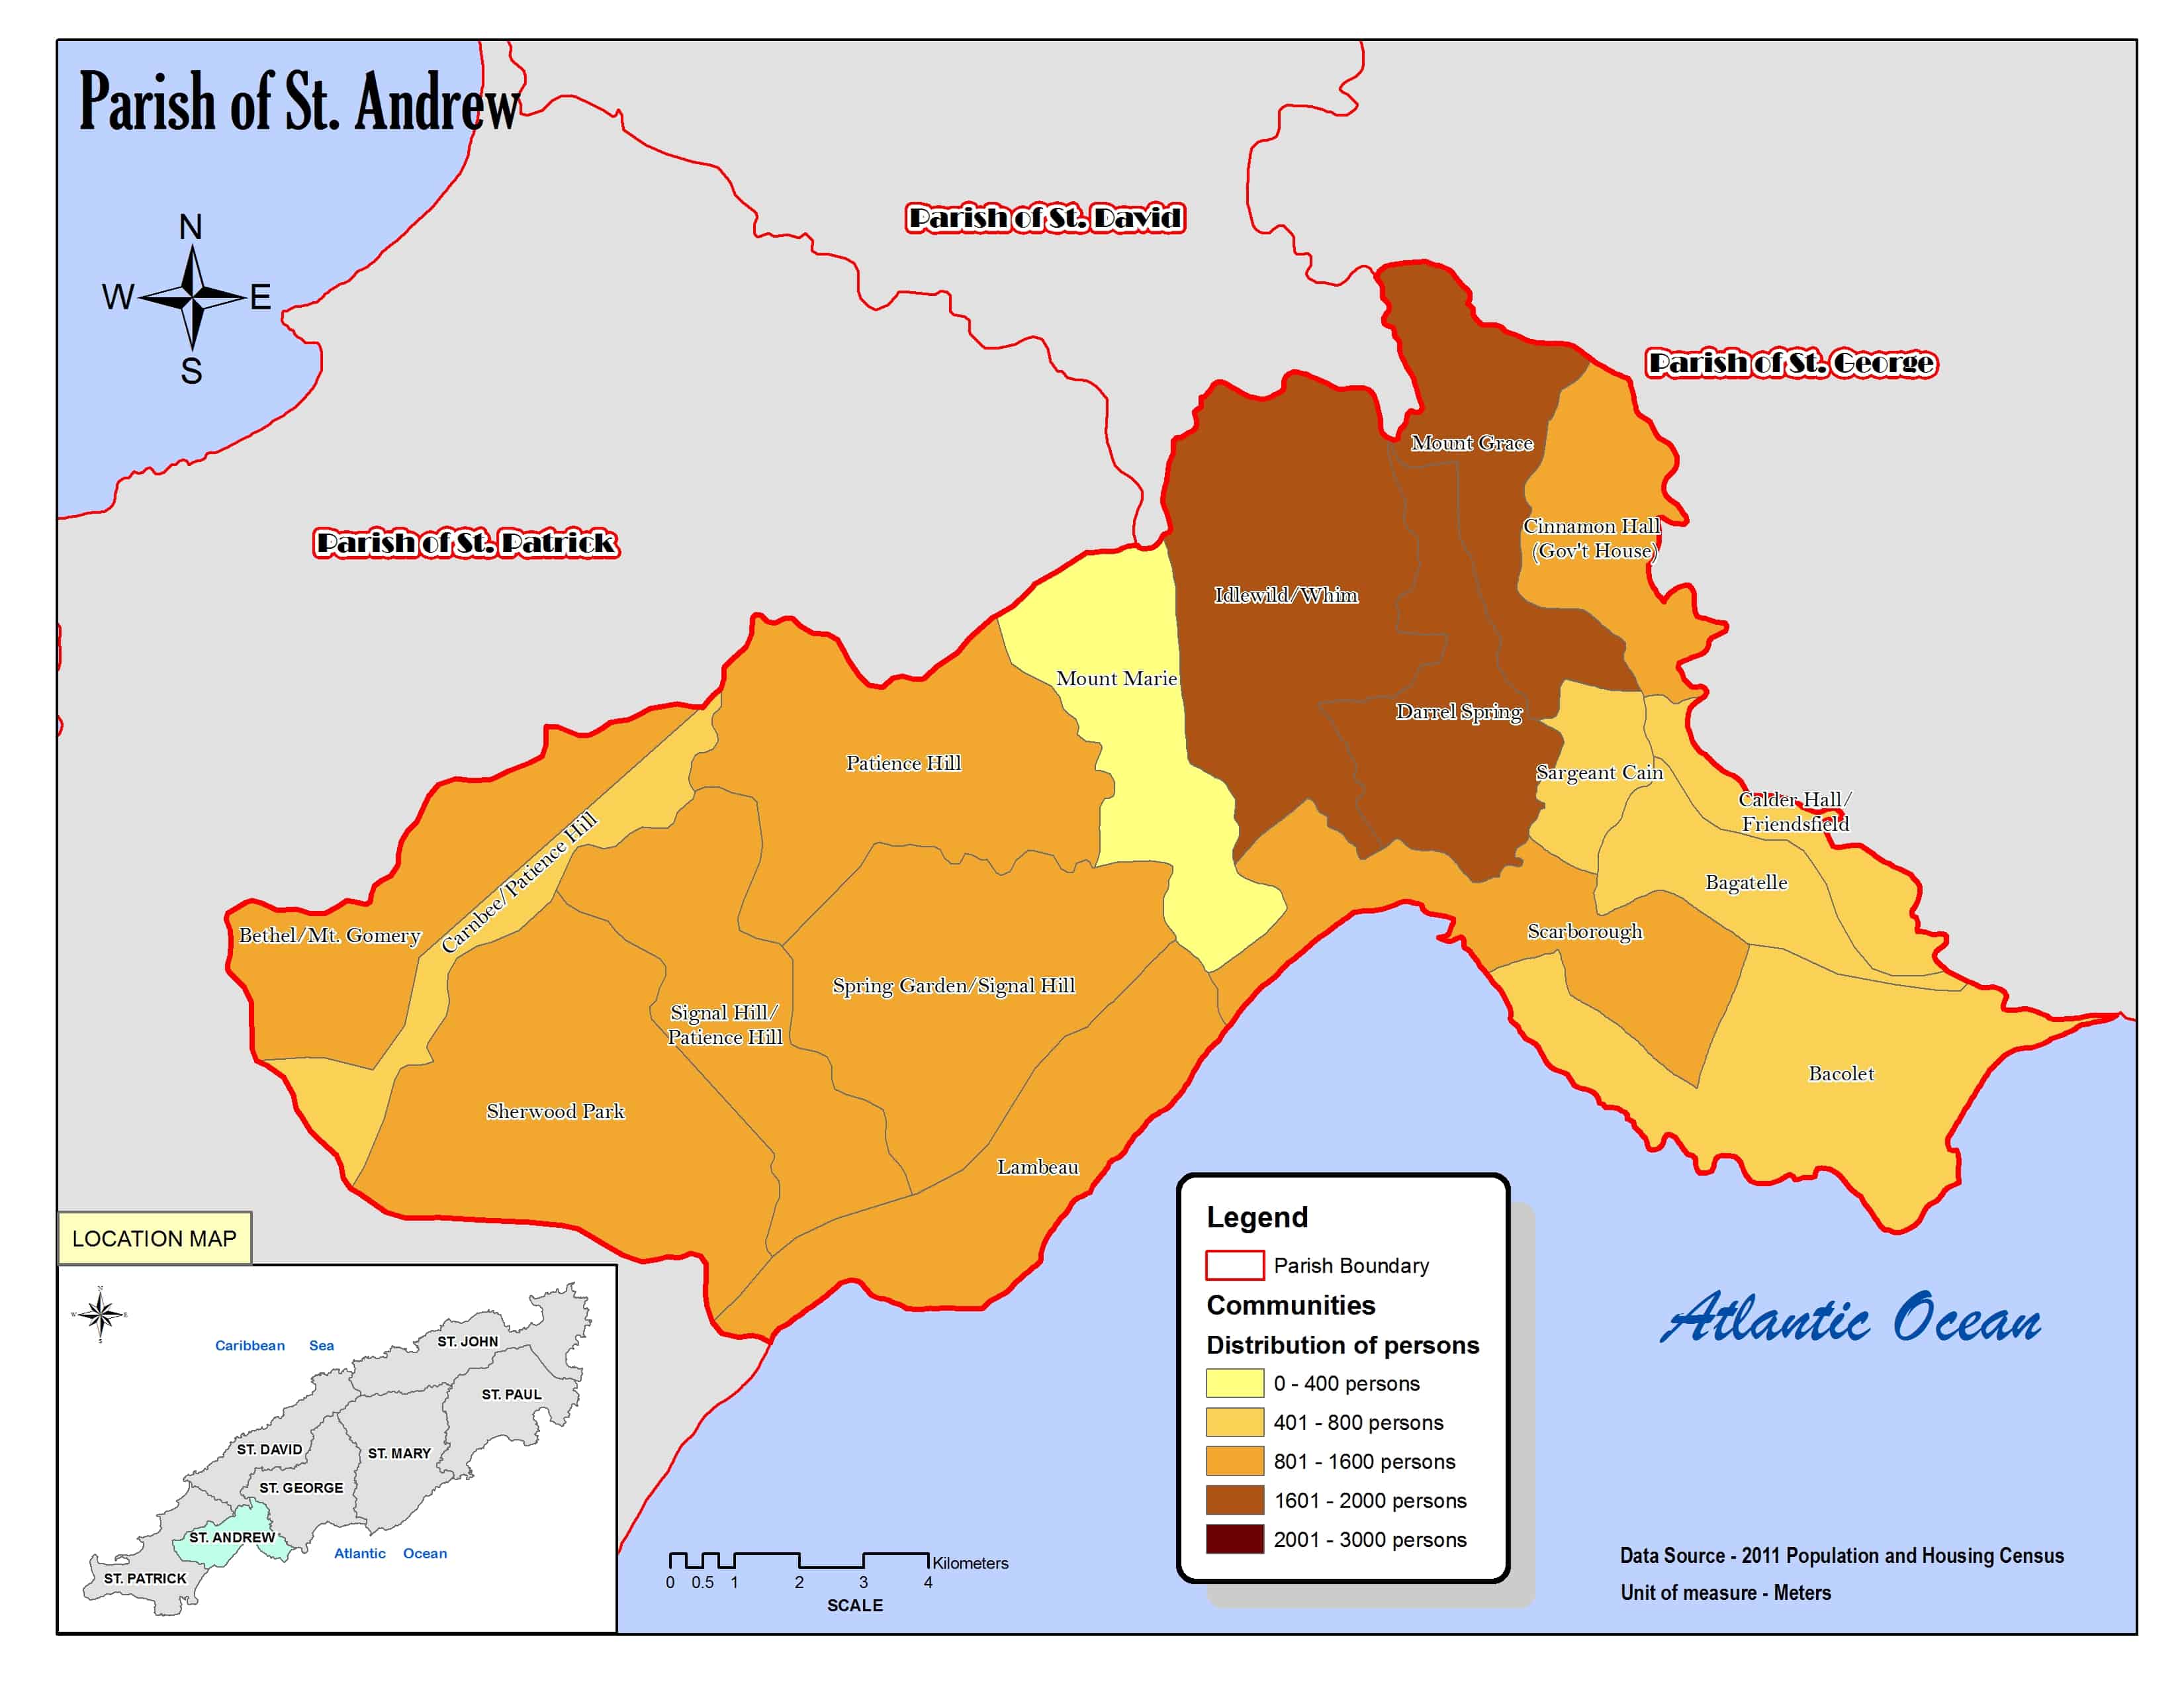
Demographic Profiles of Municipalities and Communities
These cross–tabulations on the non-institutional population were generated from the 2011 Population and Housing Census Database. For each municipality one file is on Individuals and the other is on Households and includes data on all the official communities within the municipality. The data is further broken down by sex and almost all census variables are included.
Individuals
City Corporations
Borough Corporations
Regional Corporations
Trinidad and Tobago- All Regions
_______________________________
Households
City Corporations
Borough Corporations
Regional Corporations
Trinidad and Tobago- All Regions

Household Stock and Intercensal Growth
For statistical purposes, a household has a special meaning. It is defined as a group of persons who usually eat together and share common living arrangements. It is important to note a member of the household is not necessarily a relative of the main family. For example, a boarder or a domestic employee who sleeps in most nights of the week and shares at least one of the daily meals is also included as a member of the household. The 2011 census revealed that 1,322,546 persons lived in 401,382 private households as compared to the 2000 census which showed that 1,250,652 persons lived in 343,180 private households. The remaining 5,473 persons in the total population lived in institutions or were street dwellers. The total number of households increased 17% over the intercensal period. (2011 Population and Housing Census Demographic Report)
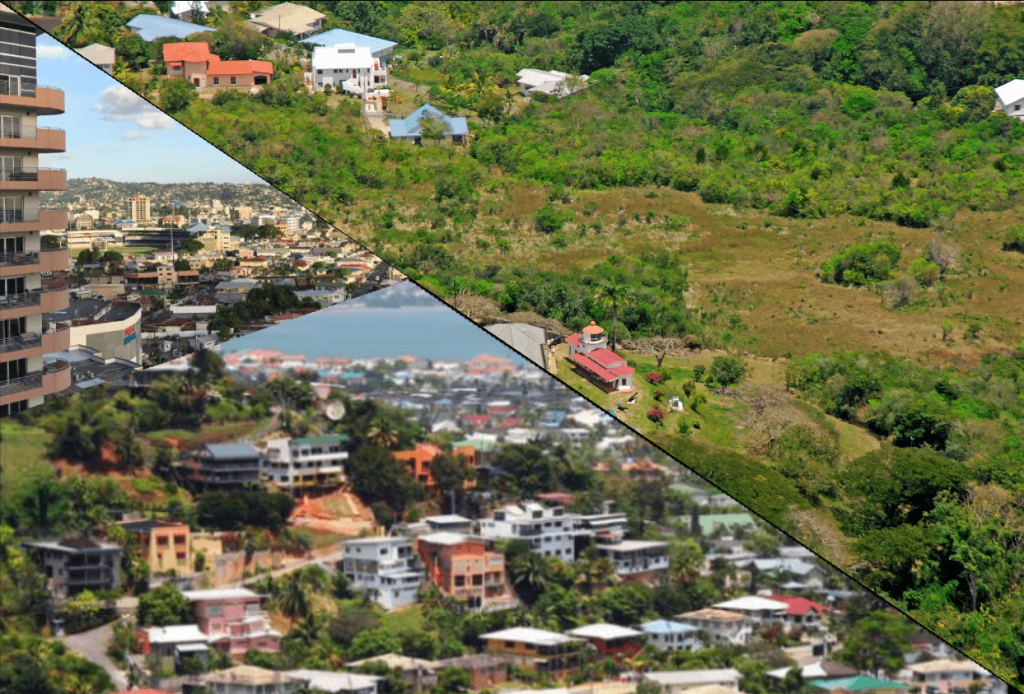
Urban vs Rural
Urban Rural Classification
Migration
An emigrant is defined as a person who leaves one country to take up residence in another. In Trinidad and Tobago, there were 15,455 persons who migrated to other countries during the period 2000-2011. Migration is one of the components of population change and has been notoriously difficult to measure accurately. The 2011 census attempted to account for migration during the period since the 2000 census by asking household heads about migratory movements of former household members. However, in cases where entire households migrated, no data were obtained about migration.
Number of Persons leaving T&T to live abroad during the period 2000 to 2011
Population growth rates in Trinidad and Tobago
Trends and Growth Rates in Total Population, 1851-2011
| Census Year | Duration of the intercensal period (in years) | Trinidad & Tobago Population | Intercensal Change (Absolute) | Intercensal Change (%) | Population Growth Rate per Annum (%) | |||||
|---|---|---|---|---|---|---|---|---|---|---|
| 1851 | na | 82978 | na | na | na | |||||
| 1861 | 10 | 99848 | 16870 | 20.3 | 1.9 | |||||
| 1871 | 10 | 126692 | 26844 | 26.9 | 2.4 | |||||
| 1881 | 10 | 171179 | 44487 | 35.1 | 3.0 | |||||
| 1891 | 10 | 218381 | 47202 | 27.6 | 2.4 | |||||
| 1901 | 10 | 273899 | 55518 | 25.4 | 2.3 | |||||
| 1911 | 9.9 | 333552 | 59653 | 21.8 | 2.0 | |||||
| 1921 | 10.1 | 365913 | 32361 | 9.7 | 0.9 | |||||
| 1931 | 10 | 412783 | 46870 | 12.8 | 1.2 | |||||
| 1946 | 15 | 563222 | 150439 | 36.4 | 2.1 | |||||
| 1960 | 14 | 834350 | 271128 | 48.1 | 2.8 | |||||
| 1970 | 10 | 945210 | 110860 | 13.3 | 1.2 | |||||
| 1980 | 10.1 | 1079791 | 134581 | 14.2 | 1.3 | |||||
| 1990 | 10 | 1213733 | 133942 | 12.4 | 1.2 | |||||
| 2000 | 10.1 | 1262366 | 48633 | 4.0 | 0.4 | |||||
| 2011 | 10.6 | 1328019 | 65653 | 5.2 | 0.5 | |||||
| Source:Central Statistical Office | ||||||||||
| na = not applicable | ||||||||||
Census data
The census is the complete enumeration of the population of Trinidad and Tobago and is generally conducted every 10 years. The data provided by this study illustrates a detailed portrait of T&T and its people including their social, demographic and economic characteristics.
Follow the links 🔗 below to explore a wide range of data and geographic information according to census topics.
Keywords: Trinidad and Tobago population,males, females, census, migration, people, community, area, household, housing, demographics, maps, statistics
App Icon by icons8