


Following the 2016 U.S. election, researchers and policymakers have become intensely concerned about the dissemination of “fake news,” or false news stories in circulation (Lazer et al., 2017). Research indicates that fake news is shared widely and has a pro-Republican tilt (Allcott and Gentzkow, 2017). Facebook now flags dubious stories as disputed and tries to block fake news publishers (Mosseri, 2016). While the typical misstatements of politicians can be corrected (Nyhan et al., 2017), the sheer depth of fake news’s conspiracizing may preclude correction. Can fake news be corrected?
To answer, we exposed subjects (n = 2,742) on Mechanical Turk to multiple examples of fake news. As far as we know, this represents one of the first experimental tests of corrections on fake news.Footnote 1 Our fake news examples came from across the political spectrum. We used six fake news examples, randomly exposing each subject to two examples. For each fake news example, subjects randomly saw either the fake news story alone, or the story and a correction. All subjects were asked to agree with the position advanced by the fake news story.
Both the fake news examples and corrections came from the real world. We utilized a wide range of sources for stories and corrections. Some came from traditional media, while others emanated from Internet message boards. For one of the fake stories, we varied the media type, showing subjects a video. For another fake story, we presented subjects with one of two real-world corrections. The full text of each fake story and correction appear in the appendix.
As the top row of Figure 1 shows, on every issue, corrected subjects on average became significantly less convinced by the fake news story. Corrections improved accuracy overall, even among those ideological cohorts who had a clear political interest in a fake news story. For example, despite ubiquitous claims about Russian political interference in the 2016 election, even liberals showed a correction to a story alleging Russian infiltration of a Vermont power utility subsequently evinced more accurate beliefs ( $\hat{\beta }=-1.11$; p < 0.01). Likewise, conservatives exposed to a correction that indicated that President Trump had not ordered an “unprecedented” crackdown on pedophilia became more accurate (
 $\hat{\beta }=-0.76$; p < 0.01). The second row of Figure 1 displays ideological results for all stories.

Figure 1 Correction effects by fake story, overall, and by ideology. Text labels report beta coefficients and p-values adjusted via Bonferroni method for multiple comparisons. The second row reports average effects across both the corrections used for the Russia/Vermont story. The bottom row reports the difference in effects by ideology. This figure summarizes the regression models described in Table 1.
Table 1 Regression Models by Issue
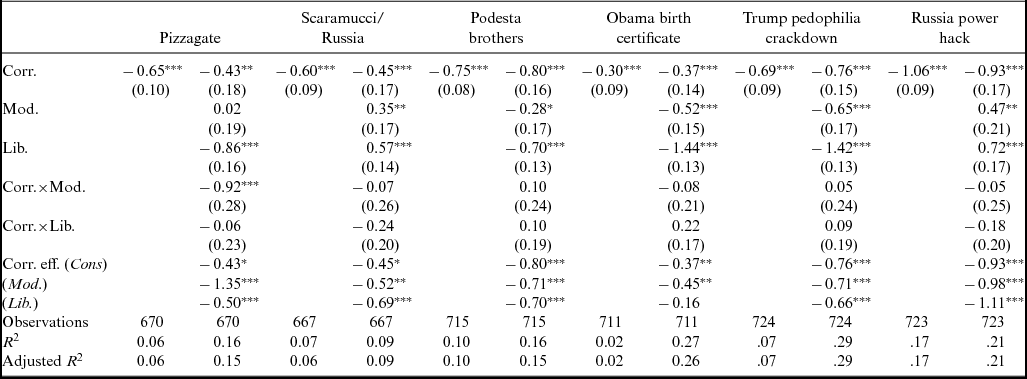
Note: For each issue, the first model measures the unconditional effect of a correction (larger values indicate agreement with inaccurate statement). The second model inside each issue reports the correction effect conditional on ideology. The auxiliary quantities underneath the coefficients report the significance of the corrections by ideology. *p < 0.1; **p < 0.05; ***p < 0.01.
Table 2 Regression Models for Vermont Power Grid Hacking, by Correction Type
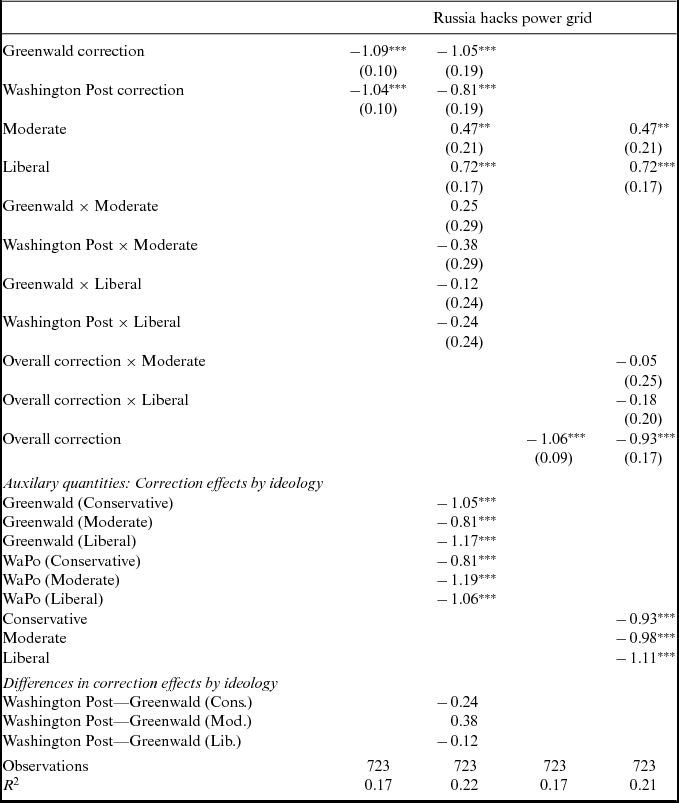
Note: Both the Washington Post and the Glen Greenwald corrections are indistinguishably corrective, as indicated by insignificant differences in the differences in the correction effects (the second group of auxiliary quantities). *p < 0.1; **p < 0.05; ***p < 0.01.
Table 3 Conditional Balance
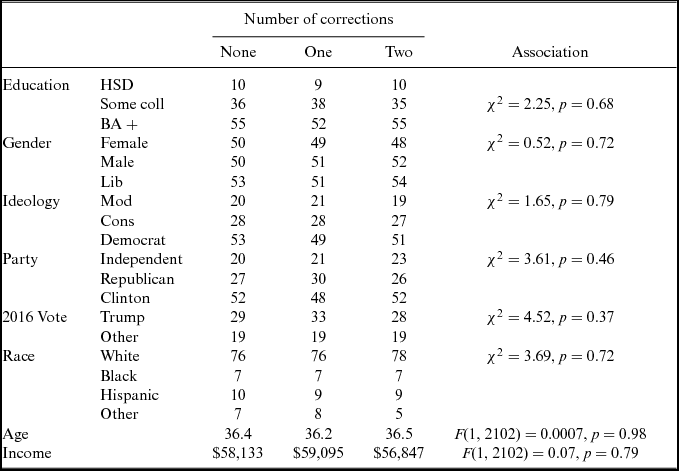
Note: For categorical covariates, the three numerica columns report the proportional distribution of each variable within the variable class. For continuous variables, cells report correction exposure group means. Categorical relationships are tested with a chi-square test, continuous variables are tested with an F-test.
To be sure, there was some evidence of differential response to corrections by ideology. Furthermore, uncorrected subjects were credulous of the claims made by the fake stories. Yet, for no issue was a correction met with factual backfire (Nyhan Reifler, 2010; Wood and Porter, nd). As with non-fake stories, corrections led to large gains in factually accurate beliefs across the ideological spectrum. While fake news may have had a significant impact on the 2016 election, upon seeing a correction, Americans are willing to disregard fanciful accounts and hew to the truth.
SUPPLEMENTARY materials
To view supplementary material for this article, please visit https://doi.org/10.1017/XPS.2017.32


