Determinants of Distribution Patterns and Management Needs in a Critically Endangered Lion Panthera leo Population
 Philipp Henschel1
  Lisanne S. Petracca1,2*
  Luke T. B. Hunter1
  Martial Kiki3 Clement Sewadé3 Aristide Tehou4
  Hugh S. Robinson1
- 1Panthera, New York, NY, USA
- 2Department of Environmental and Forest Biology, State University of New York College of Environmental Science and Forestry, Syracuse, NY, USA
- 3Laboratory of Applied Ecology, University of Abomey Calavi, Cotonou, Benin
- 4Centre National de Gestion des Ressources Forestières, Cotonou, Benin
The lion Panthera leo is Critically Endangered in West Africa and is known to occupy only four protected areas within the region. The largest population persists in the trans-boundary W-Arly-Pendjari (WAP) ecosystem, in the border region of Benin, Burkina Faso, and Niger. WAP harbors an estimated 350 individuals, or 90% of West Africa's lions. We modeled lion occupancy across WAP using systematic, vehicle-based spoor counts to assess how landscape variables related to biotic factors, management, and human impact influence lion distribution across WAP. We surveyed 1110 km of roads across WAP in 2012, obtaining 79 lion detections in 32 of our 167 15 × 15 km sampling units (naïve occupancy = 0.41). Overall occupancy (Ψ) was 0.71 (95% SE = 0.56–0.83) when accounting for imperfect detection (p = 0.22, 95% SE = 0.18–0.27). The best predictors of lion occupancy were numbers of permanent protected area staff and mean monthly dry season precipitation. Model-averaged estimates suggest greatest lion occupancy in the Arly and Pendjari management blocks, with lowest occupancy in the tri-national W National Park. Our results suggest that lions in WAP are equally limited by management and biotic factors, and demonstrate how unevenly distributed protection effort limits the distribution of an apex predator across a protected landscape. We strongly recommend increased funding and better protection to increase lion occupancy in WAP, most urgently in the W National Park.
Introduction
The lion Panthera leo is Critically Endangered in West Africa (Bauer et al., 2015a: Henschel et al., 2015). Surveys in all larger (>500 km2) protected areas (PAs) within historical lion range in West Africa, conducted between 2006 and 2012, confirmed lion presence in only 4 out of 21 surveyed PAs, with 3 of the remaining four populations numbering <50 individuals (Henschel et al., 2014). Lions have lost 99% of their historical range in West Africa, and only about 400 individuals remain (Henschel et al., 2014). Recent molecular analyses add to the urgency of saving the remaining populations, as lions in West Africa are geographically isolated from neighboring populations in Central Africa and form a separate evolutionary unit within the sub-species Panthera leo leo (see Bauer et al., 2015b). This sub-species consists of three genetically distinct and geographically clustered populations in Central Africa, West Africa and Asia (Barnett et al., 2014; Bertola et al., 2015). The West African population represents the smallest and most imperiled evolutionary unit within Panthera l. leo.
The predominant drivers of lion range loss and population declines are large-scale conversion of savanna habitat for agriculture and the depletion of prey in remaining intact habitat, including inside PAs (Henschel et al., 2014). While PAs are globally recognized as the cornerstones of conservation strategies (Hockings, 2003; Naughton-Treves et al., 2005), particularly for larger mammals (e.g., Wikramanayake et al., 1998; Stoner et al., 2007), the majority of West African PAs appear to be ineffective at halting biodiversity loss. Analysis of time series data on large ungulate abundance for 11 West African savanna PAs revealed average population declines of 85% between 1970 and 2005 (Craigie et al., 2010).
As Africa's apex predator, lions are reliant on medium, and large-sized wild ungulates to survive (Hayward and Kerley, 2005; Clements et al., 2014). Under natural conditions, the biomass of savanna ungulates is correlated with rainfall and primary production (Coe et al., 1976; East, 1984). Like all carnivores (Carbone and Gittleman, 2002), lions are naturally and indirectly regulated by bottom-up primary productivity, with lion population densities tracking the locally available biomass of large wild ungulates (Van Orsdol et al., 1985; Hayward et al., 2007). This process is increasingly influenced by anthropogenic pressure, one example of which is the collapse of prey populations due to widespread and increasingly commercialized bushmeat hunting in African savannas (Lindsey et al., 2013a). Bushmeat hunting is pervasive in the majority of West African PAs and has caused the local extirpation of lions from those PAs subject to the steepest prey declines (Henschel et al., 2014). When evaluating characteristics of the West African PAs surveyed for lions, PAs retaining lions were larger than PAs without lions, and had significantly higher management budgets (Henschel et al., 2014). The close link between protection efforts and the density and persistence of key large mammal species in African PAs has been highlighted in prior studies (Packer et al., 2013; Lindsey et al., 2014). In such comparative studies on management effectiveness, higher protection levels have been achieved by a physical protection of the site (e.g., fences; Packer et al., 2013), higher financial investment in site protection (Packer et al., 2013; Lindsey et al., 2014), or increased patrol effort (Jachmann, 2008).
The largest remaining lion population in West Africa persists in the trans-boundary W-Arly-Pendjari (WAP) ecosystem (Henschel et al., 2014), the most expansive protected landscape in the region (>27,000 km2; Figure 1). WAP harbors an estimated 350 individuals, or 90% of West Africa's lions (Henschel et al., 2014). Besides lion, WAP harbors an important population of the Critically Endangered Northwest African cheetah Acinonyx jubatus hecki (Belbachir, 2008) and the largest remaining elephant Loxodonta africana population in West Africa (Bouché et al., 2011).
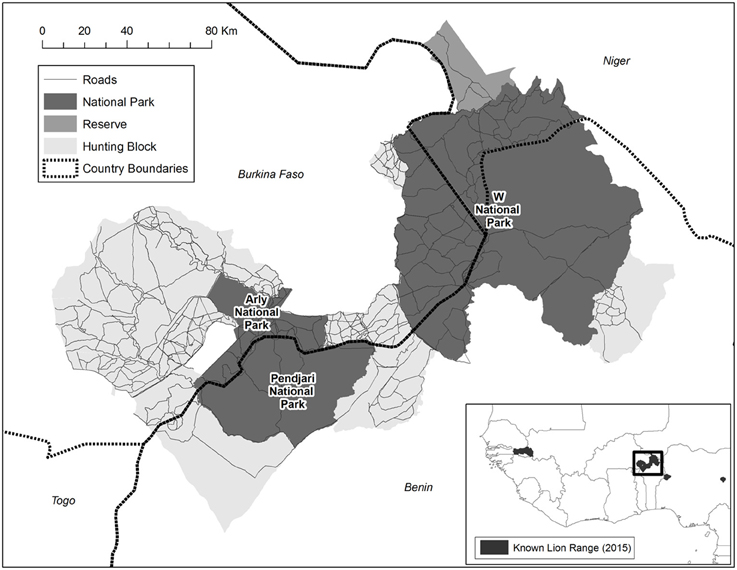
Figure 1. W-Arly-Pendjari (WAP), located in the border region of Benin, Burkina Faso and Niger, and representing an area of >27,000 km2. WAP comprises 21 discrete management blocks, including national parks (54% of land area), hunting concessions (43%) and one faunal reserve (3%). Please note that these are the 2012 management boundaries, and that the Arly NP has since almost doubled in size.
With the aim of contributing to an optimized conservation and management strategy for lions in their last stronghold in West Africa, we conducted a WAP-wide lion survey using systematic, vehicle-based spoor counts. We assessed how a suite of landscape variables related to biotic factors, management, and human impacts influence and potentially limit lion distribution across WAP. We hypothesized that in WAP, as has been found elsewhere, lion occurrence would be influenced by processes related to habitat productivity (e.g., Hopcraft et al., 2005; Loveridge and Canney, 2009; Everatt et al., 2015), as well as pressures related to illegal activities in the PA (e.g., Everatt et al., 2014), or the inability of wildlife authorities to fully mitigate the latter due to limited management budgets or patrol staff (Packer et al., 2013; Henschel et al., 2014).
Materials and Methods
Study Area
W-Arly-Pendjari (WAP) is situated in the border region of Benin, Burkina Faso and Niger (between 0.4° and 3.2°E, and between 10.6° and 12.8°N), and is the largest expanse of protected habitat in West Africa (area >27,000 km2). WAP comprises 21 discrete management blocks, including national parks (NPs; 54% of total area), hunting concessions (43%), and one faunal reserve (3%) (Figure 1). Hunting concessions are restricted to Burkina Faso and Benin; trophy hunting is illegal in Niger. The main species on hunting quota in Burkina Faso and Benin are buffalo Syncerus caffer, larger antelopes and lion. There is one faunal reserve in Niger (Tamou), which has a similar protection status to most hunting blocks in Burkina Faso and Benin (IUCN category VI), although trophy hunting is not permitted. The NPs within WAP are the tri-national W NP (extending over 5900 km2 in Benin, 2400 km2 in Burkina Faso, and 2300 km2 in Niger), Arly NP (1200 km2 in 2012; now expanded to 2200 km2) in Burkina Faso, and Pendjari NP (2800 km2) in Benin (Figure 1).
Climate and vegetation zones vary considerably across WAP, and are described in more detail elsewhere (Dulieu, 2004; Clerici et al., 2007). Overall, the climate can be characterized as Sudanian, with one wet season (June-October), one cold dry (November-mid-February), and one hot dry (mid-February-May). Conditions are considerably drier in the northeastern part (annual mean precipitation ≈ 500 mm) and wetter in the southwestern part (annual mean precipitation ≈ 1200 mm; Figure 2B). The vegetation in the northeastern part of WAP is characterized by open grasslands, open bushland and open woodland, with woody species dominated by the genera Combretum and Terminalia (Dulieu, 2004). From the central to the southwestern part, bushland gradually transitions into denser woodlands, which are characterized by a few dominant tree species, such as Anogeissus leiocarpus, Terminalia avicennioides, and Isoberlinia spp. (Dulieu, 2004). Watercourses are flanked by denser gallery forest or seasonally inundated plains throughout the entire WAP ecosystem. Floodplain are more common in the western part of WAP.
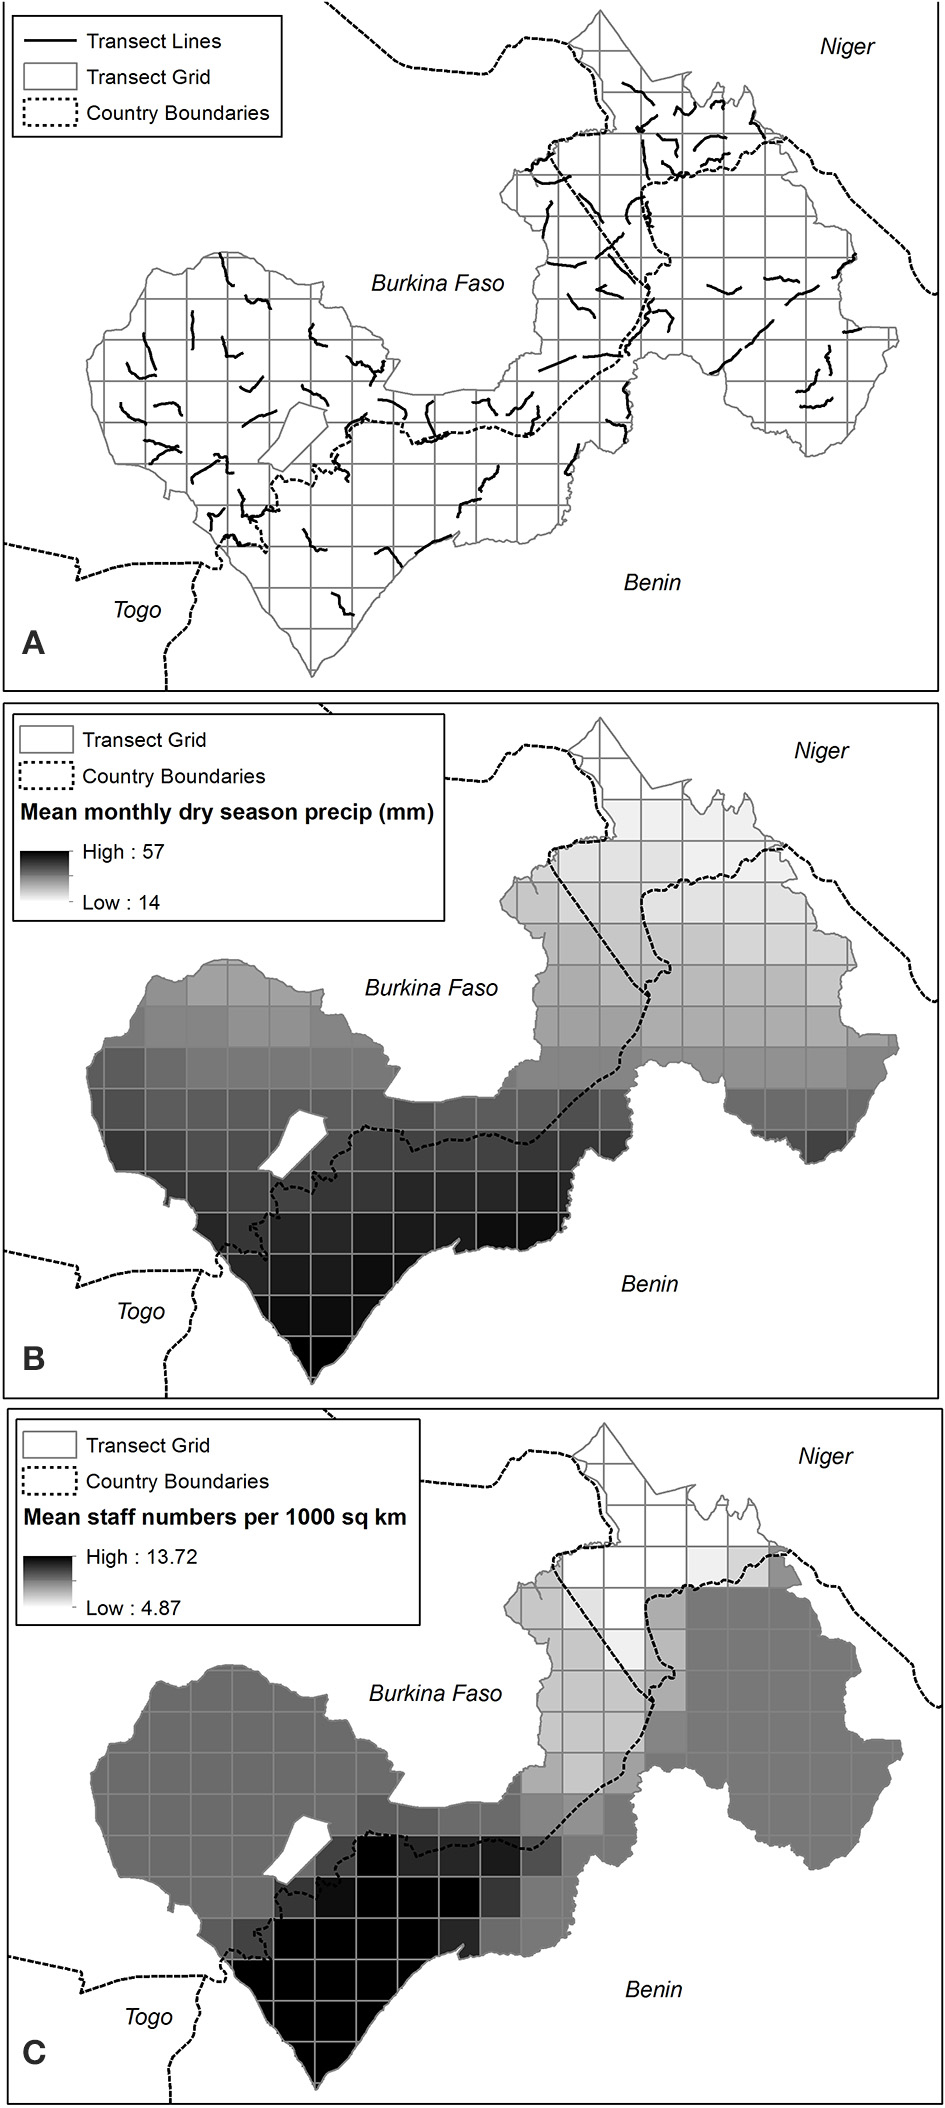
Figure 2. (A) Seventy-four 15-km transects conducted within 225-km2 sampling units of W-Arly-Pendjari (WAP) (B) Mean monthly dry season (March to May) precipitation (mm) in WAP sampling units (C) Mean staff numbers (in number of staff/1000 km2) in WAP sampling units.
The large mammal fauna of WAP includes most species characteristic of the West African savanna (Sinsin et al., 2002). Besides its regional importance for lions, cheetahs, and elephants, WAP also harbors what is likely the largest remaining populations for most West African savanna bovid subspecies, such as Western buffalo Syncerus caffer brachyceros, Western roan antelope Hippotragus equinus koba (Alpers et al., 2004), Western hartebeest Alcelaphus buselaphus major, and Western kob antelope Kobus k. kob; all are important lion prey species (Bauer et al., 2008). African wild dog Lycaon pictus appears to have been recently extirpated from WAP (Henschel et al., 2012).
Anthropogenic pressure on WAP is increasing, with the main threats being conversion of natural habitat for agriculture (Clerici et al., 2007), the penetration of the interior by increasing numbers of nomadic herdsmen and their livestock (Bouché et al., 2004; Bouché, 2012), and poaching (Sinsin et al., 2002). A partial aerial survey of the regional W NP in the dry season of 2012 revealed that in comparison to a prior WAP-wide aerial survey conducted in 2003, numbers of livestock illegally driven into the park for grazing had increased almost 4-fold, to >50,000 head of cattle (Bouché, 2012). To date, no systematic data exists regarding the prevalence and intensity of poaching across WAP.
Study Design and Data Collection
Like most large carnivore species (e.g., McKenzie et al., 2012), lions exhibit extensive movements along PA road networks or other linear features, with individuals or groups often following roads for several kilometers at a time (P. Henschel, unpublished data). Recent studies comparing the effectiveness of commonly used large carnivore survey techniques, such as direct counts (Durant et al., 2011), call-up surveys (Ogutu and Dublin, 1998) and spoor counts (Stander, 1998), identified spoor counts along PA roads as the most appropriate method in terms of detection efficiency, effort, and cost (Thorn et al., 2010). In comparison, aerial surveys commonly used for African wildlife are best suited for large-bodied, group-living ungulates, and produce very few observations of large carnivores, while the use of camera traps and radiotelemetry is prohibitively expensive when aiming to establish population patterns for several hundred individuals and across very large spatial scales (Linkie et al., 2006). We therefore employed vehicle-based spoor counts in WAP, as they provide a cost-effective means of surveying lions over a large geographic area (>27,000 km2).
We conducted our survey with two field teams comprised of experienced local wildlife authority staff, assisted throughout the survey by some of the authors. Each team had two observers seated on custom-made seats fastened to the bull-bars of each survey vehicle. Teams conducted transects between dawn and 10 AM to provide ideal tracking conditions, completing one transect per day per team. Survey vehicles were driven at a maximum speed of 10 km/h during transects. Each transect measured 15 km, to ensure transects could be completed before a high-standing sun could render the detection of tracks difficult.
Probability of detecting tracks ultimately depends on the quality and type of the road surface surveyed (Funston et al., 2010), as well as prevailing weather conditions. Survey teams therefore noted the quality and type of the road surface at 500 m intervals along transects. We assigned road surface to broad categories (e.g., sand, clay), and assigned values between 1 and 4 for substrate quality (1 = excellent–4 = inadequate). For each set of large carnivore tracks detected by the observers, we recorded the GPS position, species, number of individuals and track age, with species and track age identified based on spoor characteristics and weathering, respectively (Stuart and Stuart, 2003). While only fresh tracks (<24 h) are used to estimate carnivore densities following the approach outlined by Funston et al. (2010), we recorded tracks of all ages as well as repeat detections of tracks from lion individuals or groups that followed dirt roads for inclusion in our occupancy analysis.
The uneven distribution of dirt tracks across WAP meant that we were not able to access certain areas; in particular, the W NP on the Benin side has very few roads (Figure 1). Within accessible areas, we aimed to distribute spoor transects as evenly as possible (Figure 2A), targeting roads that had substrates suitable for tracking.
Modeling Approach and Covariate Development
We analyzed detection/non-detection data from the spoor transects via occupancy modeling, an approach that produces unbiased estimates of occupancy (the proportion of sites occupied by a species) while accounting for imperfect detection (cf. MacKenzie et al., 2006). Occupancy modeling also permits the use of covariates to model heterogeneity in these estimates (MacKenzie et al., 2002).
We divided the study area into 167 15 × 15-km sampling units, with units clipped to the WAP boundary. Sampling unit size (225 km2) was based on average lion home range size in the region (Sogbohossou, 2011); the choice of sampling units at the scale of home range size is common in analyses of felid occupancy across large spatial scales (Karanth et al., 2011), as it allows for monitoring of the proportion of potential home ranges occupied by the target species.
We conducted Seventy-four 15-km transects on roads in WAP (1110 km in total) between March 19 and May 22, 2012, recording detection and non-detection of lion spoor for every 500-m section (Figure 2A). As no digitized road layer was available for WAP prior to the survey, field teams had to select transect locations while in the field, which resulted in many of our 15-km transects overlapping more than one sampling unit. The fact that a sampling unit could contain portions of several independent transects precluded the use of occupancy models that account for spatial dependence (Hines et al., 2010), in which the probability of segment × being occupied takes into account the occupancy state of the previous segment. Our solution was to test for independence in transect segment lengths in increasing 500-m increments until (1) the standard, single-season occupancy model without Markovian dependence (MacKenzie et al., 2002) outperformed the occupancy model with Markovian dependence by at least two AIC (Hines et al., 2010), and (2) two key parameters of the spatial dependence model (⊖, probability of lion presence on a replicate given absence on previous replicate, and ⊖', probability of lion presence on a replicate given presence on previous replicate), were approximately equal. The latter criterion removes Markovian dependence of detections, such that the occupancy of a particular segment is the same regardless of whether the previous segment is occupied (Hines et al., 2010).
Spatial independence of segments was achieved at a length of 5 km, such that detection/non-detection data from 10 × 500-m sections were pooled into a single observation of “1” (lion spoor detected along 5-km segment) or “0” (no lion spoor detected along 5-km segment). As some segments failed to reach the full 5-km length, we modeled the number of 500-m sections per segment (min = 1, max = 10) as a covariate (segment length) influencing detection. We hypothesized that detection probability would increase with segment length (number of 500-m sections per segment). We also modeled substrate quality as a detection covariate, specified as the proportion of 500-m sections per transect segment with high quality substrate (Categories 1 and 2). We predicted that detection probability would increase in segments with a higher proportion of 500-m sections of good quality substrate.
We hypothesized that 12 spatial covariates corresponding to seven metrics would best predict lion occupancy in WAP, as these covariates have influenced the distribution or abundance of lion and their primary prey species in prior studies (Table 1). We divided these covariates into two categories, Biotic and Human Impact/Management, such that we could assess the relative contribution of each category to lion occupancy.
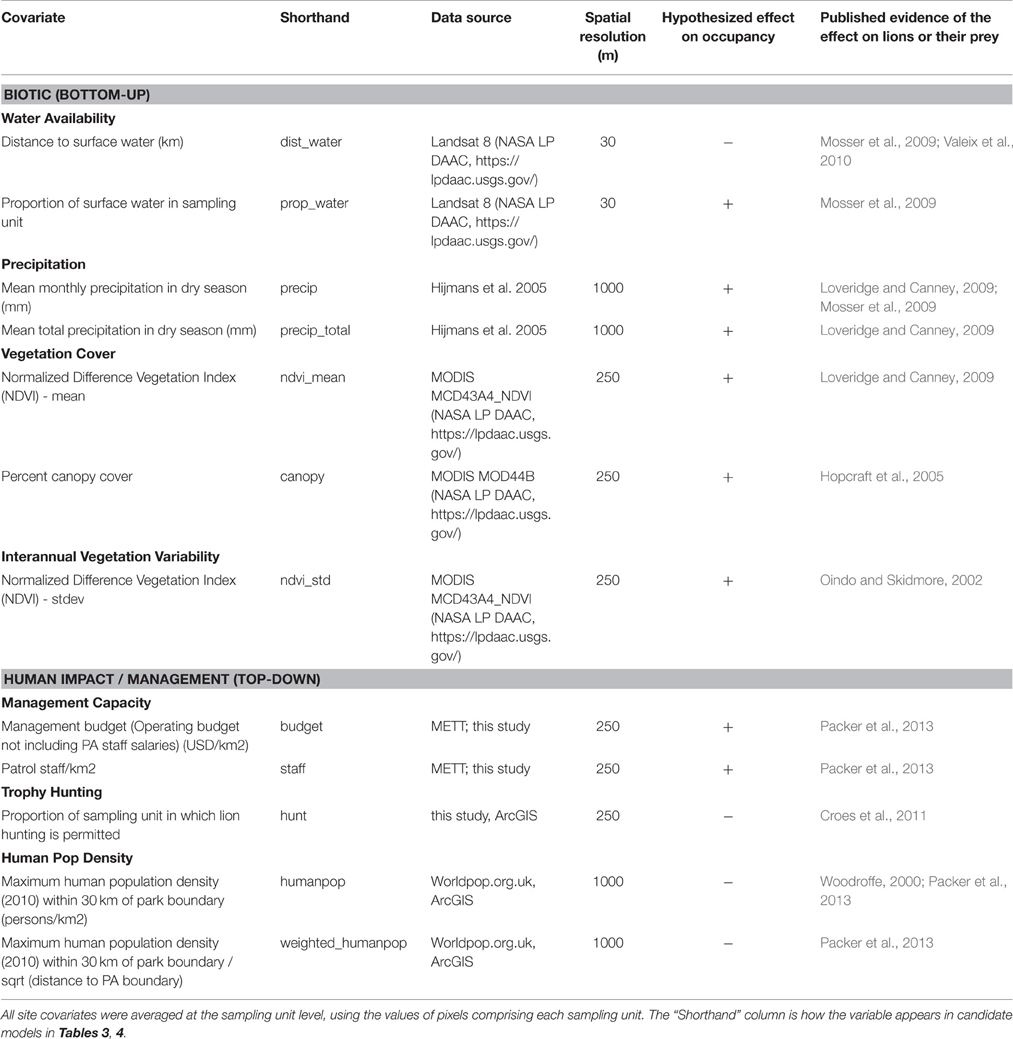
Table 1. Twelve site covariates representing seven metrics hypothesized to affect lion occupancy across W-Arly-Pendjari.
We predicted that covariates in the Biotic category associated with landscape productivity (e.g., greater precipitation, vegetation cover, interannual variation in vegetation, and water availability) would be associated with greater lion occupancy (Table 1), as evidenced by earlier studies (Loveridge and Canney, 2009; Everatt et al., 2015).
In the Human Impact/Management category, we hypothesized that greater management capacity (represented by management budget (USD/km2) and number of patrol staff/km2) would be associated with greater lion occupancy (Packer et al., 2013), while the presence of lion trophy hunting would correlate with lower lion occupancy (Croes et al., 2011). Lastly, we predicted that human population density would have a negative association with lion occupancy (Table 1; Everatt et al., 2014).
We generated layers representing percent canopy cover and Normalized Difference Vegetation Index (NDVI) at 250-m resolution, both indices of primary productivity, using MODIS products obtained through Google Earth Engine (http://earthengine.google.org) (NASA LP DAAC, https://lpdaac.usgs.gov/). We calculated percent canopy cover as the mean pixel values from March to May over the 11-year period for which the MOD44B product is available (2000–2011, DiMiceli et al., 2011); usage of the 11-year time window was necessary due to cloud cover obscuring many images. We used the MCD43A4_NDVI product to calculate the mean and standard deviation of 16-day NDVI imagery during the survey period (March 1–May 31 2012) (NASA LP DAAC, https://lpdaac.usgs.gov/). Areas with high standard deviations correspond to areas with large variations in vegetation composition and growth, which correlates positively to ungulate occurrence (Oindo and Skidmore, 2002).
We derived a layer of dry season surface water at 30-m resolution based on Landsat 8 imagery (NASA LP DAAC, https://lpdaac.usgs.gov/); though the time window was intended to be during the survey period, cloud cover and problematic NoData striping precluded the use of these images, restricting us to using cloud-free imagery from April 2013 to April 2015 as a proxy of 2012 dry season surface water. We first filtered the imagery to include only data from the late dry season of each year (March 1–May 31). We then calculated the mean normalized difference water index (NDWI) for that period (McFeeters, 1996; Ji et al., 2009); this metric uses a ratio of infrared and visible bands (SWIR - GREEN/ SWIR + GREEN) such that vegetated surfaces tend to have positive values, bare soil is around zero, and open water features have negative values. Though McFeeters (1996) recommended a threshold of zero, Ji et al. (2009) found that the “ideal” threshold can vary. We used our knowledge of the study area to experiment with different thresholds, and chose a threshold of 0.15 to delineate open water. We produced 1-km resolution layers of mean monthly and total precipitation for the dry season (January to May) using WorldClim v1.4 data (Hijmans et al., 2005).
Human population metrics were derived from a 2010 human population density layer from Worldpop (Worldpop.org.uk). We created two layers at 1-km resolution to represent population pressure: (1) maximum population density within a 30-km buffer around WAP, and (2) the previous metric divided by the square root of distance to edge, which gave greater weight to population numbers closer to the WAP boundary.
Budget and staffing data for WAP were obtained from a WWF/World Bank Management Effectiveness Tracking Tool (METT) assessment carried out for the year 2011, the only year for which data were available to us. The METT is one of the most widely used assessment tools for Protected Area Management Effectiveness (PAME), with the data available to PA managers, staff and stakeholders (Leverington et al., 2010). Budget data (in USD/km2/year) and staffing data (in #people/km2) varied across five sectors of WAP, and were converted to a raster layer at 250-m resolution. Mean budget and staffing were calculated as the mean value of pixels comprising each sampling unit. As some sampling units overlapped two management areas, these units had a mean budget or staffing level intermediate between the two management areas, depending on degree of overlap. Here we use number of permanent staff per km2 as a proxy for patrol intensity, while acknowledging that there are instances where staff presence may not guarantee active patrols (e.g., given a deficit in funding or patrol vehicles).
Data on which areas permitted hunting were gathered from protected area managers during our survey, and converted to a raster at 250-m resolution; as the boundaries of some sampling units crossed more than one PA, each with its own land use restrictions, sampling units could have none, all, or a portion of its area in which trophy hunting was permitted. Settlements in and around WAP were hand-digitized in GoogleEarth and used to calculate distance to settlement at 30-m resolution; however, as our transects in Arly-Pendjari NPs were on average closer to settlements, this bias caused us to remove this covariate from the analysis.
All covariates were extracted at the sampling unit level, such that each 225 km2 sampling unit had a covariate value corresponding to the mean of all pixel values within that sampling unit. Number of pixels within a sampling unit depended on the resolution of the underlying imagery. As an example, mean NDVI for Sampling Unit X would be the average NDVI values of all pixels within Sampling Unit X. In the case of binary pixel values, such as with trophy hunting presence (0/1), and permanent water (0/1), the mean of pixel values becomes a proportion.
We admit there is temporal variability in the geospatial data used in this analysis, as GIS and remote sensing data corresponding to the exact time frame of our survey were largely unavailable. However, as all covariates were standardized using a normal z-transformation, we assumed that the relative differences in these values across WAP would remain intact given data outdated or postdated by 1 or 2 years.
Occupancy Analysis
We analyzed transect survey data using a single-season, single-species occupancy model in the R package unmarked (Fiske and Chandler, 2011; R Core Team, 2013). Our approach was to model covariates hypothesized to affect detection (p) first while holding occupancy (ψ) constant, and then use the detection model with lowest AIC in models testing the significance of occupancy covariates (Karanth et al., 2011).
In modeling occupancy (ψ), we had 12 covariates representing seven metrics that we hypothesized would affect lion occupancy (Table 1). Those covariates representing the same metric were tested univariately: proportion of permanent water in sampling unit and distance to permanent water (for water availability), mean monthly and mean total precipitation in dry season (for precipitation), mean NDVI and mean canopy cover (for vegetation cover), management budget and number of patrol staff per km2 (for management capacity), and maximum human population density within 30 km of park boundary with and without correction for distance to PA boundary (for human population density), and we selected the variable with lowest AIC from each pair for use in subsequent models.
We tested the remaining seven variables in an all-possible-subsets approach (additive only, no interactions), excluding variables from the same model if correlated at |r| > 0.70. We were limited to a maximum of three variables per model given a rule of thumb of 15–25 observations per predictor variable (Green, 1991). We used the R package AICcmodavg (Mazerolle, 2015) to test goodness-of-fit of our most complex model(s) as recommended by MacKenzie et al. (2006), with Pearson's chi-square statistic and 10,000 parametric bootstraps (MacKenzie and Bailey, 2004). As we had multiple three-variable models, we tested goodness-of-fit for all models with ΔAICc < 4, as those with ΔAICc > 4 have considerably less support than other candidate models (Burnham and Anderson, 2004). We adjusted standard error estimates if there was evidence of overdispersion (c-hat >> 1; (MacKenzie et al., 2006). We retained in the final model set all models with ΔAICc < 2, as these models had substantial empirical support (Burnham and Anderson, 2004), and model-averaged all parameters with the R package MuMIn (Bartoń, 2016).
To assess the relative contribution of each covariate to explaining lion occupancy in WAP, we summed the AICc weights of all models in which a given variable was present. This metric can be used as a measure of overall level of support for a given variable (Burnham and Anderson, 2004). Values can range from 0 to 1; a covariate can have a value of 1 if it is present in all models.
To generate the map of predicted occupancy values for each sampling unit, we used the “ranef” function in R package lme4 (Bates et al., 2014) to estimate psi-conditional (ψ-cond.) for surveyed sampling units, using all models within 2 Δ AICc of the top model. Psi-conditional is a derived parameter representing the probability of a species occupying a sampling unit given the observed detection history for that unit (MacKenzie et al., 2006). This probability will be 1.0 for any unit at which the species was detected at least once and will be between 0 and 1.0 for any unit where the species was never detected.
Psi-conditional cannot be estimated for unsurveyed sampling units, as these units do not have detection histories. For all models within 2 Δ AICc we used the model-averaged coefficients and “predict” function in R package unmarked (Fiske and Chandler, 2011) to derive unconditional psi estimates (ψ-uncond). Thus, for mapping we used the conditional estimates for surveyed cells and unconditional psi estimates for unsurveyed cells.
Lastly, we predicted lion occupancy based on the ranges of (1) permanent staff numbers and (2) mean monthly precipitation in the dry season found in WAP, while holding all other variables constant, to explore a potential threshold above which there is a high probability of lion occupancy.
Results
Our Seventy-four 15-km transects intersected 79 of 167 (47.3%) sampling units, with an average of 13.99 ± 7.11 kilometers covered per surveyed sampling unit. Transect segment length was the best predictor of detection probability and was included as the baseline detection model for all models predicting occupancy (Table 2).
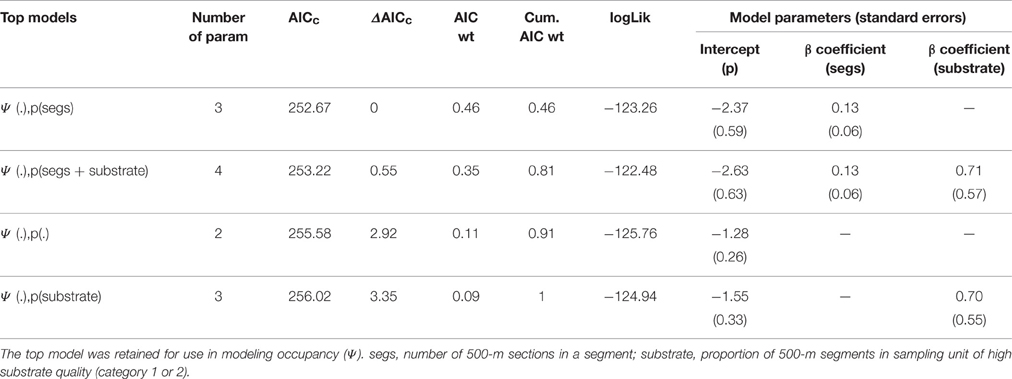
Table 2. Model selection procedure for covariates associated with detection (p) of lions in WAP.
We recorded 79 lion detections in 32 of the sampled units, corresponding to a naïve occupancy estimate (proportion of sampled units in which lions were detected) of 0.41. Accounting for imperfect detection resulted in a mean detection probability of 0.22 (95% SE = 0.18–0.27) and an overall occupancy estimate of 0.71 (95% SE = 0.56–0.83), the latter of which is nearly double the naïve estimate.
In the case of covariate pairs representing the same metric, we retained mean monthly precipitation in the dry season (for precipitation), percent canopy cover (for vegetation cover), number of permanent staff per km2 (for management capacity), and maximum population density within 30 km of park boundary (for human population density; Table S1). There were two covariate pairs correlated at |r| > 0.7 that could not be in the same model (Table S2). A goodness-of-fit test on the most complex model in the candidate set within 4 ΔAICc of the top model (Table S3) did not indicate evidence of overdispersion, with c-hat = 1.09.
Given a candidate set of 79 models, the best predictors of lion occupancy in WAP were number of permanent staff per km2 and mean monthly dry season precipitation (mm) (Tables 3, 4), with summed AIC weights of 0.64 and 0.36, respectively, followed by human population density (0.25) and proportion of area hunted (0.14) (Table 5). Model results supported our a priori hypotheses. Namely, lion occupancy increased with permanent staff numbers and with average monthly dry season precipitation (Table 4, Figures 3, 4).
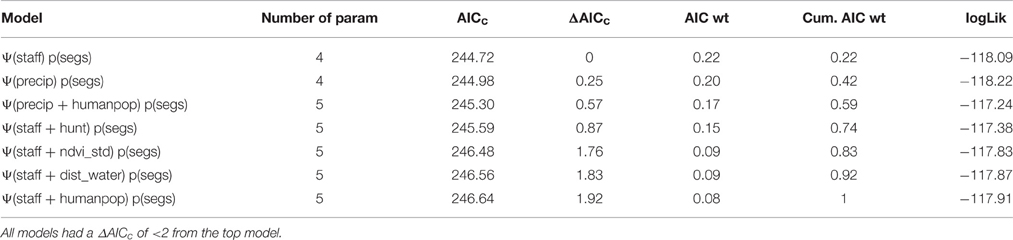
Table 3. Results of multivariate model selection for estimating lion occupancy (Ψ) in WAP.
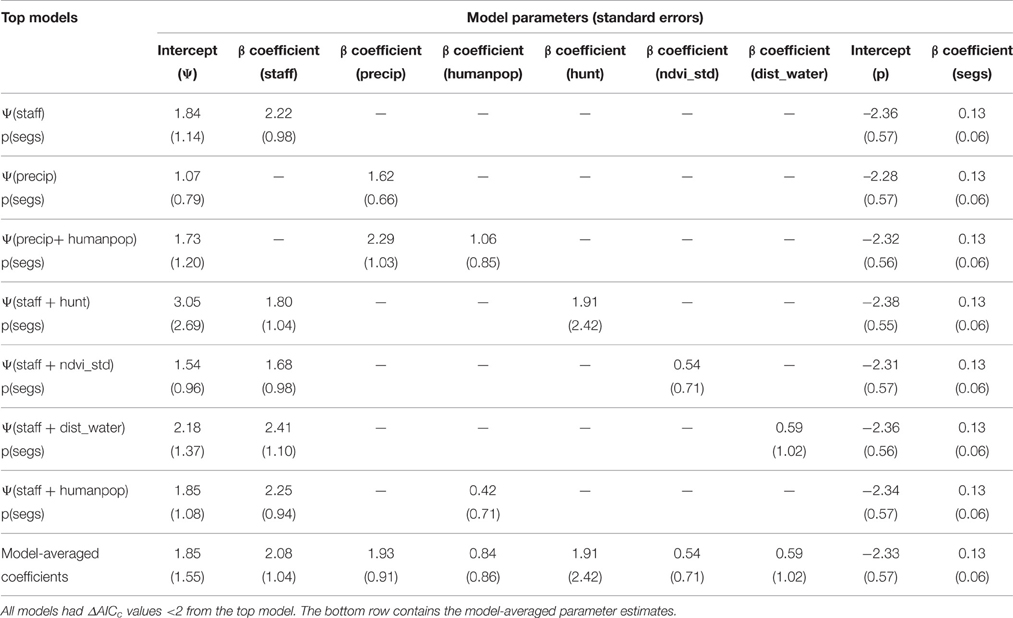
Table 4. Parameter estimates (standard errors in parentheses) of final model set for estimating lion occupancy (Ψ) in WAP.
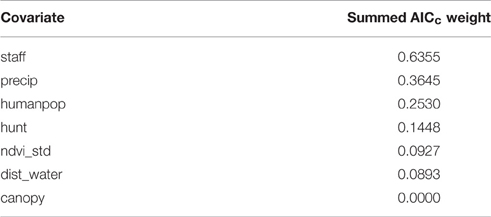
Table 5. Summed AICc weights of all covariates in the final model set.
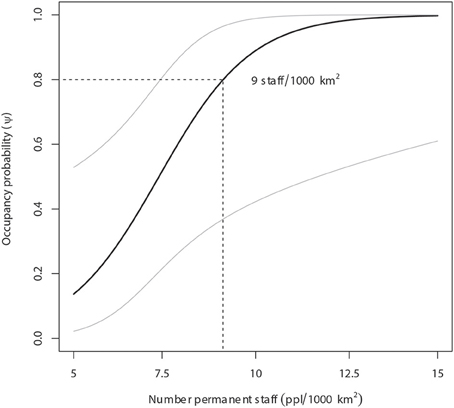
Figure 3. Lion occupancy estimates in WAP (with 95% Prediction Intervals) given variation in number of permanent staff (USD/1000 km2). Our model predicts that areas with a minimum lion occupancy probability of 80% employs at least 9 staff members per 1000 km2.
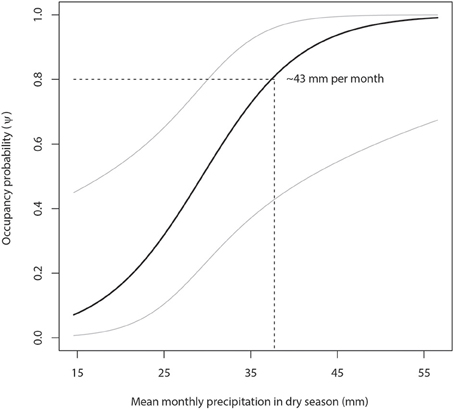
Figure 4. Lion occupancy estimates in WAP (with 95% Prediction Intervals) given variation in mean monthly dry season (March to May) precipitation (mm). Our model predicts that areas with a minimum lion occupancy probability of 80% receive at least 43 mm of monthly precipitation in the dry season.
Our model predicts that areas with a minimum lion occupancy probability of 80% have at least 9 permanent staff members per 1000 km2 (Figure 3) and receive at least 43 mm of monthly precipitation in the dry season (Figure 4). There is some evidence of lion occupancy increasing with greater human population density and the presence of trophy hunting, though the standard errors were too high to put much confidence in these estimates (Table 4).
Our model-averaged estimates of lion occupancy suggest greatest lion occupancy in the Arly-Pendjari region in western WAP, with lowest occupancy in W NP and surrounds in the east (Figure 5).
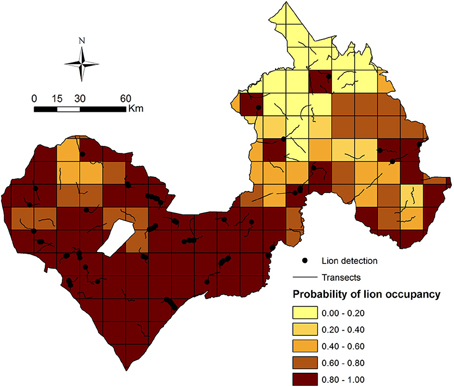
Figure 5. Model-averaged occupancy (ψ) estimates in WAP sampling units.
Discussion
Our results suggest that lions in W-Arly-Pendjari are equally limited by management and biotic factors, as evidenced by patrol staff numbers and monthly precipitation having the greatest influence on lion occupancy across the study area. While Packer et al. (2013) showed that lion population status and growth rates in PAs across Africa are positively related to PA protection efforts (boundary fences and management budgets), ours is the first study to demonstrate how, within the same population, unevenly distributed protection staff can largely constrain the system's apex predator to areas with the greatest protection. In this case, the Arly and Pendjari NPs and surrounding hunting concessions in the western half of WAP had the highest numbers or permanent PA patrol staff (Figure 2C) and the greatest estimates of lion occupancy (Figure 5).
Besides patrol staff, dry season precipitation had the greatest effect on lion distribution across WAP. This finding is in line with findings from prior research, which found that, at a landscape scale, lions can reach higher densities in areas with higher dry season rainfall (Mosser et al., 2009). In general, lion densities can be expected to be higher in the Southwest of WAP, where the wetter conditions and higher NDVI should support a naturally higher prey biomass (East, 1984). Data on prey distribution and local abundance available for 2004 supports this pattern (Bouché et al., 2004). We were not able to test this direct link between prey distribution and lion occurrence, however, as no spatially comprehensive and up-to-date data on prey distribution was available for WAP at the time of our survey. In this context, it is important to note, however, that lions are well-adapted to arid environments, and can occur at 1–2 lions/100 km2 in areas with an annual precipitation well below that of the driest parts of W NP (Stander, 1991; Ferreira et al., 2013). There are several larger rivers and waterholes in W NP which retain surface water throughout the dry season, so there are no ecological reasons why lions should not occupy the entire W area. This is supported by data from a repeat survey conducted in 2014, showing lions that recolonized certain parts of W where the species was absent in 2012 (PAPE, unpublished data). Although presence of surface water likely shapes lion movements at localized scales (Valeix et al., 2010), this covariate did not have a significant effect on lion occupancy at the home range scale, the scale at which we conducted our analysis (Table 4).
Our findings suggest that lions, particularly in W NP, are currently limited by scarce patrol efforts, inadequate to fully protect the park. A WAP-wide aerial survey conducted in 2004 established that incursions by people and cattle herds were detected more frequently in W NP than in Arly-Pendjari, while large mammals, such as elephants and buffalos were significantly more abundant in Arly-Pendjari (Bouché et al., 2004). A partial aerial survey conducted in May 2012 across the tri-national W NP following our lion spoor survey, revealed the presence of >50,000 head of cattle inside this park, compared to an observed <6000 wild herbivores counted in the same survey (Bouché, 2012). This represented a 4-fold increase in the number of illegal cattle in W NP since 2004 (Bouché et al., 2004), and shows that in the dry season, cattle is almost 10 times more abundant in W NP than wild prey.
Though it is unknown how this quasi-replacement of wild prey with cattle impacts local lion populations, comparisons to other areas and anecdotal observations provide some insight. The nomadic pastoralists penetrating WAP in the dry season are of the Fula ethnic group, members of whom have been implicated in the poisoning and local extinction of lions in several PAs across West Africa (Henschel et al., 2010). That such patterns occur in W is supported by local reports from park rangers about lions being killed by herders in W on the Benin side, yet those records have not been quantified to date. The effects of cattle herds on natural lion prey species, namely wild herbivores, either through competition or displacement on pastures or at water points, are likely to have a significant negative effect on local populations (Prins, 2000), particularly as the incursions occur in the dry season when resources are scarce. While the poaching of lion prey for bushmeat consumption (Sinsin et al., 2002) and the poaching of lions for use of their body parts (Henschel et al., 2012) are also recognized threats to lions in WAP, they might be outweighed by the massive illegal incursions of cattle into W NP in the dry season. Further research is required to quantify local impacts of cattle incursions and of poaching on wild herbivores and lions across WAP.
Our findings suggest that currently inadequate protection of W, facilitated by low numbers of permanent staff, have led to a proliferation of illegal usage of W, mainly by nomadic pastoralists, which in turn appears to limit lion occurrence in this eastern part of WAP. Most recently, individuals linked with a regional terrorist group were sighted in the vicinity of and inside the tri-national W NP (CENAGREF, pers. comm.). Analysts observed similar patterns within northern Nigeria, and link the incursions of criminals into PAs to a lack of security mechanisms, patrols, and basic management in the affected PAs. Such lax enforcement leads to hideouts for terrorists, armed robbers, and other criminals (e.g., Ladan, 2014). One explanation for their attraction to W is the presence of high-value natural resources, such as elephants and felids, whose body parts fetch high prices on the illegal wildlife market (Douglas and Alie, 2014). Analysts recommend stronger protection of these areas, including patrols by military units and/or other well-trained and well-equipped security forces (Ladan, 2014), further highlighting the need to improve protection efforts in the tri-national W NP.
While such management interventions require funding, parts of Arly and Pendjari have been shown to generate considerable revenue from tourism, either through photographic tourism or trophy hunting. The Pendjari NP and adjacent hunting concessions, managed jointly as a single block, achieved combined revenues of US$260,000 in 2011 (CENAGREF, 2012), translating to US$52/km2 annually. This revenue covered <10% of the management budget available to park authorities in 2011 (US$627/km2), which was heavily subsidized by the Benin government and international donor funding. Nonetheless, revenue in Pendjari has increased by 165% between 2006 and 2011 (CENAGREF, 2012), highlighting the potential of the park and adjacent hunting concessions to generate a large proportion of the park's total required budget. Currently, almost 2/3 of the annual revenue in the Pendjari block is generated by the hunting concessions adjacent to Pendjari NP; however, the steepest increase in revenues since 2006 came from photographic tourism inside the NP (CENAGREF, 2012). The reliance of revenue from hunting is even more pronounced on the Burkina Faso side, where the Arly and W NPs receive few photographic tourists, while the ca 7000 km2 of hunting blocks generated about US$42/km2 for the Burkinabe government in the hunting season 2005/2006 (IUCN/PACO, 2009); the turnover for the actual hunting concession holders was seven times this amount (US$296/km2). The overall management budgets realized in those concession areas were markedly higher than those for the W NPs in Niger and Benin, which likely explains the positive, though weak, relationship between lion occupancy and the presence of trophy hunting (Table 4).
While hunting concessions contribute sizable proportions of the revenues WAP currently generates for local authorities, it is challenging to reconcile the trophy hunting of this Critically Endangered lion population, particularly with Burkina Faso having the highest lion quotas per km2 of hunting concession of any African country (Lindsey et al., 2013b). Lion quotas have been reduced markedly in recent years in Benin, where the quota was halved from 10 to 5 animals in 2004, following a 2-year hunting moratorium in 2002 due to concerns about the species' status (Pellerin et al., 2009; Sogbohossou, 2011). Wildlife authorities in Benin and Burkina Faso have also committed to enforce age restrictions on lion hunting (Lindsey et al., 2013b), which can reduce off-takes and improve the sustainability of harvest (Whitman et al., 2004, 2007) if rigorously enforced. While these steps are laudable, it is likely that hunting remains additive to overall lion mortality given the prevalence of other anthropogenic threats (poisoning and poaching) across the ecosystem. In a series of stochastic population models projected over a 25-year period in a “realistic” scenario (within a protected national park and adjacent hunting areas in Zambia), lion numbers declined due to trophy hunting for all continuous harvest strategies; substantial declines resulted from quotas greater than ~0.5 lion/1000 km2 and hunting of males younger than 7 years (Creel et al., 2016). Furthermore, prior research on lion demography in WAP provided evidence of a heavily perturbed population with low recruitment even inside NPs, which the authors link to the presence of trophy hunting (Sogbohossou et al., 2014). The population currently lacks the sex and age structure typical of well protected populations (Stander, 1991; Creel and Creel, 1997), as it proportionally lacks adult females and younger cohorts (Sogbohossou et al., 2014).
Without considerable increases in revenue, the illegal grazing and concomitant poisoning and poaching of lions in national parks and hunting concessions throughout WAP will undoubtedly continue. A previous study suggests that management budgets (including staff salaries) of >US$2000/km2/year are required to maintain lions at 50% of ecological carrying capacity in unfenced protected areas (Packer et al. (2013). As permanent staff numbers and annual management budgets in our study were highly and significantly correlated (r = 0.89, p < 0.001), the annual management budget associated with staff levels at lion occupancy of 80% (Figure 3) was ~US$125/km2/year (Figure 6). In areas with lion occupancy close to 1, like in the southwestern part of WAP (Figure 5), staff numbers were >12.5 per 1000 km2, with concomitant management budgets >US$400/km2/year (Figures 3, 6).
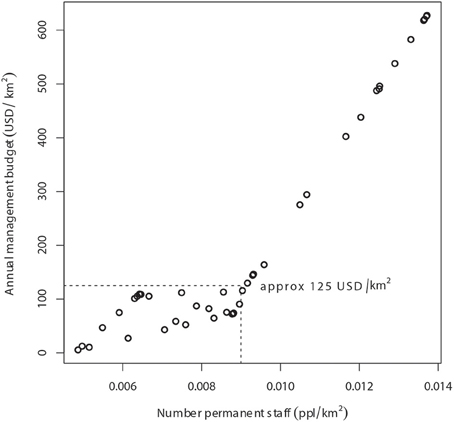
Figure 6. Relationship between annual management budget (USD/km2) and number of permanent staff per km2 in the WAP Complex. At the level of staffing that results in 80% probability of lion occupancy (9 persons per 1000 km2, or 0.009 persons per km2), annual management budget in WAP is approximately 125 USD/km2.
Estimated lion occupancy across WAP (0.71) is well below the expected minimum, considering the entire ecosystem consists of intact lion habitat. We therefore recommend that management budgets (excluding staff salaries) be elevated to an absolute minimum of US$125/km2/year across the entire WAP, with a proportional increase in permanent patrol staff numbers to 9 people/1000 km2, to provide sufficient protection to at least maintain resident lions. For the 27,000 km2 WAP, this translates to an annual management budget (excluding staff salaries) of just over US$3 million. While photographic and hunting tourism presently contributes to this goal, it falls well short of the target which relies on substantial and urgent investment by the international donor community. For any such investments, it will be crucial that adequate funding levels are sustained in the long-term to achieve desired outcomes (Smith et al., 2003; Blom et al., 2010).
In order to curb illegal incursions into PAs by pastoralists and the killing of lions and their prey, we believe urgent priority must be given to a dual strategy that focuses on increasing management budgets and the numbers and expertise of enforcement personnel across WAP. In the short-term, it is imperative that resources are directed toward improving the status of the tri-national W National Park. Without a continuous, well-funded effort to improve overall security and remove terrorists, illegal herders and poachers, W's lions will not recover, further imperiling the long-term viability of the entire WAP population. In the absence of maintaining security for tourists and increasing wildlife numbers in W, efforts to intensify and expand tourism operations across WAP as a sustainable source of income for PA management will also fail.
Author Contributions
Designed study PH, HR, and AT; Collected data PH, MK, and CS; Analyzed data LP, PH, and HR; Wrote the paper PH, LP, LH, and HR.
Funding
Funding for the survey was provided by Panthera and the National Geographic Society's Big Cat Initiative.
Conflict of Interest Statement
The authors declare that the research was conducted in the absence of any commercial or financial relationships that could be construed as a potential conflict of interest.
Acknowledgments
We would like to thank the respective wildlife authorities in the three countries and all hunting concessionaires for assisting efforts to conduct the present lion survey. We thank E. Kiantanga, H. Sebgo, O. Lompo in the Arly-Pendjari team and H. Boussiya, A. Toubga, T. Monsorgui in the W team for their assistance in the field. We are grateful to PAPE (Programme d'Appui aux Parcs de l'Entente), and in particular S. Mahamadou and J. de Winter, for logistical support, as well as to H. Garba, L. Hebie and I. Amahowe from WAP/UNOPS.
Supplementary Material
The Supplementary Material for this article can be found online at: https://www.frontiersin.org/article/10.3389/fevo.2016.00110
References
Alpers, D. L., Van Vuuren, B. J., Arctander, P., and Robinson, T. J. (2004). Population genetics of the roan antelope (Hippotragus equinus) with suggestions for conservation. Mol. Ecol. 13, 1771–1784. doi: 10.1111/j.1365-294X.2004.02204.x
Barnett, R., Yamaguchi, N., Shapiro, B., Ho, S. Y., Barnes, I., Sabin, R., et al. (2014). Revealing the maternal demographic history of Panthera leo using ancient DNA and a spatially explicit genealogical analysis. BMC Evol. Biol. 14:70. doi: 10.1186/1471-2148-14-70
Bartoń, K. (2016). MuMIn: Multi-Model Inference. Model Selection and Model Averaging Based on Information Criteria (AICc and alike). R package version 1.15.6. Available online at: https://CRAN.R-project.org/package=MuMIn
Bates, D., Mächler, M., Bolker, B., and Walker, S. (2014). Fitting linear mixed-effects models using lme4. arXiv 1406. 5823.
Bauer, H., Chapron, G., Nowell, K., Henschel, P., Funston, P., Hunter, L. T. B., et al. (2015a). Lion (Panthera leo) populations are declining rapidly across Africa, except in intensively managed areas. Proc. Natl. Acad. Sci. 112, 14894–14899. doi: 10.1073/pnas.1500664112
Bauer, H., Packer, C., Funston, P., Henschel, P., and Nowell, K. (2015b). “Panthera leo,” in The IUCN Red List of Threatened Species. Version 2015.2. Available online at: http://www.iucnredlist.org/details/15951/0 and http://www.iucnredlist.org/attachments/2309
Bauer, H., Vanherle, N., Di Silvestre, I., and De Iongh, H. H. (2008). Lion – prey relations in West and Central Africa. Mamm. Biol. 73, 70–73. doi: 10.1016/j.mambio.2006.11.006
Belbachir, F. (2008). “Acinonyx jubatus ssp. Hecki,” in IUCN 2011. IUCN Red List of Threatened Species. Version 2011.2. Available online at: www.iucnredlist.org
Bertola, L. D., Tensen, L., van Hooft, P., White, P. A., Driscoll, C. A., Henschel, P., et al. (2015). Autosomal and mtDNA markers affirm the distinctiveness of lions in west and Central Africa. PLoS ONE 10:e0137975. doi: 10.1371/journal.pone.0137975
Blom, B., Sunderland, T., and Murdiyarso, D. (2010). Getting REDD to work locally: lessons learned from integrated conservation and development projects. Environ. Sci. Policy 13, 164–172. doi: 10.1016/j.envsci.2010.01.002
Bouché, P. (2012). Inventaire Aérien de l'écosystème W-Arly-Pendjari, Mai-Juin 2012. Ouagadougou: CITES-MIKE, WAP/UNOPS.
Bouché, P., Douglas-Hamilton, I., Wittemyer, G., Nianogo, A. J., Doucet, J.-L., Lejeune, P., et al. (2011). Will elephants soon disappear from West African savannahs? PLoS ONE 6:e20619. doi: 10.1371/journal.pone.0020619
Bouché, P., Lungren, C. G., Hien, B., and Omondi, P. (2004). “Recensement aérien Total de l'Ecosystème W-Arly-Pendjari-Oti-Mandouri-Kéran (WAPOK).” CITES-MIKE, ECOPAS, PAUCOF. Available online at: http://www.cites.org/eng/prog/MIKE/index.shtml
Burnham, K. P. Anderson, D. R. (2004). Multimodel Inference: Understanding AIC and BIC in model selection. Sociol. Methods Res. 33, 261–304. Available online at: http://smr.sagepub.com
Carbone, C., and Gittleman, J. L. (2002). A common rule for the scaling of carnivore density. Science 295, 2273–2276. doi: 10.1126/science.1067994
Clements, H. S., Tambling, C. J., Hayward, M. W., and Kerley, G. I. (2014). An objective approach to determining the weight ranges of prey preferred by and accessible to the five large African carnivores. PLoS ONE 9:e101054. doi: 10.1371/journal.pone.0101054
Clerici, N., Bodini, A., Eva, H., Grégoire, J.-M., Dulieu, D., and Paolini, C. (2007). Increased isolation of two biosphere reserves and surrounding protected areas (WAP ecological complex, West Africa). J. Nat. Conserv. 15, 26–40. doi: 10.1016/j.jnc.2006.08.003
Coe, M. J., Cumming, D. H., and Phillipson, J. (1976). Biomass and production of large African herbivores in relation to rainfall and primary production. Oecologica 22, 341–354. doi: 10.1007/BF00345312
Craigie, I. D., Baillie, J. E. M., Balmford, A., Carbone, C., Collen, B., Green, R. E., et al. (2010). Large mammal population declines in Africa's protected areas. Biol. Conserv. 143, 2221–2228. doi: 10.1016/j.biocon.2010.06.007
Creel, S., and Creel, N. M. (1997). Lion density and population structure in the Selous Game Reserve: evaluation of hunting quotas and off-take. Afr. J. Ecol. 35, 83–93. doi: 10.1111/j.1365-2028.1997.062-89062.x
Creel, S., M'soka, J., Dröge, E., Rosenblatt, E., Becker, M., Matandiko, W., et al (2016). Assessing the sustainability of African lion trophy hunting, with recommendations for policy. Ecol. Appl. doi: 10.1002/eap.1377. [Epub ahead of print].
Croes, B. M., Funston, P. J., Rasmussen, G., Buij, R., Saleh, A., Tumenta, P. N., et al. (2011). The impact of trophy hunting on lions (Panthera leo) and other large carnivores in the Bénoué Complex, northern Cameroon. Biol. Conserv. 144, 3064–3072. doi: 10.1016/j.biocon.2011.09.013
DiMiceli, C., Carroll, M., Sohlberg, R., Huang, C., Hansen, M., and Townshend, J. (2011). Annual Global Automated MODIS Vegetation Continuous Fields (MOD44B) at 250 m Spatial Resolution for Data Years Beginning Day 65, 2000-2010, Collection 5 Percent Tree Cover. College Park, MD: University of Maryland.
Douglas, L. R., and Alie, K. (2014). High-value natural resources: linking wildlife conservation to international conflict, insecurity, and development concerns. Biol. Conserv. 171, 270–277. doi: 10.1016/j.biocon.2014.01.031
Dulieu, D. (2004). “La végétation du Complexe WAP,” in Les Grands Mammifères du Complexe WAP, ed F. Lamarque (Ouagadougou: ECOPAS), 16–24.
Durant, S. M., Craft, M. E., Hilborn, R., Bashir, S., Hando, J., and Thomas, L. (2011). Long-term trends in carnivore abundance using distance sampling in Serengeti National Park, Tanzania. J. Appl. Ecol. 48, 1490–1500. doi: 10.1111/j.1365-2664.2011.02042.x
East, R. (1984). Rainfall, soil nutrient status and biomass of large African savanna mammals. Afr. J. Ecol. 22, 245–270. doi: 10.1111/j.1365-2028.1984.tb00700.x
Everatt, K. T., Andresen, L., and Somers, M. J. (2014). Trophic scaling and occupancy analysis reveals a lion population limited by top-down anthropogenic pressure in the Limpopo National Park, Mozambique. PLoS ONE 9:e99389. doi: 10.1371/journal.pone.0099389
Everatt, K. T., Andresen, L., and Somers, M. J. (2015). The influence of prey, pastoralism and poaching on the hierarchical use of habitat by an apex predator. Afr. J. Wildl. Res. 45, 187–196. doi: 10.3957/056.045.0187
Ferreira, S. M., Govender, D., and Herbst, M. (2013). Conservation implications of Kalahari lion population dynamics. Afr. J. Ecol. 51, 176–179. doi: 10.1111/aje.12003
Fiske, I., and Chandler, R. (2011). unmarked: an R package for fitting hierarchical models of wildlife occurrence and abundance. J. Stat. Softw. 43, 1–23. doi: 10.18637/jss.v043.i10
Funston, P. J., Frank, L., Stephens, T., Davidson, Z., Loveridge, A., Macdonald, D. M., et al. (2010). Substrate and species constraints on the use of track incidences to estimate African large carnivore abundance. J. Zool. 281, 56–65. doi: 10.1111/j.1469-7998.2009.00682.x
Green, S. B. (1991). How many subjects does it take to do a regression analysis. Multivariate Behav. Res. 26, 499–510. doi: 10.1207/s15327906mbr2603_7
Hayward, M. W., and Kerley, G. I. H. (2005). Prey preferences of the lion (Panthera leo). J. Zoolog. Lond. 267, 309–322. doi: 10.1017/S0952836905007508
Hayward, M. W., O'Brien, J., and Kerley, G. I. H. (2007). Carrying capacity of large African predators: predictions and tests. Biol. Conserv. 139, 219–229. doi: 10.1016/j.biocon.2007.06.018
Henschel, P., Azani, D., Burton, C., Malanda, G., Saidu, Y., Sam, M., et al. (2010). Lion status updates from five range countries in West and Central Africa. Cat. News 52, 34–39. Available online at: http://www.catsg.org/
Henschel, P., Bauer, H., Sogbohossou, E., and Nowell, K. (2015). “Panthera leo (West Africa subpopulation),” in The IUCN Red List of Threatened Species. Version 2015.2. Available online at: http://www.iucnredlist.org/details/68933833/0
Henschel, P., Coad, L., Burton, C., Chataigner, B., Dunn, A., MacDonald, D., et al. (2014). The lion in West Africa is critically endangered. PLoS ONE 9:e83500. doi: 10.1371/journal.pone.0083500
Henschel, P., Kiki, M., Sewade, C., and Tehou, A. (2012). Improving the Status of Lions and Cheetahs in their Last Stronghold in West Africa: The W-Arly-Pendjari Complex. New York, NY: Panthera.
Hijmans, R. J., Cameron, S. E., Parra, J. L., Jones, P. G., and Jarvis, A. (2005). Very high resolution interpolated climate surfaces for global land areas. Int. J. Climatol. 25, 1965–1978. doi: 10.1002/joc.1276
Hines, J. E., Nichols, J. D., Royle, J. A., MacKenzie, D. I., Gopalaswamy, A. M., Kumar, N. S., et al. (2010). Tigers on trails: occupancy modeling for cluster sampling. Ecol. Appl. 20, 1456–1466. doi: 10.1890/09-0321.1
Hockings, M. (2003). Systems for assessing the effectiveness of management in protected areas. Bioscience 53, 823–832. doi: 10.1641/0006-3568(2003)053[0823:SFATEO]2.0.CO;2
Hopcraft, J. G. C., Sinclair, A. R. E., and Packer, C. (2005). Planning for success: serengeti lions seek prey accessibility rather than abundance. J. Anim. Ecol. 74, 559–566. doi: 10.1111/j.1365-2656.2005.00955.x
IUCN/PACO (2009). La Grande Chasse en Afrique de l'Ouest: Quelle Contribution à la Conservation? Ouagadougou: IUCN/PACO.
Jachmann, H. (2008). Monitoring law-enforcement performance in nine protected areas in Ghana. Biol. Conserv. 141, 89–99. doi: 10.1016/j.biocon.2007.09.012
Ji, L., Zhang, L., and Wylie, B. (2009). Analysis of dynamic thresholds for the normalized difference water index. Photogrammet. Eng. Remote Sens. 75, 1307–1317. Available online at: http://www.asprs.org/Photogrammetric-Engineering-and-Remote-Sensing/PE-RS-Journals.html
Karanth, K. U., Gopalaswamy, A. M., Kumar, N. S., Vaidyanathan, S., Nichols, J. D., and MacKenzie, D. I. (2011). Monitoring carnivore populations at the landscape scale: occupancy modelling of tigers from sign surveys. J. Appl. Ecol. 48, 1048–1056. doi: 10.1111/j.1365-2664.2011.02002.x
Ladan, S. I. (2014). Forests and forest reserves as security threats in northern Nigeria. Eur. Sci. J. 10, 120–142. Available online at: http://eujournal.org
Leverington, F., Costa, K. L., Courrau, J., Pavese, H., Nolte, C., Marr, M., et al. (2010). Management Effectiveness Evaluation in Protected Areas: A Global Study, 2nd Edn. Gaton: University of Queensland; IUCN- WCPA, TNC, WWF.
Lindsey, P. A., Balme, G. A., Funston, P., Henschel, P., Hunter, L., Madzikanda, H., et al. (2013b). The trophy hunting of african lions: scale, current management practices and factors undermining sustainability. PLoS ONE 8:e73808. doi: 10.1371/journal.pone.0073808
Lindsey, P. A., Balme, G., Becker, M., Begg, C., Bento, C., Bocchino, C., et al. (2013a). The bushmeat trade in African savannas: impacts, drivers, and possible solutions. Biol. Conserv. 160, 80–96. doi: 10.1016/j.biocon.2012.12.020
Lindsey, P. A., Nyirenda, V. R., Barnes, J. I., Becker, M. S., McRobb, R., Tambling, C. J., et al. (2014). Underperformance of African protected area networks and the case for new conservation models: insights from Zambia. PLoS ONE 9:e94109. doi: 10.1371/journal.pone.0094109
Linkie, M., Chapron, G., Martyr, D. J., Holden, J., and Leader-Williams, N. (2006). Assessing the viability of tiger subpopulations in a fragmented landscape. J. Appl. Ecol. 43, 576–586. doi: 10.1111/j.1365-2664.2006.01153.x
Loveridge, A., and Canney, S. (2009). African Lion Distribution Modelling Project. Final Report, Born Free Foundation, Horsham.
MacKenzie, D. I., and Bailey, L. L. (2004). Assessing the fit of site-occupancy models. J. Agric. Biol. Environ. Stat. 9, 300–318. doi: 10.1198/108571104X3361
MacKenzie, D. I., Nichols, J. D., Lachman, G. B., Droege, S., Royle, J. A., and Langtimm, C. A. (2002). Estimating site occupancy rates when detection probabilities are less than one. Ecology 83, 2248–2255. doi: 10.1890/0012-9658(2002)083[2248:ESORWD]2.0.CO;2
MacKenzie, D. I., Nichols, J. D., Royle, J. A., Pollock, K. H., Bailey, L. L., and Hines, J. E. (2006). Occupancy Estimation and Modeling: Inferring Patterns and Dynamics of Species Occurrence. San Diego, CA: Elsevier Academic Press.
Mazerolle, M. (2015). AICcmodavg: Model Selection and Multimodel Inference Based on (Q) AIC (c). R package version 2.0-3.
McFeeters, S. K. (1996). The use of the normalized difference water index (NDWI) in the delineation of open water features. Int. J. Remote Sens. 17, 1425–1432. doi: 10.1080/01431169608948714
McKenzie, H. W., Merrill, E. H., Spiteri, R. J., and Lewis, M. A. (2012). How linear features alter predator movement and the functional response. Interface Focus 2, 205–216. doi: 10.1098/rsfs.2011.0086
Mosser, A., Fryxell, J. M., Eberly, L., and Packer, C. (2009). Serengeti real estate: density vs. fitness-based indicators of lion habitat quality. Ecol. Lett. 12, 1050–1060. doi: 10.1111/j.1461-0248.2009.01359.x
Naughton-Treves, L., Holland, M. B., and Brandon, K. (2005). The role of protected areas in conserving biodiversity and sustaining local livelihoods. Annu. Rev. Environ. Resour. 30, 219–252. doi: 10.1146/annurev.energy.30.050504.164507
Ogutu, J. O., and Dublin, H. T. (1998). The response of lions and spotted hyaenas to sound playbacks as a technique for estimating population size. Afr. J. Ecol. 36, 83–95. doi: 10.1046/j.1365-2028.1998.113-89113.x
Oindo, B. O., and Skidmore, A. K. (2002). Interannual variability of NDVI and species richness in Kenya. Int. J. Remote Sens. 23, 285–298. doi: 10.1080/01431160010014819
Packer, C., Loveridge, A., Canney, S., Caro, T., Garnett, S. T., Pfeifer, M., et al. (2013). Conserving large carnivores: dollars and fence. Ecol. Lett. 16, 635–641. doi: 10.1111/ele.12091
Pellerin, M., Kidjo, F., Téhou, A., Sogbohossou, E., Ayégnon, D., and Chardonnet, P. (2009). Statut de conservation du lion (Panthera leo) au Bénin. Cotonou: Fondation IGF and CENAGREF.
Prins, H. H. (2000). “Competition between wildlife and livestock in Africa,” in Wildlife Conservation by Sustainable Use, eds H. Prins, J. G. Grootenhuis, and T. T. Dolan (Boston: Springer), 51–80.
R Core Team (2013). R: A Language and Environment for Statistical Computing. Vienna: R Foundation for Statistical Computing.
Sinsin, B., Tehou, A., Daouda, I., and Saidou, A. (2002). Abundance and species richness of larger mammals in Pendjari National Park in Benin. Mammalia 66, 369–380. doi: 10.1515/mamm.2002.66.3.369
Smith, R., Muir, R., Walpole, M., Balmford, A., and Leader-Williams, N. (2003). Governance and the loss of biodiversity. Nature 426, 67–70. doi: 10.1038/nature02025
Sogbohossou, E. (2011). Lions of West Africa: Ecology of Lion (Panthera leo Linnaeus 1975) Populations and Human-Lion Conflicts in Pendjari Biosphere Reserve. PhD PhD-thesis, Leiden University.
Sogbohossou, E. A., Bauer, H., Loveridge, A., Funston, P. J., De Snoo, G. R., Sinsin, B., et al. (2014). Social structure of lions (Panthera leo) is affected by management in Pendjari Biosphere Reserve, Benin. PLoS ONE 9:e84674. doi: 10.1371/journal.pone.0084674
Stander, P. E. (1998). Spoor counts as indices of large carnivore populations: the relationship between spoor frequency, sampling effort and true density. J. Appl. Ecol. 35, 378–385. doi: 10.1046/j.1365-2664.1998.00313.x
Stoner, C., Caro, T., Mduma, S., Mlingwa, C., Sabuni, G., Borner, M., et al. (2007). Changes in large herbivore populations across large areas of Tanzania. Afr. J. Ecol. 45, 202–215. doi: 10.1111/j.1365-2028.2006.00705.x
Stuart, C., and Stuart, T. (2003). A Field Guide to the Tracks and Signs of Southern and East African Wildlife. Cape Town: Struik Publishers.
Thorn, M., Green, M., Bateman, P. W., Cameron, E. Z., Yarnell, R. W., and Scott, D. M. (2010). Comparative efficacy of sign surveys, spotlighting and audio playbacks in a landscape-scale carnivore survey. S. Afr. J. Wildl. Res. 40, 77–86. doi: 10.3957/056.040.0113
Valeix, M., Loveridge, A. J., Davidson, Z., Madzikanda, H., Fritz, H., and Macdonald, D. W. (2010). How key habitat features influence large terrestrial carnivore movements: waterholes and African lions in a semi-arid savanna of north-western Zimbabwe. Landsc. Ecol. 25, 337–351. doi: 10.1007/s10980-009-9425-x
Van Orsdol, K. G., Hanby, J. P., and Bygott, J. D. (1985). Ecological correlates of lion social organization (Panthera leo). J. Zool. Lond. 206, 97–112. doi: 10.1111/j.1469-7998.1985.tb05639.x
Whitman, K. L., Starfield, A. M., Quadling, H., and Packer, C. (2007). Modeling the effects of trophy selection and environmental disturbance on a simulated population of African lions. Conserv. Biol. 21, 591–601. doi: 10.1111/j.1523-1739.2007.00700.x
Whitman, K., Starfield, A. M., Quadling, H. S., and Packer, C. (2004). Sustainable trophy hunting of African lions. Nature 428, 175–178. doi: 10.1038/nature02395
Wikramanayake, E. D., Dinerstein, E., Robinson, J. G., Karanth, U., Rabinowitz, A., Olson, D., et al. (1998). An ecology-based method for defining priorities for large mammal conservation: the tiger as case study. Conserv. Biol. 12, 865–878. doi: 10.1046/j.1523-1739.1998.96428.x
Keywords: West Africa, protected areas, staff, trophy hunting, occupancy models
Citation: Henschel P, Petracca LS, Hunter LTB, Kiki M, Sewadé C, Tehou A and Robinson HS (2016) Determinants of Distribution Patterns and Management Needs in a Critically Endangered Lion Panthera leo Population. Front. Ecol. Evol. 4:110. doi: 10.3389/fevo.2016.00110
Received: 24 February 2016; Accepted: 30 August 2016;
Published: 16 September 2016.
Edited by:
Matt W. Hayward, Bangor University, UKReviewed by:
Craig John Tambling, University of Fort Hare, South AfricaRobert A. Montgomery, Michigan State University, USA
Philippe Bouché, University of Liège Gemblous Agro-Bio Tech, Burkina Faso
Copyright © 2016 Henschel, Petracca, Hunter, Kiki, Sewadé, Tehou and Robinson. This is an open-access article distributed under the terms of the Creative Commons Attribution License (CC BY). The use, distribution or reproduction in other forums is permitted, provided the original author(s) or licensor are credited and that the original publication in this journal is cited, in accordance with accepted academic practice. No use, distribution or reproduction is permitted which does not comply with these terms.
*Correspondence: Lisanne S. Petracca, lpetracca@panthera.org