
Assessing Greenhouse Gas Emissions and Health Co-Benefits: A Structured Review of Lifestyle-Related Climate Change Mitigation Strategies


Abstract
:1. Introduction
2. Methods
2.1. Selection of Articles for Review
2.1.1. Literature Search
2.1.2. Inclusion Criteria
2.2. Data Extraction
3. Results
3.1. Article Retrieval
3.1.1. Active Transport Article Retrieval
3.1.2. Diet Article Retrieval
3.2. Active Transport—Summary of Findings
3.3. Diet—Summary of Findings
3.4. Analysis of Biases, Limitations, and Uncertainties—Rubric Scores
3.4.1. Health-Related Biases, Limitations, and Uncertainties Rubric Scores
3.4.2. GHGE-Related Biases, Limitations, and Uncertainties Rubric Scores
4. Discussion
4.1. Analysis of Active Transport Article Findings
4.2. Analysis of Diet Article Findings
4.3. Analysis of Biases, Limitations, and Uncertainties
4.3.1. GHGE
4.3.2. Active Transport
4.3.3. Diet
4.3.4. Methodological Issues
5. Conclusions
5.1. Implications for Research
5.2. Guidelines, Advice for Policy Makers
Supplementary Materials
Acknowledgments
Author Contributions
Conflicts of Interest
Abbreviations
| GHGE | Greenhouse Gas Emissions |
| IPCC | Intergovernmental Panel on Climate Change |
| CO2 | carbon dioxide |
| METs | Metabolic Equivalent of Task |
| DALYs | Disability-Adjusted Life Years |
| LCAs | Lifecycle Assessments |
| OECD | Organization for Economic Co-operation and Development |
References
- An Action Agenda for Sustainable Development. Available online: http://unsdsn.org/resources/goals-and-targets/ (accessed on 18 August 2015).
- IPCC. Summary for policymakers. In Climate Change 2014: Impacts, Adaptation, and Vulnerability. Part A: Global and Sectoral Aspects. Contribution of Working Group II to the Fifth Assessment Report of the Intergovernmental Panel on Climate Change; Field, C.B., Barros, V.R., Dokken, D.J., Mach, K.J., Mastrandrea, M.D., Bilir, T.E., Chatterjee, M., Ebi, K.L., Estrada, Y.O., Genova, R.C., et al., Eds.; Cambridge University Press: Cambridge, UK; New York, NY, USA, 2014; pp. 1–32. [Google Scholar]
- Sources of Greenhouse Gas Emissions. Available online: http://www.epa.gov/climatechange/ghgemissions/sources.html (accessed on 18 August 2015).
- IPCC. Summary for Policymakers. In Climate Change 2014, Mitigation of Climate Change. Contribution of Working Group III to the Fifth Assessment Report of the Intergovernmental Panel on Climate Change; Pichs-Madruga, O.R., Sokona, Y., Farahani, E., Kadner, S., Seyboth, K., Adler, A., Baum, I., Brunner, S., Eickemeier, P., Kriemann, B., et al., Eds.; Cambridge University Press: Cambridge, UK; New York, NY, USA, 2014. [Google Scholar]
- Whitmarsh, L.; Seyfang, G.; O’Neill, S. Public engagement with carbon and climate change: To what extent is the public “carbon capable”? Glob. Environ. Chang. 2011, 21, 56–65. [Google Scholar] [CrossRef]
- Hallal, P.C.; Andersen, L.B.; Bull, F.C.; Guthold, R.; Haskell, W.; Ekelund, U. Global physical activity levels: Surveillance progress, pitfalls, and prospects. Lancet 2012, 380, 247–257. [Google Scholar] [CrossRef]
- Lock, K.; Pomerleau, J.; Causer, L.; Altmann, D.R.; McKee, M. The global burden of disease attributable to low consumption of fruit and vegetables: Implications for the global strategy on diet. Bull. World Health Organ. 2005, 83, 100–108. [Google Scholar] [PubMed]
- World Health Organization (WHO). Global Health Risks: Mortality and Burden of Disease Attributable to Selected Major Risks; World Health Organization: Geneva, Switzerland, 2009. [Google Scholar]
- Yip, C.S.C.; Crane, G.; Karnon, J. Systematic review of reducing population meat consumption to reduce greenhouse gas emissions and obtain health benefits: Effectiveness and models assessments. Int. J. Public Health 2013, 58, 683–693. [Google Scholar] [CrossRef] [PubMed]
- Xia, T.; Zhang, Y.; Crabb, S.; Shah, P. Cobenefits of replacing car trips with alternative transportation: A review of evidence and methodological issues. J. Environ. Public Health 2013, 2013, 797312. [Google Scholar] [CrossRef] [PubMed]
- Michaelowa, A.; Dransfeld, B. Greenhouse gas benefits of fighting obesity. Ecol. Econ. 2008, 66, 298–308. [Google Scholar] [CrossRef]
- Grabow, M.L.; Spak, S.N.; Holloway, T.; Stone, B., Jr.; Mednick, A.C.; Patz, J.A. Air quality and exercise-related health benefits from reduced car travel in the midwestern United States. Environ. Health Perspect. 2012, 120, 68. [Google Scholar] [CrossRef] [PubMed]
- Lindsay, G.; Macmillan, A.; Woodward, A. Moving urban trips from cars to bicycles: Impact on health and emissions. Aust. N. Z. J. Public Health 2011, 35, 54–60. [Google Scholar] [CrossRef] [PubMed]
- Macmillan, A.; Connor, J.; Witten, K.; Kearns, R.; Rees, D.; Woodward, A. The societal costs and benefits of commuter bicycling: Simulating the effects of specific policies using system dynamics modeling. Environ. Health Perspect. 2014, 122, 335. [Google Scholar] [CrossRef] [PubMed]
- Maizlish, N.; Woodcock, J.; Co, S.; Ostro, B.; Fanai, A.; Fairley, D. Health cobenefits and transportation-related reductions in greenhouse gas emissions in the San Francisco Bay area. Am. J. Public Health 2013, 103, 703–709. [Google Scholar] [CrossRef] [PubMed]
- Rabl, A.; De Nazelle, A. Benefits of shift from car to active transport. Transp. Policy 2012, 19, 121–131. [Google Scholar] [CrossRef]
- Rojas-Rueda, D.; De Nazelle, A.; Teixidó, O.; Nieuwenhuijsen, M. Replacing car trips by increasing bike and public transport in the greater Barcelona metropolitan area: A health impact assessment study. Environ. Int. 2012, 49, 100–109. [Google Scholar] [CrossRef] [PubMed]
- Woodcock, J.; Edwards, P.; Tonne, C.; Armstrong, B.G.; Ashiru, O.; Banister, D.; Beevers, S.; Chalabi, Z.; Chowdhury, Z.; Cohen, A. Public health benefits of strategies to reduce greenhouse-gas emissions: Urban land transport. Lancet 2009, 374, 1930–1943. [Google Scholar] [CrossRef]
- Aston, L.M.; Smith, J.N.; Powles, J.W. Impact of a reduced red and processed meat dietary pattern on disease risks and greenhouse gas emissions in the UK: A modelling study. BMJ Open 2012, 2, e001072. [Google Scholar] [CrossRef] [PubMed]
- Berners-Lee, M.; Hoolohan, C.; Cammack, H.; Hewitt, C. The relative greenhouse gas impacts of realistic dietary choices. Energy Policy 2012, 43, 184–190. [Google Scholar] [CrossRef]
- Biesbroek, S.; Bueno-de-Mesquita, H.B.; Peeters, P.H.; Verschuren, W.M.; van der Schouw, Y.T.; Kramer, G.F.; Tyszler, M.; Temme, E.H. Reducing our environmental footprint and improving our health: Greenhouse gas emission and land use of usual diet and mortality in EPIC-NL: A prospective cohort study. Environ. Health 2014, 13, 27. [Google Scholar] [CrossRef] [PubMed]
- Briggs, A.D.; Kehlbacher, A.; Tiffin, R.; Garnett, T.; Rayner, M.; Scarborough, P. Assessing the impact on chronic disease of incorporating the societal cost of greenhouse gases into the price of food: An econometric and comparative risk assessment modelling study. BMJ Open 2013, 3, e003543. [Google Scholar] [CrossRef] [PubMed]
- De Carvalho, A.M.; Cesar, C.L.; Fisberg, R.M.; Marchioni, D.M. Excessive meat consumption in Brazil: Diet quality and environmental impacts. Public Health Nutr. 2013, 16, 1893–1899. [Google Scholar] [CrossRef] [PubMed]
- Edjabou, L.D.; Smed, S. The effect of using consumption taxes on foods to promote climate friendly diets–The case of Denmark. Food Policy 2013, 39, 84–96. [Google Scholar] [CrossRef]
- Friel, S.; Dangour, A.D.; Garnett, T.; Lock, K.; Chalabi, Z.; Roberts, I.; Butler, A.; Butler, C.D.; Waage, J.; McMichael, A.J. Public health benefits of strategies to reduce greenhouse-gas emissions: Food and agriculture. Lancet 2009, 374, 2016–2025. [Google Scholar] [CrossRef]
- González, A.D.; Frostell, B.; Carlsson-Kanyama, A. Protein efficiency per unit energy and per unit greenhouse gas emissions: Potential contribution of diet choices to climate change mitigation. Food Policy 2011, 36, 562–570. [Google Scholar] [CrossRef]
- Hallström, E.; Röös, E.; Börjesson, P. Sustainable meat consumption: A quantitative analysis of nutritional intake, greenhouse gas emissions and land use from a Swedish perspective. Food Policy 2014, 47, 81–90. [Google Scholar] [CrossRef]
- Hendrie, G.A.; Ridoutt, B.G.; Wiedmann, T.O.; Noakes, M. Greenhouse Gas Emissions and the Australian Diet—Comparing Dietary Recommendations with Average Intakes. Nutrients 2014, 6, 289–303. [Google Scholar] [CrossRef] [PubMed]
- Hoolohan, C.; Berners-Lee, M.; McKinstry-West, J.; Hewitt, C. Mitigating the greenhouse gas emissions embodied in food through realistic consumer choices. Energy Policy 2013, 63, 1065–1074. [Google Scholar] [CrossRef]
- Macdiarmid, J.I.; Kyle, J.; Horgan, G.W.; Loe, J.; Fyfe, C.; Johnstone, A.; McNeill, G. Sustainable diets for the future: Can we contribute to reducing greenhouse gas emissions by eating a healthy diet? Am. J. Clin. Nutr. 2012, 96, 632–639. [Google Scholar] [CrossRef] [PubMed]
- Masset, G.; Soler, L.-G.; Vieux, F.; Darmon, N. Identifying sustainable foods: The relationship between environmental impact, nutritional quality, and prices of foods representative of the French diet. J. Acad. Nutr. Diet. 2014, 114, 862–869. [Google Scholar] [CrossRef] [PubMed]
- Pairotti, M.B.; Cerutti, A.K.; Martini, F.; Vesce, E.; Padovan, D.; Beltramo, R. Energy consumption and GHG emission of the Mediterranean diet: A systemic assessment using a hybrid LCA-IO method. J. Clean. Prod. 2015, 103, 507–516. [Google Scholar] [CrossRef]
- Saxe, H.; Larsen, T.M.; Mogensen, L. The global warming potential of two healthy nordic diets compared with the average danish diet. Clim. Chang. 2013, 116, 249–262. [Google Scholar] [CrossRef]
- Scarborough, P.; Allender, S.; Clarke, D.; Wickramasinghe, K.; Rayner, M. Modelling the health impact of environmentally sustainable dietary scenarios in the UK. Eur. J. Clin. Nutr. 2012, 66, 710–715. [Google Scholar] [CrossRef] [PubMed]
- Tukker, A.; Goldbohm, R.A.; De Koning, A.; Verheijden, M.; Kleijn, R.; Wolf, O.; Pérez-Domínguez, I.; Rueda-Cantuche, J.M. Environmental impacts of changes to healthier diets in Europe. Ecol. Econ. 2011, 70, 1776–1788. [Google Scholar] [CrossRef]
- Van Dooren, C.; Marinussen, M.; Blonk, H.; Aiking, H.; Vellinga, P. Exploring dietary guidelines based on ecological and nutritional values: A comparison of six dietary patterns. Food Policy 2014, 44, 36–46. [Google Scholar] [CrossRef]
- Vieux, F.; Darmon, N.; Touazi, D.; Soler, L.G. Greenhouse gas emissions of self-selected individual diets in France: Changing the diet structure or consuming less? Ecol. Econ. 2012, 75, 91–101. [Google Scholar] [CrossRef]
- Wallén, A.; Brandt, N.; Wennersten, R. Does the swedish consumer’s choice of food influence greenhouse gas emissions? Environ. Sci. Policy 2004, 7, 525–535. [Google Scholar] [CrossRef]
- Westhoek, H.; Lesschen, J.P.; Rood, T.; Wagner, S.; De Marco, A.; Murphy-Bokern, D.; Leip, A.; van Grinsven, H.; Sutton, M.A.; Oenema, O. Food choices, health and environment: Effects of cutting Europe’s meat and dairy intake. Glob. Environ. Chang. 2014, 26, 196–205. [Google Scholar] [CrossRef]
- Wilson, N.; Nghiem, N.; Mhurchu, C.N.; Eyles, H.; Baker, M.G.; Blakely, T. Foods and dietary patterns that are healthy, low-cost, and environmentally sustainable: A case study of optimization modeling for New Zealand. PLoS ONE 2013, 8, e59648. [Google Scholar] [CrossRef] [PubMed]
- Woodcock, J.; Givoni, M.; Morgan, A.S. Health impact modelling of active travel visions for England and Wales using an Integrated Transport and Health Impact Modelling tool (ITHIM). PLoS ONE 2013, 8, e51462. [Google Scholar] [CrossRef] [PubMed]
- Andersen, Z.J.; de Nazelle, A.; Mendez, M.A.; Garcia-Aymerich, J.; Hertel, O.; Tjønneland, A.; Overvad, K.; Raaschou-Nielsen, O.; Nieuwenhuijsen, M.J. A Study of the Combined Effects of Physical Activity and Air Pollution on Mortality in Elderly Urban Residents: The Danish Diet, Cancer, and Health Cohort. Environ. Health Perspect. 2015, 123, 557. [Google Scholar] [CrossRef] [PubMed]
- Food and Agriculture Organization of the United Nations-FAO. Sustainable Diets and Biodiversity: Directions and Solutions for Policy, Research and Action. In Proceedings of the International Scientific Symposium: Biodiversity and Sustainable Diets United Against Hunger, Rome, Italy, 3–5 November 2010; Food and Agriculture Organization of the United Nations: Rome, Italy, 2010. [Google Scholar]
- Remais, J.V.; Hess, J.J.; Ebi, K.L.; Markandya, A.; Balbus, J.M.; Wilkinson, P.; Haines, A.; Chalabi, Z. Estimating the health effects of greenhouse gas mitigation strategies: Addressing parametric, model, and valuation challenges. Environ. Health Perspect. 2014, 122, 447. [Google Scholar] [CrossRef] [PubMed]
- Tucker, P.; Gilliland, J. The effect of season and weather on physical activity: A systematic review. Public Health 2007, 121, 909–922. [Google Scholar] [CrossRef] [PubMed]
- Wanner, M.; Götschi, T.; Martin-Diener, E.; Kahlmeier, S.; Martin, B.W. Active transport, physical activity, and body weight in adults: A systematic review. Am. J. Prev. Med. 2012, 42, 493–502. [Google Scholar] [CrossRef] [PubMed]
- Cohen, A.J.; Anderson, H.R.; Ostro, B.; Dev Pandey, K.; Krzyzanowski, M.; Künzli, N.; Gutschmidt, K.; Pope, C.A.; Romieu, I.; Samet, J.M.; et al. Urban air pollution. In Comparative Quantification of Health Risks: Global and Regional Burden of Disease Attributable to Selected Major Risk Factors; Ezzati, M., Lopez, A.D., Rodgers, A., Murray, C.J.L., Eds.; World Health Organization: Geneva, Switzerland, 2004; Volume 1, pp. 1353–1434. [Google Scholar]
- McMichael, A.J.; Powles, J.W.; Butler, C.D.; Uauy, R. Food, livestock production, energy, climate change, and health. Lancet 2007, 370, 1253–1263. [Google Scholar] [CrossRef]


| Criteria for the General Category | |
|---|---|
| 1. | Acknowledges uncertainty in the feasibility of dietary or transportation shift within the population |
| 2. | Acknowledges uncertainties in factors and unit measures used in the analysis |
| 3. | Recognizes uncertainties in factors and values used in the analysis are subject to change over time |
| 4. | Acknowledges uncertainties of outcomes |
| 5. | Uncertainties identified were subject to appropriate sensitivity analysis |
| Criteria for the Emissions Category | |
| 1. | Emissions factors account for most life cycle stages |
| 2. | Emissions factors included are appropriate and include more than carbon dioxide |
| 3. | Acknowledges modeling errors for emissions factors |
| 4. | Emissions factors and indicators are selected for the appropriate geographic location |
| 5. | Acknowledges possibility of unintended emissions outcomes |
| Criteria for the Health Category | |
| 1. | Acknowledges uncertainties in baseline data |
| 2. | Acknowledges uncertainties in modeled relationship between exposures and health outcomes |
| 3. | Acknowledges uncertainties and complexities in nutrient/physical activity’s impact on health outcomes |
| 4. | Acknowledges possibility for other, unintended health outcomes |
| 5. | Indication of generalizability of the health outcome in terms of the population demographic characteristics |
| 6. | Indication of generalizability of the health outcome in terms of population dietary/transport characteristics |
| 7. | Acknowledges the possibility of residual confounding associated with the meta-analysis derived parameters |
| 8. | Indicated uncertainty concerning the time needed for health effects to be observed |
| 9. | Indicated possibility of double counting or over estimating effects |
| 10. | Indicated that dietary/transport shifts will affect the health of some groups more than others |
| Authors, [Reference], Year, Location | Emissions Outcome | Emissions Reduction in CO2 eq (% Reduction) | Health-Linked Outcome |
|---|---|---|---|
| Lifestyle-Related Mitigation Strategy—ACTIVE TRANSPORT | |||
| Grabow et al. [12], 2012 Midwest US | O3, PM2.5 | 1.8 tetragrams/year (20% reduction in vehicle emissions) | Morbidity, Mortality |
| Lindsay et al. [13], 2011 NZ | CO2 eq | 8695 tonnes/year (30% shift of short-distance car trips to bicycle) | Morbidity, Mortality |
| Macmillan et al. [14], NZ | CO2 eq | 26 Mt/year (35% of transport moves from car to bicycle) | Morbidity and Mortality |
| Maizlish et al. [15], 2013 San Francisco, CA, USA | CO2, PM2.5 | 4.04 million tons/year (14% reduction in transportation emissions) | DALYs |
| Michaelowa & Dransfeld, [11], 2008 OECD | CO2 | 100 Mt/year (N/A) | Weight Gain |
| Rabl & de Nazelle, [16], 2012 Europe | CO2 eq | 1 tonnes/person/year (N/A) | Mortality |
| Rojas-Rueda et al. [17], 2012 Spain | CO2, PM2.5 | 203,251 tons/year (40% fewer car trips) | All-cause Mortality |
| Woodcock et al. [18], 2009 UK & India | CO2, PM2.5 | 0.35–0.48 tonnes/person/year (46.7–56% reduction in transport emissions) | DALYs |
| Woodcock et al. [15], 2013 UK | CO2 | 16 Mt–50 Mt/person (26–73% reduction in transport emissions) | Morbidity and Mortality |
| Lifestyle-Related Mitigation Strategy—DIET | |||
| Aston et al. [19], 2012 UK | CO2 eq | 27.8 Mt/year (3% current country total) | DALYs |
| Berners-Lee et al. [20], 2012 UK | CO2 eq | 40 Mt/year (22–26% reduction in diet-related emissions) | Caloric and Nutrient Requirements |
| Biesbroek et al. [21], 2014 Dutch | CO2 eq | 155.4 kg/person/year (4–12% of diet-related emissions) | Mortality |
| Briggs et al. [22], 2013 UK | CO2 eq | 18.683 Mt/year (40% reduction of agricultural emissions) | Mortality |
| de Carvalho et al. [23], 2013 Brazil | CO2 eq | 9.035 Mt/year (50% of meat production-related emissions) | Caloric and Nutrient Requirements |
| Edjabou & Smed, [24], 2013 Denmark | CO2 eq | 112 kg/person/year (4–7.9%) | Caloric and Nutrient Requirements |
| Friel et al. [25], 2009 UK/Brazil | CO2 eq | 9 Mt/year (30% of livestock production emissions) | DALYs |
| González et al. [26], 2011 Sweden | CO2 eq | N/A | Protein Consumption |
| Hallström et al. [27], 2014 Sweden | CO2 eq | 0.2–0.4 tonnes/person/year (33–66% reduction in animal production emissions) | Caloric and Nutrient Requirements |
| Hendrie et al. [28], 2014 Australia | CO2 eq | 3.6 kg/person/day (24.8% reduction in diet-related emissions) | Caloric and Nutrient Requirements |
| Hoolohan et al. [29], 2013 UK | CO2 eq | 2.2 kg/person/day (25% reduction in diet-related emissions) | Caloric and Nutrient Requirements |
| Macdiarmid et al. [30], 2012 UK | CO2 eq | 1.37 kg/person/day (36% reduction in diet-related emissions) | Caloric and Nutrient Requirements |
| Masset et al. [31], 2014 France | GHGE | N/A | Caloric and Nutrient Requirements |
| Michaelowa & Dransfeld, [11], 2008 OECD | CO2 eq | 20 Mt/year (N/A) | Nutrient (fat) Consumption |
| Pairotti et al. [32], 2015 Italy | CO2 eq | 27.46 kg/family/year (6.81% reduction at the family level) | Caloric and Nutrient Requirements (values not reported) |
| Saxe et al. [33], 2013 Denmark | CO2 eq | 130 kg/person/year (8% reduction in diet-related emissions) | Caloric and Protein Requirements |
| Scarborough et al. [34], 2012 UK | GHGE | 1.7–10.9 Mt/year * (3–19% reduction in UK agricultural emissions) | Mortality |
| Tukker et al. [35], 2011 Europe | Environmental Impact | 4876 Mt/year (25–27% reduction in diet-related impacts) | Nutrient Requirements |
| van Dooren et al. [36], 2014 Netherlands | CO2 eq | 0.5 kg/person/day (11% reduction in diet-related emissions) | Nutrient Requirements |
| Vieux et al. [37], 2012 France | CO2 eq | 3789 g/day/person (7.2% reduction in diet-related emissions) | Caloric Requirements |
| Wallén et al. [38], 2004 Sweden | CO2 eq | 855 kg/person/year (5.4% reduction in diet-related emissions) | Caloric and Nutrient Requirements |
| Westhoek et al. [39], 2014 EU | GHGE | 196 Mt/year (42% reduction in diet-related emissions) | Caloric and Nutrient Requirements |
| Wilson et al. [40], 2013 NZ | CO2 eq | 8.48 kg/day/person (84% reduction in diet-related emissions) | Caloric and Nutrient Requirements |
| Article [Reference], Year | GHGE Mitigation Strategies | Health Determinants Measured | ||||
|---|---|---|---|---|---|---|
| LE | AT | PT | Phys Activity | Air Pollution | Traffic Injury | |
| Grabow et al. [12], 2012 | − | + | − | HEAT model for all-cause mortality from biking | Modeled PM2.5 and ozone levels associated with mortality, disease, hospital admissions, work-loss, and school-loss days | Not included |
| Lindsay et al. [13], 2011 | − | + | − | HEAT all-cause mortality | HAPiNZ morbidity and mortality from PM10, NO2, and CO | mortality |
| Macmillan et al. [14], 2014 | + | + | − | All-cause mortality from increased biking | HAPiNZ estimates for death, disease, reduced activity, and hospitalization based on PM10, CO, and benzene | All-cause mortality from increased biking |
| Maizlish et al. [15], 2013 | + | + | − | Relative risk of disease based on METs, reported in YLL and YLD | Relative risk of disease based on PM2.5 levels | YLL and YLD |
| Michaelowa & Dransfeld, [11], 2008 | − | + | − | Obesity prevention estimates | Not included | Not included |
| Rabl & de Nazelle, [16], 2012 | − | + | − | HEAT model for all-cause mortality for biking and extended to walking, monetized | ExternE for air pollution mortality, monetized | Mortality based on statistics from Paris, Belgium, and the Netherlands, monetized |
| Rojas-Rueda et al. [17], 2012 | − | + | + | HEAT model for all-cause mortality | Relative risk of all-cause mortality based on PM2.5 levels | Relative risk of all-cause mortality |
| Woodcock et al. [18], 2009 | + | + | − | Relative risk of disease based on METs | Relative risk of disease based on PM2.5 levels | Total number of accidents, reported in YLL and YLD |
| Woodcock et al. [15], 2013 | + | + | + | Relative risk of disease based on METs, reported in YLL and YLD | Relative risk of disease based on PM2.5 levels | Total number of accidents, reported in YLL and YLD |
| Article [Reference], Year | Meat Reduction | Substitution |
|---|---|---|
| Aston et al. [19], 2012 | Double vegetarians, remaining consume meat at level of the bottom quintile | Energy adjusted intake for population energy demands |
| Berners-Lee et al. [20], 2012 | Vegan and vegetarian diets adopted by all | Per capita energy consumption is maintained equivalent to current |
| Biesbroek et al. [21], 2014 | Meat consumption reduced by 1/3 | 1/3 meat calories substituted with other foods |
| Briggs et al. [22], 2013 | Taxing high GHG emitting food groups, results in reduced meat consumption | Substituted with low GHG emitting food groups (DIETRON model) |
| De Carvalho et al. [23], 2013 | Reduction of meat consumption to recommended levels according to the World Cancer Research Fund (71.4 g/day) | No |
| Edjabou & Smed, [24], 2013 | Taxing high GHG emitting food groups, results in reduced meat consumption | Substituted with low GHG emitting food groups |
| Friel et al. [25], 2009 | 30% reduction in meat production in the UK was assumed to result in reduced consumption | No |
| González et al. [26], 2011 | Vegetarianism is promoted due to efficiency (low GHG emissions) per gram of protein delivered relative to meat | Protein delivery via legumes and other vegetable sources is considered |
| Hallström et al. [27], 2014 | Meat is reduced to recommended daily intake (RDI), about 25% reduction across the population | No |
| Hendrie et al. [28], 2014 | Reduced meat and elimination of non-core foods were considered | Yes, alternative diets were considered in their entirety and compared to RDI |
| Hoolohan et al. [29], 2013 | Meat consumption is reduced in 5% increments | Substitution was spread across “realistic plant-based” alternatives |
| Macdiarmid et al. [30], 2012 | Linear programming model selected realistic diet that minimized GHG emission, partially via reduction in meat consumption | Yes, “realistic” scenarios to meet nutritional needs while minimizing GHG emissions were designed |
| Masset et al. [31], 2014 | Reduction in meat consumption is advised based on price and GHG emissions | Yes, alternative foods with low cost and GHG emissions are identified, although exact substitution is not enumerated |
| Michaelowa and Dransfeld, [11], 2008 | Observed reduction in beef consumption from 1990 to 2005 is thought to have resulted in decreased GHG emission | No |
| Pairotti et al. [32], 2015 | Meat consumption was reduced in all alternative diet scenarios | Consumption of substitute foods was considered, but not always with the same energy provision |
| Saxe et al. [33], 2013 | All diet scenarios included a reduction in meat consumption | Substitutions were made such that all diets had equal energy and protein content |
| Scarborough et al. [34], 2012 | All diet scenarios include reductions in meat consumption | All diet scenarios include replacement with lower GHG emitting meats or other foods |
| Tukker et al. [35], 2011 | Recommended diet and reduced meat diets were considered. | Yes, substitution with protein and energy consumption constant across all scenarios |
| Van Dooren et al. [36], 2014 | All diets include reduced meat. Semi- and pesco-vegetarian diets are recommended for health and GHG emissions. | Yes, substitution is included to maintain the same level of energy in each diet. |
| Vieux et al. [37], 2012 | Meat reduction scenarios: consumption reduced by 20% for those eating >50 g/day or reduction to a maximum of 50 g/day | Meat substitution was accounted for in some scenarios by general increase across other food categories. |
| Wallén et al. [38], 2004 | The sustainable diet suggests a 36% reduction in average meat consumption. | Yes, more sustainable foods are increased to compensate for decreased meat consumption. |
| Westhoek et al. [39], 2014 | Scenarios model as 25–50% reduction in animal-derived foods. | Yes, substitution with plant-based foods were made to provide equivalent energy |
| Wilson et al. [40], 2013 | Linear programming was used to select diets low in cost and emissions, meat was eliminated on the basis of health and GHG emissions unless specifically required in the diet scenario. | Meat was replaced by healthier and lower emissions foods when meat requirements were removed. |
| Rubric Category | Active Transport (AT) | Diet | AT and Diet |
|---|---|---|---|
| General (5/5) = 100% | 4.22/5 or 84.4% | 3.55/5 or 71.1% | 3.77/5 or 75.3% |
| Emissions (5/5) = 100% | 3.66/5 or 73.3% | 4.19/5 or 83.9% | 4.05/5 or 80.9% |
| Health (10/10) = 100% | 7.11/10 or 71.1% | 4.56/10 or 45.6% | 5.28/10 or 52.8% |
| Total (20/20) = 100% | 15/20 or 75.0% | 12.34/20 or 61.7% | 13.1/20 or 65.5% |
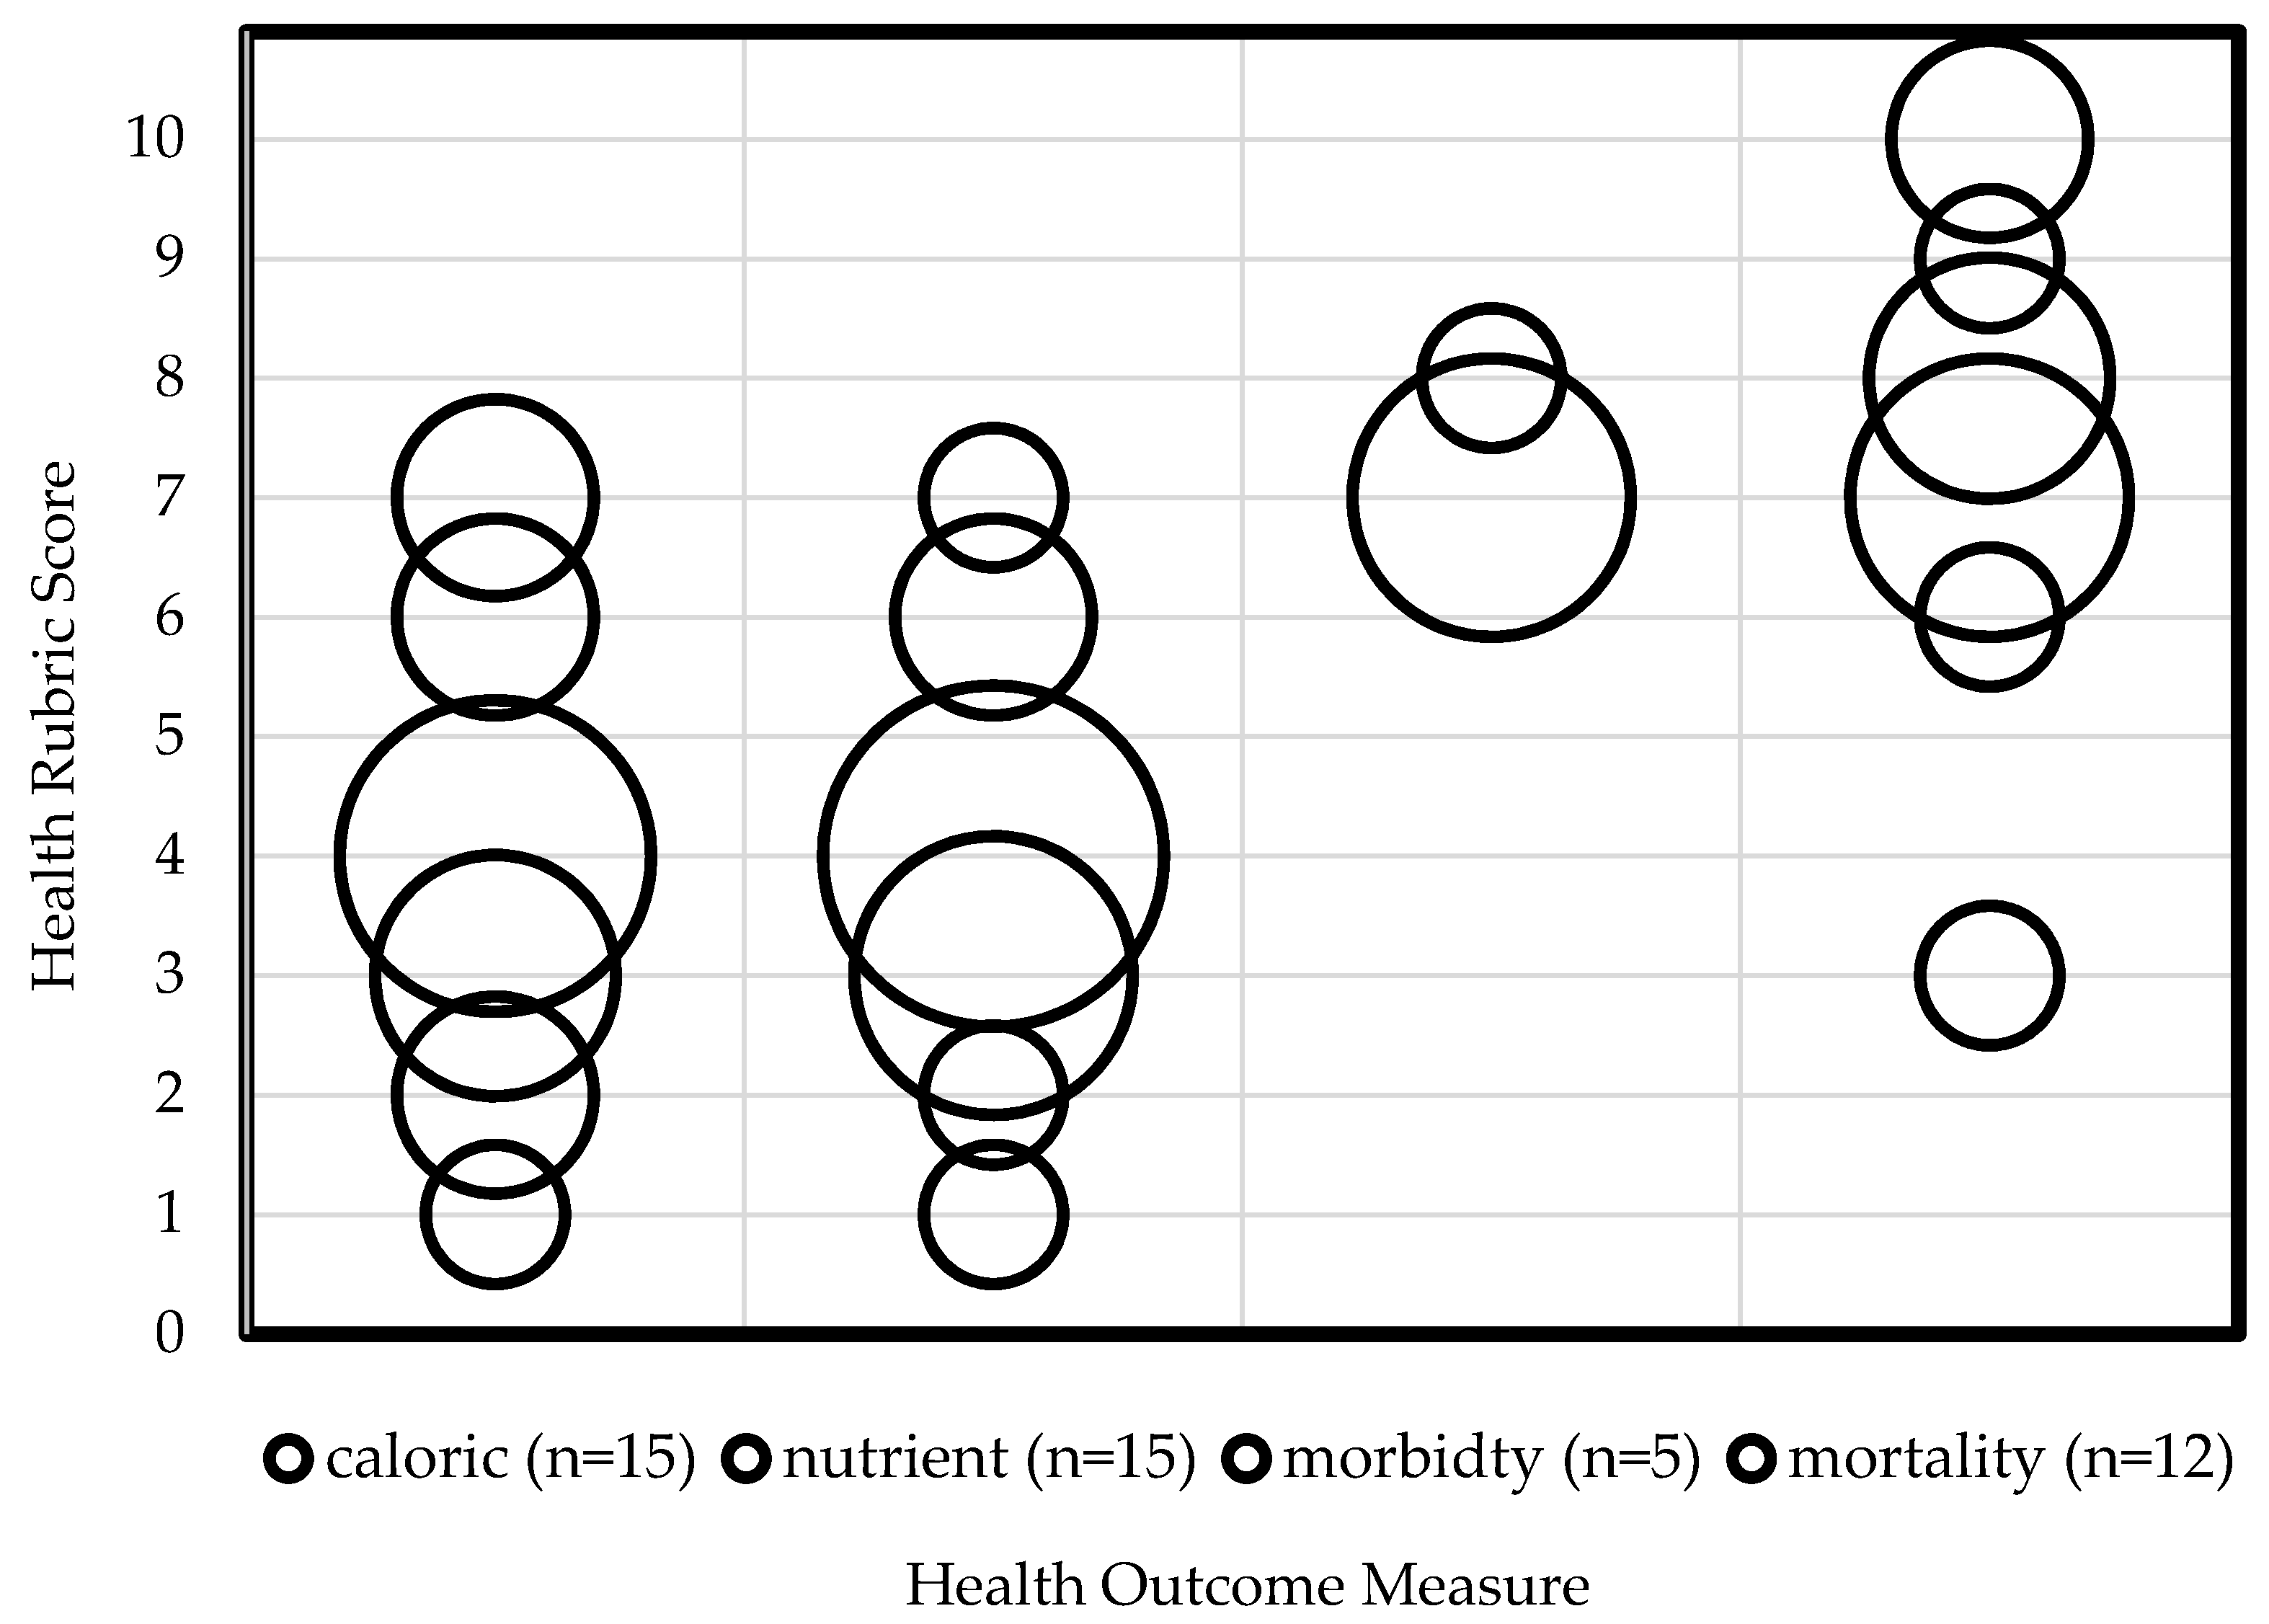
| Health Outcome Measure | Average Health Score | Health Score Range |
|---|---|---|
| Calories (n = 15) | 4/10 | 1–7 |
| Nutrient (n = 14) | 3.8/10 | 1–7 |
| Morbidity (n = 5) | 7.2/10 | 7–8 |
| Mortality (n = 12) | 7.5/10 | 3–10 |
© 2017 by the authors. Licensee MDPI, Basel, Switzerland. This article is an open access article distributed under the terms and conditions of the Creative Commons Attribution (CC BY) license (http://creativecommons.org/licenses/by/4.0/).
Share and Cite
Quam, V.G.M.; Rocklöv, J.; Quam, M.B.M.; Lucas, R.A.I. Assessing Greenhouse Gas Emissions and Health Co-Benefits: A Structured Review of Lifestyle-Related Climate Change Mitigation Strategies. Int. J. Environ. Res. Public Health 2017, 14, 468. https://doi.org/10.3390/ijerph14050468
Quam VGM, Rocklöv J, Quam MBM, Lucas RAI. Assessing Greenhouse Gas Emissions and Health Co-Benefits: A Structured Review of Lifestyle-Related Climate Change Mitigation Strategies. International Journal of Environmental Research and Public Health. 2017; 14(5):468. https://doi.org/10.3390/ijerph14050468
Chicago/Turabian StyleQuam, Vivian G. M., Joacim Rocklöv, Mikkel B. M. Quam, and Rebekah A. I. Lucas. 2017. "Assessing Greenhouse Gas Emissions and Health Co-Benefits: A Structured Review of Lifestyle-Related Climate Change Mitigation Strategies" International Journal of Environmental Research and Public Health 14, no. 5: 468. https://doi.org/10.3390/ijerph14050468