
Size of this PNG preview of this SVG file: 600 × 450 pixels. Other resolutions: 320 × 240 pixels | 640 × 480 pixels | 1,024 × 768 pixels | 1,280 × 960 pixels | 2,560 × 1,920 pixels.
Original file (SVG file, nominally 600 × 450 pixels, file size: 136 KB)
| This is a file from the Wikimedia Commons. Information from its description page there is shown below. Commons is a freely licensed media file repository. You can help. |
| Description |
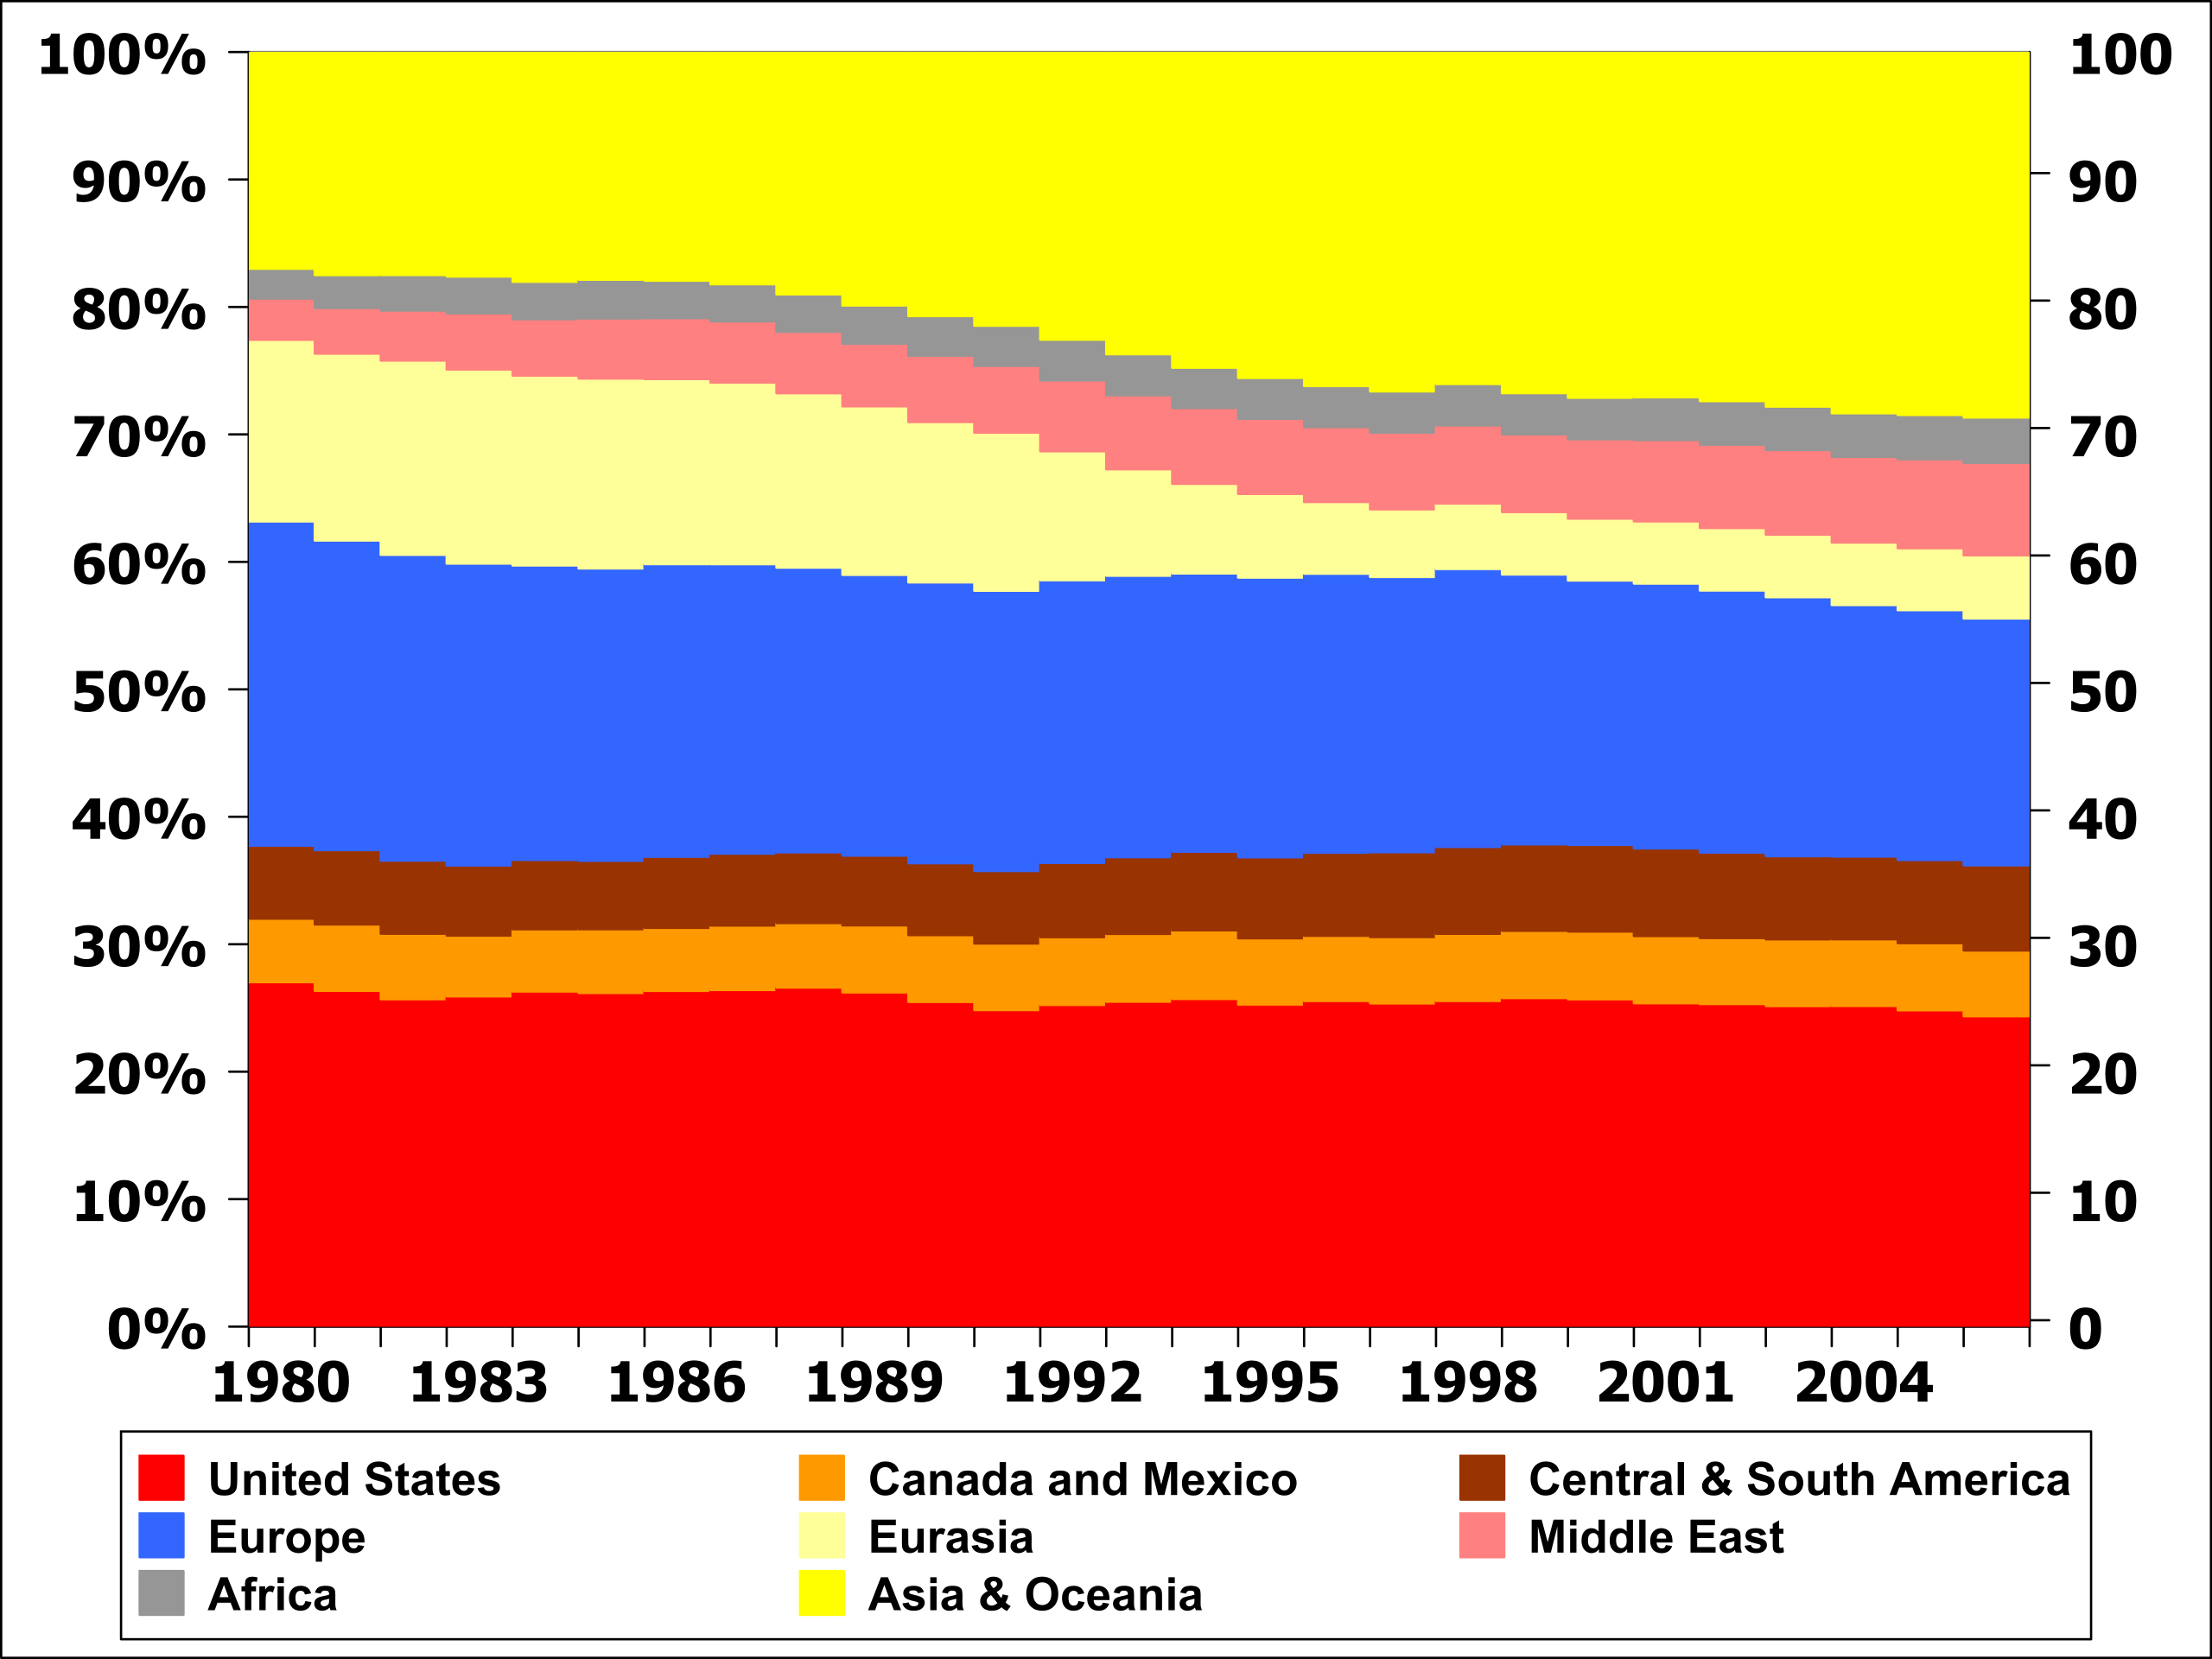
English: Oil consumption as percentage per region from 1980 to 2006; vertical extents indicate percentage of world total oil consumption, and the horizontal scale shows years from 1980 to 2007. |
| Date |
24 October 2008 (original upload date) |
| Source |
Transferred from en.wikipedia to Commons by 84user. manually |
| Author | 84user (talk) |
| Other versions |
 |
See also


Licensing
| This work has been released into the public domain by its author, 84user at English Wikipedia. This applies worldwide. In some countries this may not be legally possible; if so: 84user grants anyone the right to use this work for any purpose, without any conditions, unless such conditions are required by law. |
84user at English Wikipedia, the copyright holder of this work, hereby publishes it under the following license:
| I, the copyright holder of this work, release this work into the public domain. This applies worldwide. In some countries this may not be legally possible; if so: I grant anyone the right to use this work for any purpose, without any conditions, unless such conditions are required by law. |
Original upload log
The original description page was here. All following user names refer to en.wikipedia.
File history
Click on a date/time to view the file as it appeared at that time.
| Date/Time | Thumbnail | Dimensions | User | Comment | |
|---|---|---|---|---|---|
| current | 12:29, 25 October 2008 | | 600 × 450 (136 KB) | 84user | {{Information |Description={{en|Oil consumption as percentage per region from 1980 to 2006; vertical extents indicate percentage of world total oil consumption, and the horizontal scale shows years from 1980 to 2007.}} |Source=Transferred from [http://en. |
File usage
The following pages on the English Wikipedia use this file (pages on other projects are not listed):
Global file usage
The following other wikis use this file:
- Usage on fa.wikipedia.org
- Usage on id.wikipedia.org
- Usage on ko.wikipedia.org
- Usage on th.wikipedia.org
- Usage on ur.wikipedia.org