gringer is another of the numerous wikipedia consumers, also known as David Eccles (formerly David Hall).
| Wikipedia:Babel | ||||
|---|---|---|---|---|
| ||||
| Search user languages |
| |||
I originally thought the name of the cat in the TV Show He-Man was called Gringer, and I thought that cat was an appropriate representation of my personality. Despite finding out that the cat's name was Cringer, I decided to stick to that "original" mis-heard name.
My academic interests are in human genetics (or more generally, biology), mathematical logic, and programming (as a hobby, rather than a career). This led me to work on a PhD in biomedical science, studying basic structures of genetic variation in the Māori population, which was accepted in the University library in December 2011. My thesis can be found here.
Useful links edit
- Map Colors
- Wikipedia:WikiProject_Maps/Conventions : ongoing expansion, have fun ;)
- Category:Chemical_images_that_should_be_in_SVG_format
- mapnik may provide a way to do more customisable world maps
Map Drawing using Natural Earth Data edit
Natural Earth Data (NED) — has a license that seems to fit wikimedia well (public domain). I have created a Perl script for converting shapefiles from Natural Earth Data into SVG files. Many useful features have been implemented:
- map-type based colours (with manual override)
- shapes grouped by country (and by territory, if different)
- mark countries as main/subject/interest
- different colours for identified subject areas
- centre map based on either specified lat/long point or country centre
- supports multiple projections (anything supported by proj4)
- lines of latitude and longitude
- larger surrounding circle when point of interest is a single point
- line simplification using Ramer–Douglas–Peucker_algorithm, with hashing to ensure already added points are always included)
- bounding box / zooming for a particular region
- ability to mark countries/regions as 'other political'|'outside'
- style-sheet based colouring for easy customisation / changing of colours
- load numerical data from a csv file to create a heatmap
- proper clipping at SVG viewbox boundary — implemented for orthographic projections
- zoom box clipping (e.g. using Sutherland–Hodgman algorithm) to remove more mindless Inkscape touch-ups. The Vatti_clipping_algorithm may be implemented if too many people complain about the boundary edges.
To come:
- numbering regions and generating a list of region names — useful for regional maps, but NED resolution doesn't go down to regional levels for most countries
- remove Geo::ShapeFile dependency
How To Create a World Map edit
- Download Admin 0 cultural boundaries and tiny country points from here.
- Save my Perl script in an appropriate place on your computer -- direct download here.
- Install the Geo::ShapeFile Perl library -- you can download a compiled version here (extract into the same directory), or install via cpanminus (
cpanm Geo::ShapeFile) - Set up Perl
@INCto point to the Perl library directory (e.g.export PERL5LIB=/home/${USER}/perl5/lib/perl5) - Run my script:
./perlshaper.pl -v <country download location>/ne_50m_admin_0_countries.shp <country download location>/ne_50m_admin_0_tiny_countries.shp -type location -round 2 -centre 10,0 -psize 0.25 > map.svg - View and clean up the generated map with Inkscape (if necessary):
inkscape map.svg
OR
- Post a request for a map on the Map workshop page, and wait for the generated map.
The World edit
-
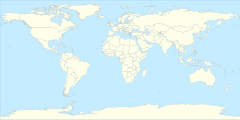 My interpretation of the Natural Earth Data vector information (perl script that generated the basic image (~0.25 px resolution) can be found at User:Gringer/perlshaper).
 -
 A polar projection of the southern hemisphere, created in a similar way
 -
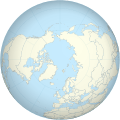 A polar projection of the northern hemisphere, created in a similar way


Polynesia edit

Other code edit
- My code for extracting primitive shapes from swfmill XML files to create SVG objects
- this code seems to be able to extract fonts and some shapes, but not many other things
Colours and the Visible spectrum edit
I created an sRGB version of the Visible spectrum in August 2008, which got a bit of flack (most obviously from jacobolus (talk · contribs), see Talk:Visible spectrum) for not being a good representation of the true spectrum. This image has now been updated (August 2010) to use CIECAM02 brightness(J)/chroma(C)/hue(h) in order to better approximate the visible spectrum in sRGB. The description from the image page follows:
Spectral XYZ locus coordinates were found here. Every 10nm, the spectral locus point was used as the initial point in a search for a matching sRGB colour (assuming "Dim" viewing condition). The search was carried out by a binary search along a line in JCh space between the spectral point, and a point with 0.3 * brightness (J), 0 chroma (C), and the same hue (h) as the spectral point. The search finished when a point was found that was in sRGB space. The CAT02 matrix was modified as suggested in Brill(2008) to reduce yellow-blue problems by replacing the bottom row (0.0030, 0.0136, 0.9834) with (0,0,1). An iterative smoothing was carried out to eliminate the largest jumps in chroma (greater than 5% change). Code used to generate the colour gradient can be found here.
Colour is a tricky beast, and I don't think this will remain as my best representation of the spectrum, but I'm more convinced (after reading a number of research papers) that the CIECAM02 colour space is the most appropriate for this at the current time.


edit
- LuxCoreRender — a program that attempts to render spectra as faithfully as possible
Colour Wheel edit

Images edit
Tux edit
