
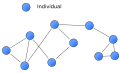
A network diagram is a diagrammatical visualisation of a network. A network in general is an interconnected group or system, or a fabric or structure of fibrous elements attached to each other at regular intervals, or formally: a graph.
A network diagram is a special kind of cluster diagram, which even more general represents any cluster or small group or bunch of something, structured or not. Both the flow diagram and the tree diagram can be seen as a specific type of network diagram.
A network diagram depicts a set of objects, that constitute a network. Unlike a system a network is generally not bounded by a clear system border, or determined by a set of subsystems.
Definitions edit
In project management a network diagram has been defined as a set of tasks set out in time. For example, Lindstrom (2014) defined:
- "A network diagram is a graphic presentation of the task list, the start and completion dates, and the name of the responsible person for each task. Think of a network diagram as a flow diagram of the procurement. It is the logical representation of tasks defining the sequence of work. A network diagram will:
- Show the sequences and relationships among tasks and milestones
- Show the interrelationships of tasks in different parts of the task list and WBS hierarchy
- Reduce uncertainty in the procurement because it is broken down into many small tasks, analyzed and sequenced in advance of starting the work."[1]
In the field of operations and supply chain management Boyer and Verma (2009) stated:
- "A network diagram is used to show the precedence relationship among different activities. There are two conventions for building a network diagram. The activity on node (AON) approach shows each activity as a circle (or a node) and connects the activities with arrows. The direction of an arrow indicates the project direction... In practice, a second convention known as the activity on arrow (AOA) convention is also used. activity on arrow (AOA) convention is also used. The AOA convention is opposite to AON: Each activity is represented by an arrow, and the nodes are used to show the beginning and end points.[2]
Types of network diagrams edit
There are different types network diagrams:
- Artificial neural network or "neural network" (NN), is a mathematical model or computational model based on biological neural networks. It consists of an interconnected group of artificial neurons and processes information using a connectionist approach to computation.
- Computer network diagram is a schematic depicting the nodes and connections amongst nodes in a computer network or, more generally, any telecommunications network.
- In project management according to Baker et al. (2003), a "network diagram is the logical representation of activities, that defines the sequence or the work of a project. It shows the path of a project, lists starting and completion dates, and names the responsibilities for each task. At a glance it explains how the work of the project goes together... A network for a simple project might consist one or two pages, and on a larger project several network diagrams may exist".[3] Specific diagrams here are
- Project network: a general flow chart depicting the sequence in which a project's terminal elements are to be completed by showing terminal elements and their dependencies.
- PERT network
- Neural network diagram: is a network or circuit of biological neurons or artificial neural networks, which are composed of artificial neurons or nodes.
- A semantic network is a network or circuit of biological neurons. The modern usage of the term often refers to artificial neural networks, which are composed of artificial neurons or nodes]].[4]
- A sociogram is a graphic representation of social links that a person has. It is a sociometric chart that plots the structure of interpersonal relations in a group situation.
Gallery edit
-

-

-
 Neural network diagram
 -

-
-

-
-


Network topologies edit

In computer science the elements of a network are arranged in certain basic shapes (see figure):
- Full Mesh: Every node is connected to every other node. Most redundant and expensive.
- Partial Mesh Is similar to a full mesh, but some nodes still have to go through others to get to its final destination. Offers some redundancy and not as expensive as full mesh.
- Star: The star network consists of one central element, switch, hub or computer, which acts as a conduit to coordinate activity or transmit messages. Good redundancy and fairly cheap (most common).
- Ring: The ring network connects each node to exactly two other nodes, forming a circular pathway for activity or signals - a ring. The interaction or data travels from node to node, with each node handling every packet. Typically used by small businesses in a P2P design.
- Bus: In this network architecture a set of clients are connected via a shared communications line, called a bus network. Least redundancy and cost (single point of failure).
- Hybrid:Two or more topologies combined for example multiple stars connecting to a fiber backbone (the backbone being a bus topologies), or a ring and a star.
- Tree: This consists of tree-configured nodes connected to switches/concentrators, each connected to a linear bus backbone. Each hub rebroadcasts all transmissions received from any peripheral node to all peripheral nodes on the network, sometimes including the originating node. All peripheral nodes may thus communicate with all others by transmitting to, and receiving from, the central node only.
Related topics edit
Graph drawing edit
Graph drawing is an area of mathematics and computer science combining methods from geometric graph theory and information visualization to derive two-dimensional depictions of graphs arising from applications such as social network analysis, cartography, linguistics, and bioinformatics.
Network model edit
The network model is a database model conceived as a flexible way of representing objects and their relationships. Its original inventor was Charles Bachman, and it was developed into a standard specification published in 1969 by the CODASYL Consortium. Where the hierarchical model structures data as a tree of records, with each record having one parent record and many children, the network model allows each record to have multiple parent and child records, forming a lattice structure.
Network science edit
Network science is a new and emerging scientific discipline that examines the interconnections among diverse physical, informational, biological, cognitive, and social networks. This field of science seeks to discover common principles, algorithms and tools that govern network behavior. The National Research Council defines Network Science as "the organized knowledge of networks based on their study using the scientific method."[5]
Network theory edit
Network theory is an area of applied mathematics and part of graph theory. It has application in many disciplines including particle physics, computer science, biology, economics, operations research, and sociology. Network theory concerns itself with the study of graphs as a representation of either symmetric relations or, more generally, of asymmetric relations between discrete objects. Examples of which include logistical networks, the World Wide Web, gene regulatory networks, metabolic networks, social networks, epistemological networks, etc. See list of network theory topics for more examp.ww
Network topology edit
Network topology is the study of the arrangement or mapping of the elements (links, nodes, etc.) of a network, especially the physical (real) and logical (virtual) interconnections between nodes.[6]
Any particular network topology is determined only by the graphical mapping of the configuration of physical and/or logical connections between nodes. LAN Network Topology is, therefore, technically a part of graph theory. Distances between nodes, physical interconnections, transmission rates, and/or signal types may differ in two networks and yet their topologies may be identical.
See also edit
References edit
- ^ Diana Lindstrom. Procurement Project Management Success: Achieving a Higher Level of Effectiveness.- J. Ross Publishing, 2014. p. 76
- ^ Ken Boyer, Rohit Verma (2009), Operations and Supply Chain Management for the 21st Century. p. 287
- ^ Sunny Baker, G. Michael Campbell, Kim Baker (2003). The Complete Idiot's Guide to Project Management. p. 104. ISBN 0028639200.
{{cite book}}: CS1 maint: multiple names: authors list (link) - ^ Jonh F.Sowa (1987). "Semantic Networks". In Stuart C Shapiro (ed.). Encyclopedia of Artificial Intelligence. Retrieved 2008-04-29.
- ^ Committee on Network Science for Future Army Applications, National Research Council (2005). Network Science. National Academies Press. ISBN 0309100267.
- ^ Groth, David (2005). 'Network+ Study Guide, Fourth Edition'. Sybex, Inc. ISBN 0-7821-4406-3.
{{cite book}}: Unknown parameter|coauthors=ignored (|author=suggested) (help)
External links edit
- Diagramly, a free online tool for building diagrams
- 10Scape, a tool to create 3D network diagrams by transforming Excel/CSV data
- Dia, a free tool for building network diagrams under Linux, Windows
- LucidChart, a free online Html5-based diagramming tool for building network diagrams. Works with any major browser
- MaSSHandra, a free tool for building 3D IP network diagrams and access its components