

Abstract
Production of commercial agricultural commodities for domestic and foreign markets is increasingly driving land clearing in tropical regions, creating links and feedback effects between geographically separated consumption and production locations. Such teleconnections are commonly studied through calculating consumption footprints and quantifying environmental impacts embodied in trade flows, e.g., virtual water and land, biomass, or greenhouse gas emissions. The extent to which land-use change (LUC) and associated carbon emissions are embodied in the production and export of agricultural commodities has been less studied. Here we quantify tropical deforestation area and carbon emissions from LUC induced by the production and the export of four commodities (beef, soybeans, palm oil, and wood products) in seven countries with high deforestation rates (Argentina, Bolivia, Brazil, Paraguay, Indonesia, Malaysia, and Papua New Guinea). We show that in the period 2000–2011, the production of the four analyzed commodities in our seven case countries was responsible for 40% of total tropical deforestation and resulting carbon losses. Over a third of these impacts was embodied in exports in 2011, up from a fifth in 2000. This trend highlights the growing influence of global markets in deforestation dynamics. Main flows of embodied LUC are Latin American beef and soybean exports to markets in Europe, China, the former Soviet bloc, the Middle East and Northern Africa, whereas embodied emission flows are dominated by Southeast Asian exports of palm oil and wood products to consumers in China, India and the rest of Asia, as well as to the European Union. Our findings illustrate the growing role that global consumers play in tropical LUC trajectories and highlight the need for demand-side policies covering whole supply chains. We also discuss the limitations of such demand-side measures and call for a combination of supply- and demand-side policies to effectively limit tropical deforestation, along with research into the interactions of different types of policy interventions.
Export citation and abstract BibTeX RIS

Content from this work may be used under the terms of the Creative Commons Attribution 3.0 licence. Any further distribution of this work must maintain attribution to the author(s) and the title of the work, journal citation and DOI.
1. Introduction
Growing worldwide demand for agricultural commodities has led to a steep increase in global trade volumes in the last decades [1]. On average, a fifth of the global harvested cropland area was dedicated to export production in the 2000s [2, 3]. Especially in some countries of South America and Southeast Asia, production for export markets has come to comprise a substantial share of total agricultural output. Indonesia and Malaysia alone produce over 90% of all palm oil consumed in the world, and Argentina, Bolivia, Brazil and Paraguay together account for nearly all the soybean and over 80% of beef exports from Latin America [1].
While globally most of the increase in agricultural supply stems from enhanced productivity, in tropical regions cropland expansion and yield increases have contributed equally to higher outputs [4, 5]. Most of this expansion has occurred at the expense of intact rainforests or other natural vegetation [6], so that global demand for agricultural commodities has become an increasingly important driver of land-use change (LUC) and tropical deforestation. Highly mechanized agribusinesses producing for urban populations and international markets have gained importance in deforestation since the 1990s [7–9]. Between 2000 and 2010, a major part of global deforestation was due to commercial agriculture, often producing for export markets [10].
The demand for food, feed and fiber from a growing world population creates the challenge of enhancing global agricultural supply without compromising environmental sustainability. Tropical deforestation causes loss of biodiversity and other ecosystem services, soil degradation and the disruption of hydrological cycles [11, 12]. It is also a major source of greenhouse gas emissions [13], responsible for 7%–14% of global anthropogenic carbon dioxide (CO2) emissions in 2000–2005 [14, 15]. However, the driving factors behind these environmental impacts are difficult to assess due to increasingly globalized trade patterns, causing a geographic separation of consumption and production locations [16]. This creates distant links, also termed teleconnections [17, 18], between international demand and the local environmental impacts incurred by the production of traded goods. Understanding these links is important for the development of innovative conservation opportunities in form of demand-side measures, complementing conventional supply-side approaches [7, 17, 19].
In the context of deforestation and climate change, supply-side policies such as REDD+ aim to incentivize forest conservation by influencing producers and land-users directly, whereas demand-side measures seek to affect land-use decisions indirectly, e.g., by offering price-premiums for environmentally responsible producers or restricting market access for products involving forest clearing [20]. Demand-side instruments include market-based policies such as commodity roundtables—e.g., the Roundtable for Sustainable Palm Oil, RSPO—or moratoria such as the Brazilian Soy Moratorium [21] and Cattle agreement [22]. Other options are regulatory approaches such as the EU Timber Trade Agreement and the US Lacey Act, which target imports of illegal tropical timber, as well as zero-deforestation pledges by industry, committing to supply-chains that are free of products from recently cleared forestland [23].
To ensure the effectiveness of such demand-side measures, a better understanding is needed of how global supply-chains link consumers of forest-risk commodities4 across the world to forest destruction in tropical countries. However, while many studies have analyzed environmental teleconnections through the lens of human-appropriated net primary production [HANPP; 24], land use [25, 26], water [27, 28], biodiversity [29] or energy-related CO2 emissions [30–33] embodied in international trade flows, studies on deforestation and associated CO2 emissions embodied in trade [34–36] are scarce. Such assessments have in the past been constrained by substantial data gaps, mainly due to high uncertainties in and lack of information on emission factors, and the allocation of deforestation emissions to specific LUC drivers [30, 35].
Recent research efforts in these areas have contributed to improving data availability and quality. Using latest, geographically consistent biomass emission factors and an updated literature survey on proximate deforestation drivers, this paper overcomes some of the limitations of previous studies, and analyzes the links between deforestation for four principal forest-risk commodities (beef, soybeans, palm oil and wood products) in seven high-deforestation countries (Argentina, Bolivia, Brazil, Paraguay, Indonesia, Malaysia and Papua New Guinea) and consumption, through international trade, in the period 2000–2011.
2. Methods and materials
2.1. Methods
We used a bottom-up material-flow approach to estimate LUC area associated CO2 emissions embodied in our case countries' domestic consumption and exports of beef, soybeans, palm oil and wood products (timber and pulp and paper) for the years 2000–2011. The analysis consisted of three steps; (a) calculation of LUC area and carbon footprints, which describe the amount of cleared land and associated CO2 emissions per ton of commodity produced for the four commodities; (b) tracing trade flows with the help of a physical trade model to the places of apparent consumption; and (c) combining physical trade flows and footprints to determine LUC area and emissions embodied in trade flows, and identifying the main consumer countries and regions.
2.1.1. LUC area and emission footprints
We calculated product- and country-specific LUC area and CO2 footprints using two different approaches; one for agricultural commodities and pulp and paper, and another one for timber. This was necessary due to differences in the temporal occurrence of emissions. For crop or pulpwood plantations there is usually a time-lag between forest clearing and the actual production of the commodities, e.g., rotation cycles of acacia pulp plantations in Indonesia last 6 to 7 years [37], whereas first oil palm fruits can be harvested three years after planting, and in soybean establishment on cleared areas rice is commonly used as a transitory crop to prepare the ground for soybean cropping [38]. Emissions from forest clearing in this approach were therefore distributed over a 10 year amortization period, whereas in the approach for timber harvest we assumed that emissions occur in the same year as the logging event.
To calculate the footprints of agricultural commodities and pulp and paper products we adopted the method proposed by Persson et al [38]. This method links commodity production to deforestation by distributing the LUC and associated emissions over production on the cleared land in the T years following clearing, using the following expression:

Here,  refers to the net loss of above and below ground carbon stocks (in tCO2/ha) from the clearing of natural vegetation in biome n in country i for agricultural land producing product j. The factor
  allocates LUC and emissions between the different products produced on the cleared land (e.g., in the case of double cropping),
  accounts for land-use and yield dynamics over time (e.g., yield variations in oil palm plantations over a rotation period), and
  is the average yield. The LUC area footprint was obtained by simply removing the carbon stock changes (
 from equation (1). Where LUC is preceded by selective logging, the carbon losses from logging were deducted from
  in equation (1) and included in the estimation of the CO2 footprint for wood products (see equation (3)).The amortization period T was set to 10 years, but results for varying this parameter between 5 and 20 years are also presented.
Equation (1) estimated the LUC and emissions footprint from commodities originating from recently cleared land (i.e., deforested less than T years ago). Since the trade data does not carry information on where exactly the traded commodities are produced, we calculated national average LUC and emissions footprints for our commodities by accounting for the share of production originating from land cleared in the last T years, according to the following expression:
Here  represents the annual clearing rate in biome n (in Mha),
  the share of cleared land dedicated to the production of product j, and
  is the total production of product j, in country i in year t (in tons).
For wood products, the carbon footprint considered two different emission sources: (1) carbon losses from selective logging prior to complete forest clearing for our analyzed agricultural commodities, and (2) clear-cutting of forests for timber (without subsequent use of the land for agricultural production). The aggregate carbon footprint was calculated as:
Here,  represents the annual clearing rate (in Mha),
  the share of deforestation due to clear-cutting and timber extraction,
  the share of clearing for agricultural commodities,
  the share of forests that were selectively logged prior to clearing for agriculture,
  is the share of biomass carbon removed in selective logging,
  is the carbon stock of logged forests (in tCO2/ha), and
  is the total output of wood products in year t in country i. Here, the LUC area footprint was obtained by removing
  and setting the factor
  to zero (i.e., no LUC area was allocated to timber from selective logging, only to that from clear-cutting).
2.1.2. Trade analysis
In a second step, we analyzed physical trade flows for the included primary commodities (beef, soybeans, palm oil, and wood products) between the seven producing nations and the regions of apparent consumption. To that end, we used a method that allows tracing the flows of agricultural products through international supply chains, based on production data and information on physical bilateral trade flows between nations [39]. The analysis covers primary crops as well as selected processed items such as oils and flours, which are converted into primary crop equivalents (see table S1 for a list of included commodities and conversion factors). In addition, soybean cake and palm kernel cake used as feed was included via the trade of animal products.
The primary equivalent data were then arranged into a matrix where each cell corresponds to a trade flow from country A to country B. Along with information on country-level production of primary items, these data were used to create an estimate in which countries the domestic production of a given country adds to consumption. The method's central underlying assumption is that both domestic consumption and exports consist of the same proportional between domestic production and imports. The main advantage of the approach over simple material flow approaches [e.g., 40–42] is that it eliminates transit countries in the supply-chain where only processing takes place. For instance, Brazilian soybean exports to the Netherlands, which are there turned into soybean oil and pork (via soybean cake feed) and further exported to Austria and Spain, will show up as land demand in Brazil for apparent consumption in Austria and in Spain. The method ensures consistency with national production totals and at the global level, i.e. global production will match global consumption. For methodological details and mathematical formalization refer to the original publications [2, 39, 43].
2.2. Materials
2.2.1. Commodity and case country selection
Our intention with the selection of case commodities and countries was to cover a large share of total forest loss, as well as the production and trade of forest-risk commodities driving this loss, across the tropics. We first identified the case commodities, based on the scientific literature that commonly links beef, soybeans, palm oil and wood products (i.e., timber, pulp and paper) to tropical deforestation [9]. We then chose case countries in Latin America and Southeast Asia, regions where large-scale commercial agriculture is an important driver of deforestation [7, 10]. The focus was on countries that are major producers and primary exporters5 of the selected commodities, while also showing high deforestation and land clearing levels.
Over 80% of total forest loss in Latin America in the 2000s occurred in Argentina, Bolivia, Brazil, and Paraguay [14, 44]. These countries accounted for 71% and 98%, respectively, of Latin American beef and soy production in 2011, as well as 80% and 98%, respectively, of the regions beef and soy exports [1] (see also figure 1). Indonesia, Malaysia and Papua New Guinea accounted for 82% of global production and 98% of global primary exports of palm oil in 2011 [1] (figure 1). Moreover, these three countries together incurred around 65% of total Asian deforestation in the 2000s [14, 44]. For wood products, we analyzed Brazil, Indonesia, Malaysia and Papua New Guinea, which together produce and export over 50% of all timber, pulp and paper from the tropics, with Brazil accounting for half of the Latin American wood product exports and Indonesia, Malaysia and Papua New Guinea accounting for two thirds of Asian exports [1]. For Indonesia we also analyzed the role of short rotation pulp wood plantations as a driver of forest loss.
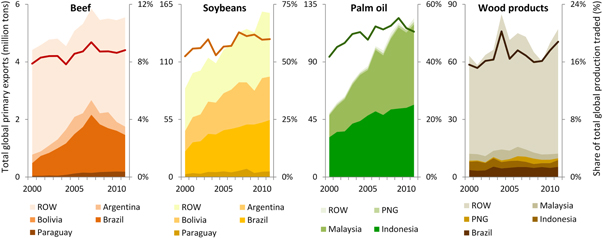
Figure 1. Total global primary exports (left vertical axes) of the four forest-risk commodities analyzed, for the period 2000–2011, highlighting the amount of exports coming from our case countries for each commodity. The share of global production that is traded on international markets is also displayed for each commodity (right vertical axes). All units are in million tons, except wood product values which are in million tons of carbon. Data: own calculations based on FAOSTAT (http://faostat3.fao.org).
Download figure:
Standard image High-resolution image2.2.2. Data sources and scope
Here we present a short summary of the main parameters and the data sources used. We refer to the SI material for a detailed list and description of the data, including references and assumptions.
In this study we considered only carbon in vegetation as it is most affected by disturbance processes, whereas soil carbon is not as easily oxidized [13] and available data on soil carbon involves high uncertainties [14]. However, soil carbon emissions from peatland conversion in Southeast Asia were included, since plantation expansion on peatland in this region is a large source of CO2 emissions from LUC [15]. Peatland emission factors were based on two recent reviews [45, 46]. Above-ground biomass (AGB) estimates (table S2) were taken from a recent study estimating average AGB by country and biome based on pan-tropical biomass maps [47, 48], and converted to total (above and below ground) biomass carbon using the expression proposed by [48]. We assessed the uncertainty in resulting CO2 emissions embodied in production and exports of our case commodities with respect to underlying uncertainties in estimated biomass values (based on the confidence intervals for AGB estimates reported by [47], and assuming a normal distribution) by conducting a Monte Carlo analysis, running the calculations 1000 times with AGB assumptions randomly drawn from the assumed distributions (see table S2).
In Brazil, Argentina and Paraguay we considered land clearing both in the rainforest (Amazon and Atlantic forest biomes) and dry woodland biomes (Cerrado and Chaco biomes), as cattle ranching and soybean cultivation have contributed to LUC in both types of ecosystems [49]. We also accounted for double cropping of soy with wheat and sunflower in Bolivia and corn in Brazil, allocating LUC area and CO2 emissions between the different products based on the revenues achieved over time. This approach allocates greater emissions responsibility to the more profitable crop, based on the assumption that it is the main driving force behind LUC. Below the LUC area and emissions from double cropping are reported as part of the soy results (separate results can be found in the SI).
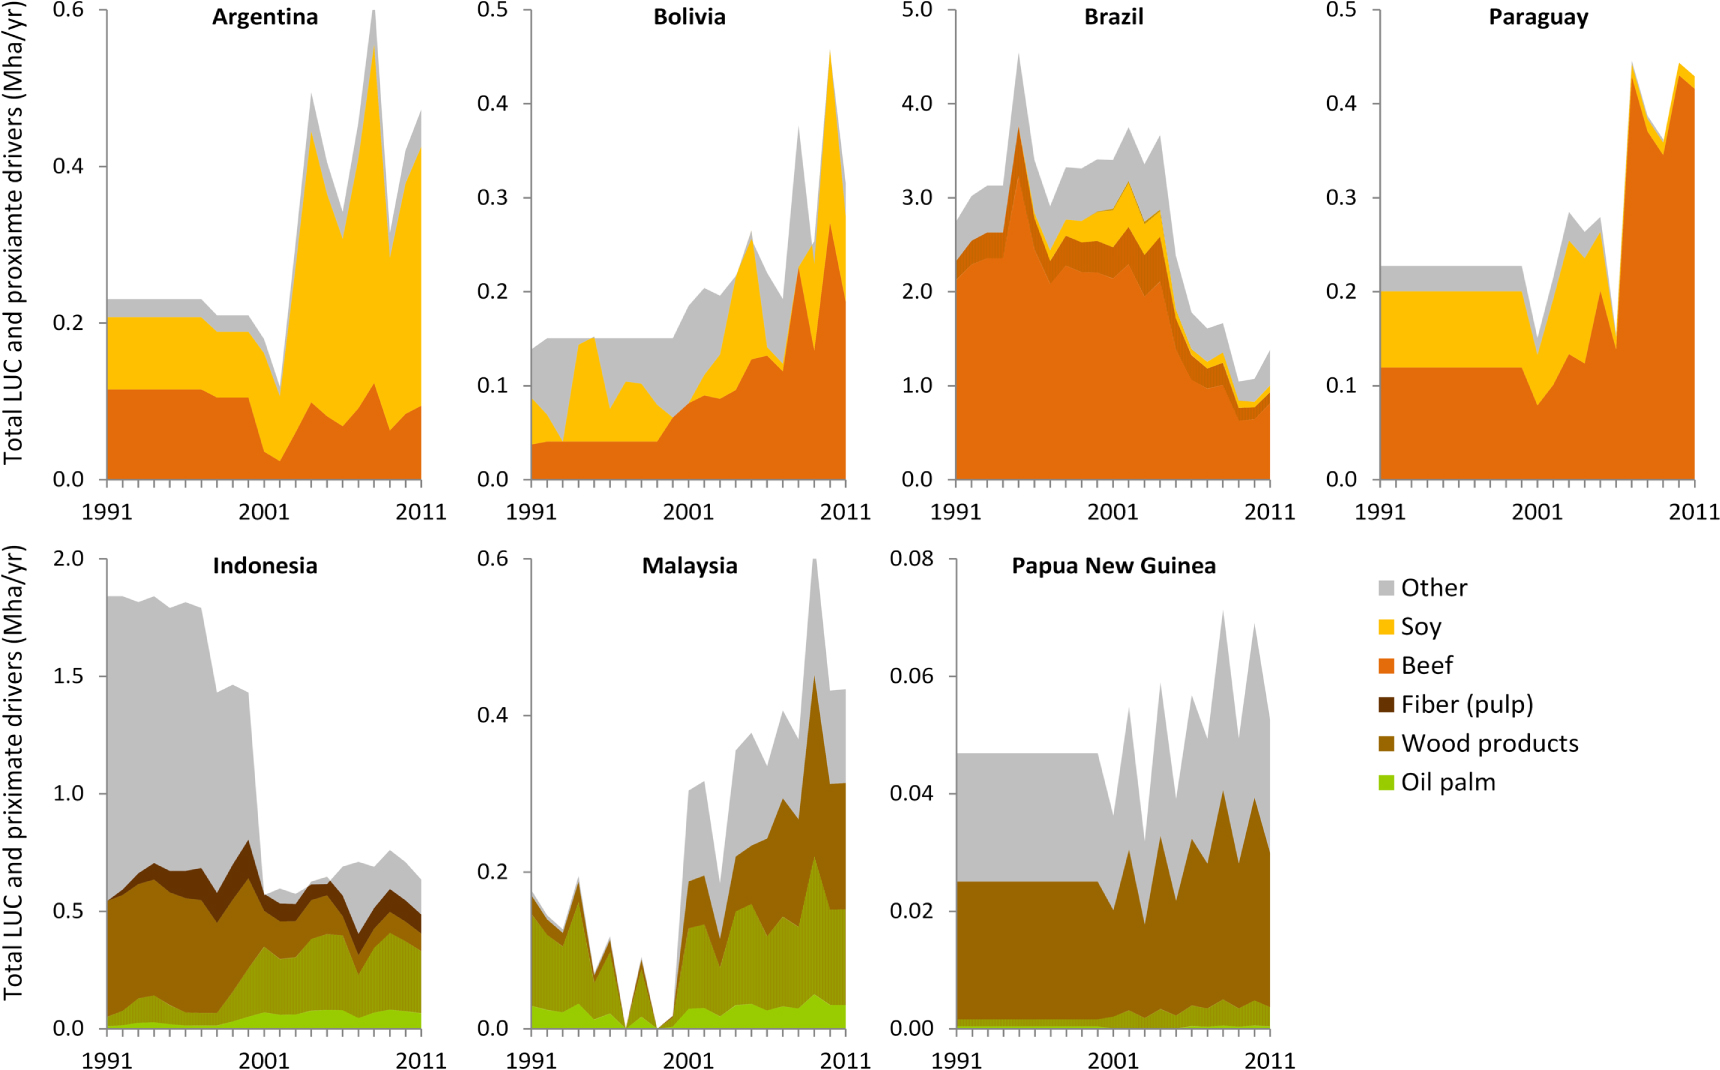
Data on deforestation and clearing rates in the individual countries was gathered from the scientific literature, combining latest data from pan-tropical (or global) remote sensing analyses [14, 44] with regional or national level data [50–58]. Where available, we used analyses of proximate LUC drivers based on remote-sensing methods [e.g., 21, 59–64]. Where remote-sensing data only had partial spatial or temporal coverage, we extended it using ancillary data such as national agricultural statistics. The assumptions regarding LUC rates in our case countries and the attribution of deforestation to the case commodities are summarized in figure 2.

Figure 2. Total rates of land-use change (LUC) and attribution to our case commodities for the seven case countries in the period 1990–2011. Shaded colored areas represent deforestation attributed to each of the four analyzed commodities—beef, soybeans, palm oil and wood products —with striped areas representing forest areas selectively logged prior to clearing. The remaining deforestation, not attributed to our case commodities, is labeled other and includes both commercial and non-commercial proximate drivers of forest loss. The lack of annual deforestation data for most countries prior to 2000 explains the apparent flat levels of deforestation in the 1990s. See the SI for details and underlying data sources.
Download figure:
Standard image High-resolution imageFor the trade analysis we updated and recalculated data from Kastner et al [2, 43] for the four commodities and the years 2000 to 2011. The required input data on yields, total production and physical trade flows was obtained from the FAO's statistical database FAOSTAT [1]. Trade flows of the four commodities and their associated secondary products (table S1) were translated into primary commodity equivalents for the agricultural products, and in carbon equivalents in the case of wood products, using conversion factors based on carbon content. For the bilateral trade flows we gave priority to reported import flows [see 39]. However, the use of export flows as a test case yielded no major differences in results.
For some combinations of specific commodities, countries and years, our results for apparent consumption showed negative values (which we decided not to exclude). This suggests that a country's exports of a commodity (in primary equivalents) were larger than its domestic production and imports (in primary equivalents), e.g., in the case of Papua New Guinea, where for some years the reported wood exports to China were larger than the country's entire reported roundwood production. Considering the laws of mass balance this is impossible, so that the occurrence of negative values highlights inconsistencies in input data, which could in some cases be an indication for illegal logging and trade activities [65].
3. Results
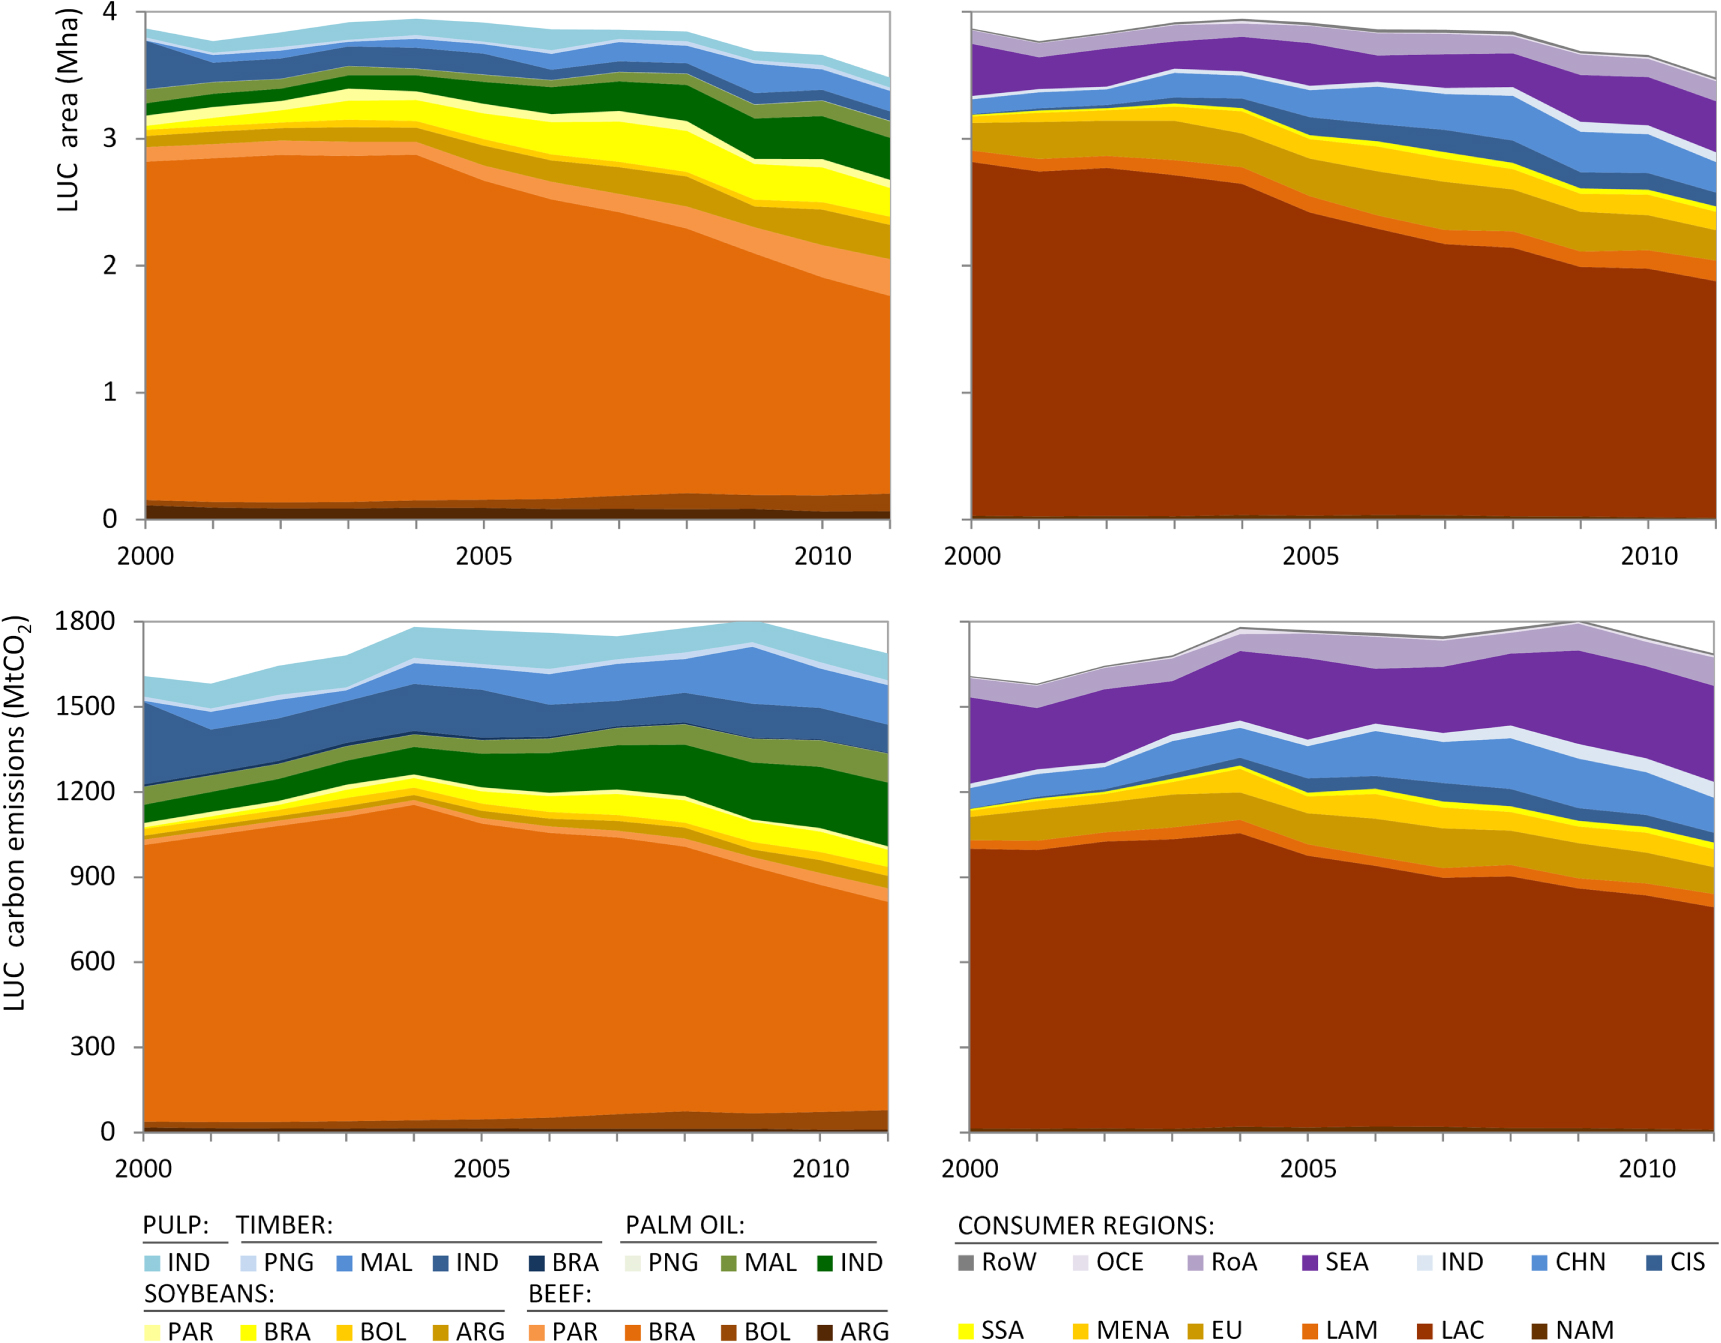
We find that in the period 2000–2011, an average deforestation area of 3.8 Mha and LUC emissions of 1.6 GtCO2 was embodied in the production of beef, soy, palm oil, and wood products in our seven case countries (figure 3). This constitutes 40% of total tropical deforestation and 44% of associated carbon emissions in the same period [14, 66], see table 1. Whereas the embodied deforestation area decreased over time, from 3.9 Mha in 2000 to 3.5 Mha in 2011, the embodied emissions slightly increased, from 1.5 GtCO2 to 1.7 GtCO2 (figure 3). The reason for this difference is a steep decline in Brazilian deforestation rates together with a geographical shift of deforestation from Latin America to the countries in Southeast Asia, with increasing deforestation on carbon-rich peat soils, see below and (figure S3).
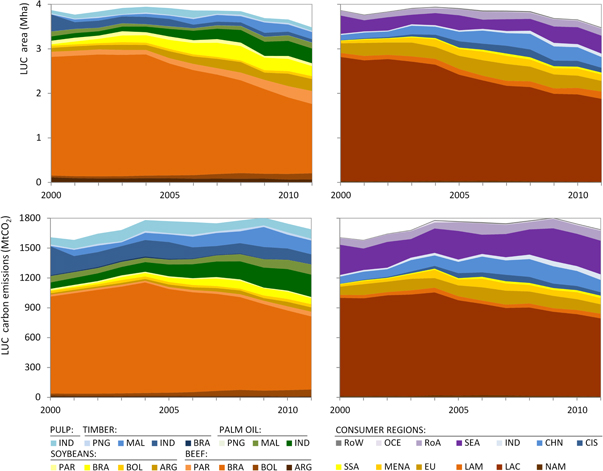
Figure 3. Land-use change (LUC) area (upper panels) and associated carbon emissions (lower panels) embodied in the production of beef, soybean, palm oil and wood products in our seven case countries (left panels; Argentina, Bolivia, Brazil, Paraguay, Indonesia, Malaysia and Papua New Guinea), as well as in the consumption of these products in different regions of the world (right panels; NAM = North America, LAC = Latin American case countries, LAM = rest of Latin America, EU = European Union, MENA = Middle East & North Africa, SSA = Sub-Saharan Africa, CIS = Commonwealth of Independent States (former Soviet republics), CHN = China, IND = India, SEA = Southeast Asian case countries, RoA = Rest of Asia, OCE = Oceania, RoW = Rest of the World; see table S3 for full region classification list).
Download figure:
Standard image High-resolution imageTable 1. Summary of results in terms of land-use change (LUC) area and associated carbon emissions embodied in production and exports of our case commodities. For comparison, total numbers for Latin America, Asia and the Pan-tropical region are also shown.
| LUC area (Mha/yr) | Emissions (GtCO2/yr) | |
|---|---|---|
| Pan-tropicsa | 9.4 | 3.7 |
| Latin Americaa | 4.9 | 1.6 |
| -Case countries and commoditiesb | 2.7 | 1.0 |
| Asiaa | 2.9 | 1.3 |
| -Case countries and commoditiesb | 0.8 | 0.5 |
| Embodied in production 2000–2011 (and 2011)c: | ||
| Beef | 2.7 (2.1) | 1.0 (0.9) |
| Soybean | 0.5 (0.6) | 0.1 (0.1) |
| Palm oil | 0.3 (0.5) | 0.2 (0.3) |
| Wood products | 0.4 (0.4) | 0.4 (0.4) |
| Embodied in exports 2000–2011 (and 2011): | ||
| Beef | 0.4 (0.4) | 0.2 (0.1) |
| Soybean | 0.4 (0.4) | 0.1 (0.1) |
| Palm oil | 0.2 (0.3) | 0.1 (0.2) |
| Wood products | 0.2 (0.2) | 0.2 (0.2) |
aAverage over 2000–2012, taken from [66]. Excludes emissions from peat oxidation. bAverage over 2000–2011. Excludes emissions from peat oxidation. cNote that numbers may not add up to the sums presented in the text due to rounding after first digit.
In 2011, beef was the main driver of forest loss across our case countries, accounting for nearly 60 percent of embodied deforestation (2.1 Mha, of which 1.6 Mha in Brazil alone) and just over half of embodied emissions (860 ± 203 MtCO2), see table 1. Soybean production was the second largest source of embodied deforestation area (0.6 Mha; of which 6% is embodied in the crops double-cropped with soy, see figure S1), whereas oil palm was the second largest source of embodied emissions (327 ± 73 MtCO2). The reason for this difference is a higher biomass carbon content in Southeast Asian forests compared to those in Latin America (especially to Cerrado and Chaco biomes which account for over two thirds of LUC area embodied in Latin American soy production, but just half of embodied emissions; see figure S2), together with the inclusion of soil carbon emissions from peatland conversion, which leads to high CO2 emissions per hectare deforested for oil palm commodities.
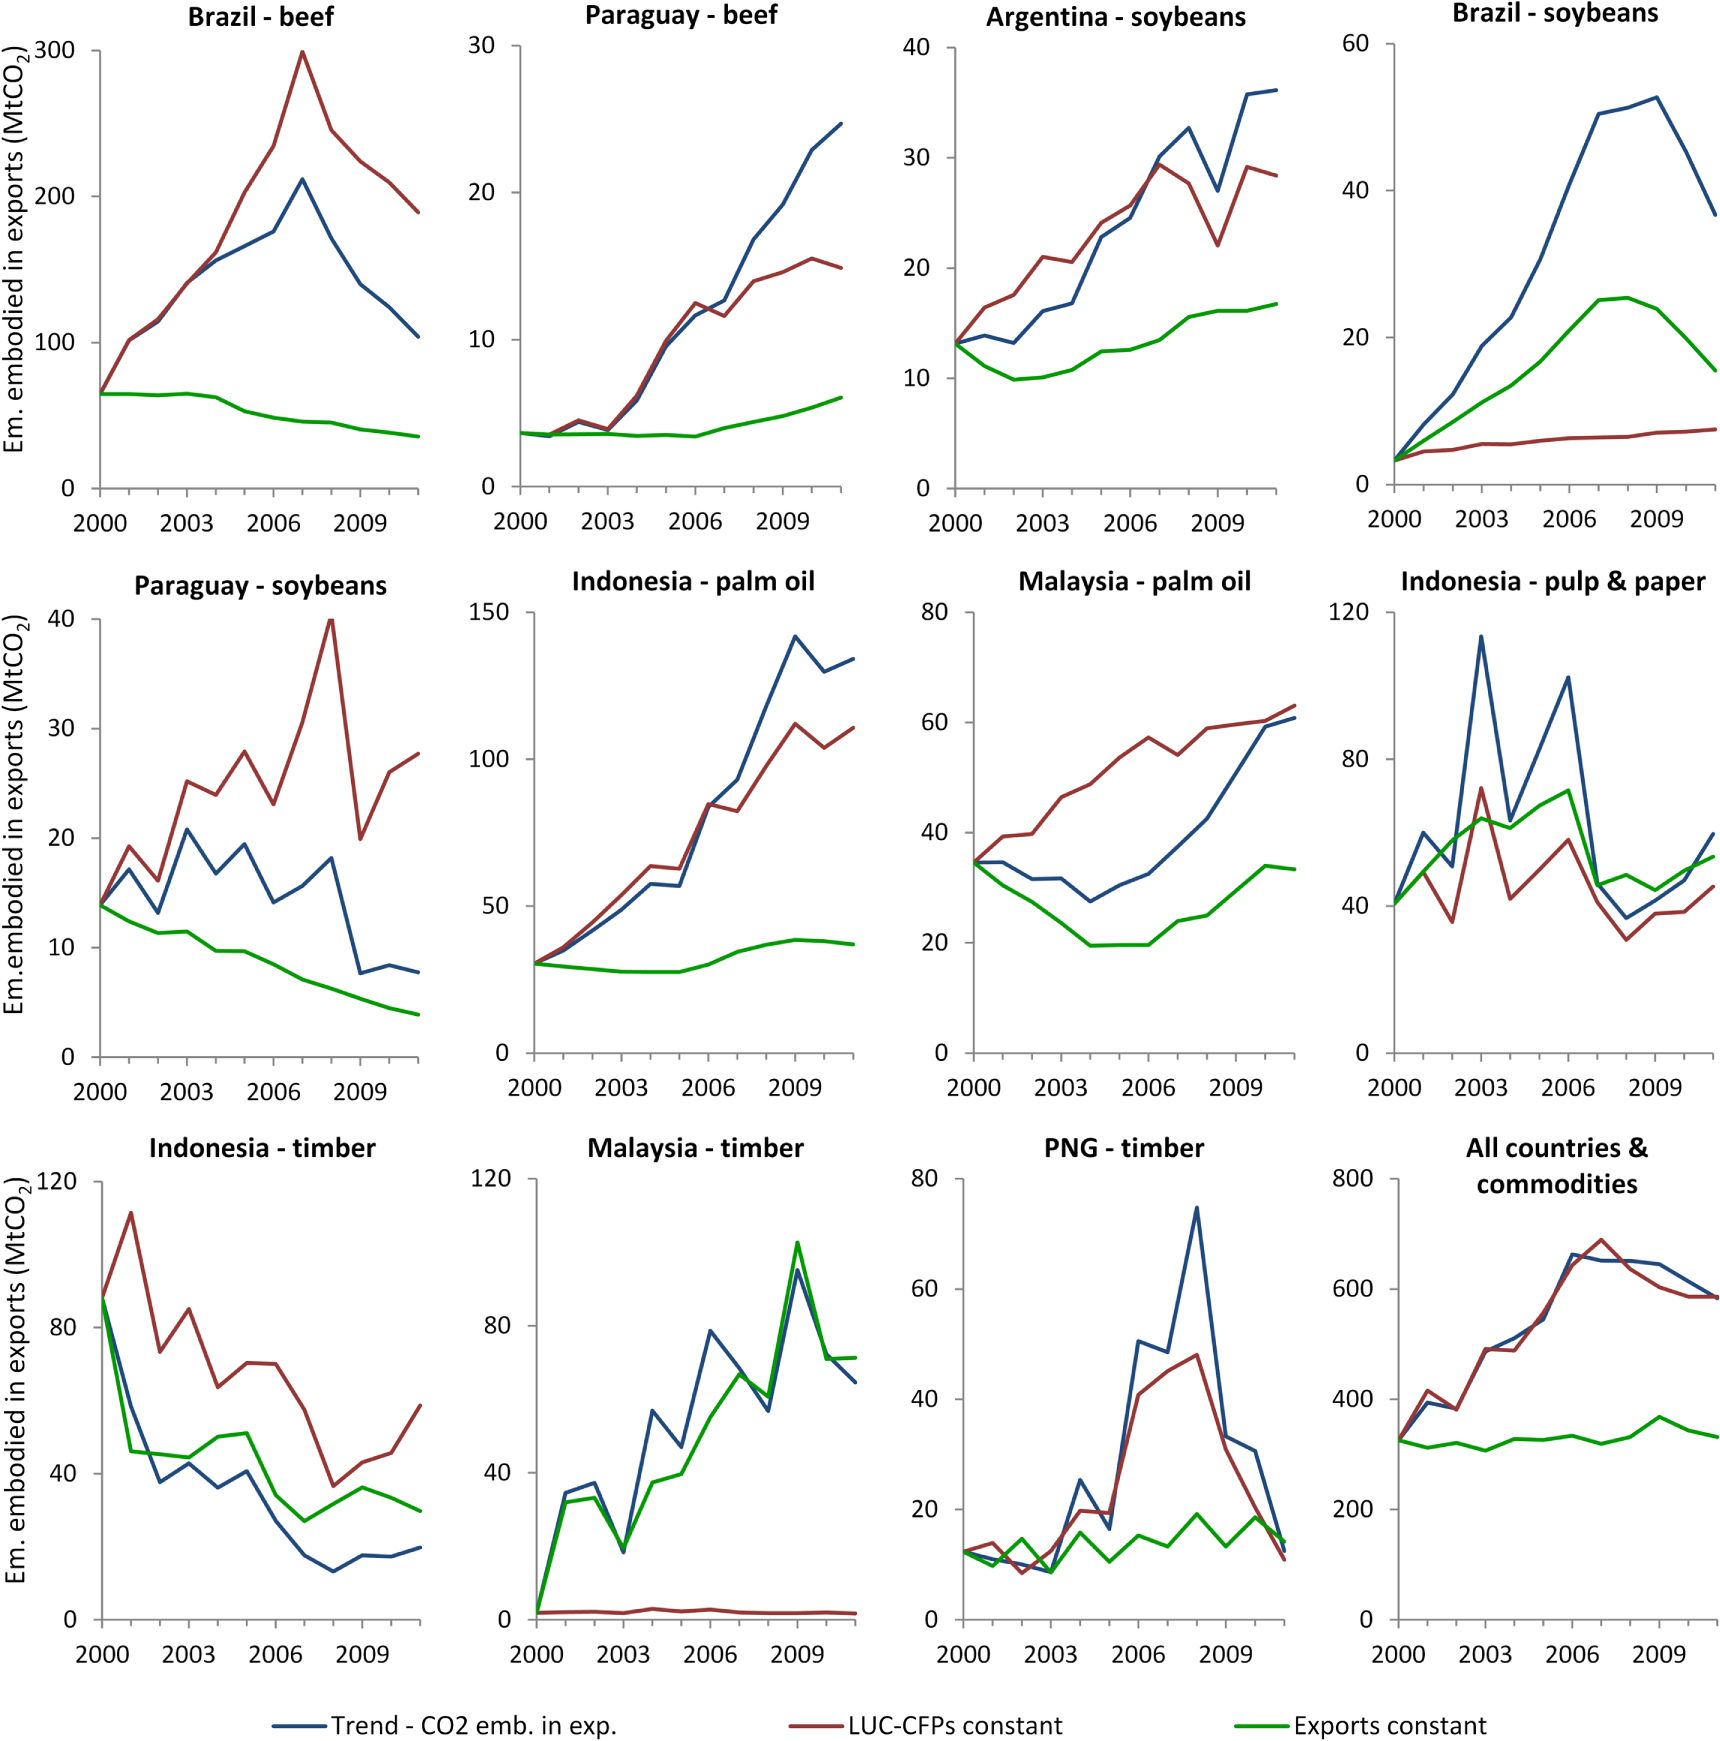
Of the total LUC and carbon emissions, in 2011 just over a third was embodied in exports, with the remainder being consumed in domestic markets. While total LUC and emissions only changed slightly over the 2000–2011 period, the share embodied in exports rose rapidly. In the study period the share of embodied LUC area doubled from 18% to 36%, and the share of embodied emissions increased from 20% to 35%. Nearly all commodities in all countries showed an increasing trend of LUC emissions embodied in exports, something that nearly exclusively was driven by growing trade volumes (figure 4 and S2). There are, however, a couple of notable exceptions. The increase in LUC emissions embodied in Brazilian soy exports was primarily driven by enhanced rates of forest clearing in the Amazon for soy plantations in the first half of the 2000s [67]. Consequently, LUC emissions embodied in exports have dropped sharply following the successful implementation of the Brazilian soy moratorium [21], despite continued increases in export volumes. In Malaysia, LUC emissions embodied in timber exports rose sharply in the 2000s following increased forest clearing for timber and oil palm (figure 2), although timber exports were declining.

Figure 4. Trends in major flows of carbon emissions embodied in exports of beef, soybean, palm oil, and wood products for our case countries (for remaining, minor, country-commodity cases, see figure S4). The trends are decomposed into two drivers: (1) changes in export volumes (calculated by holding constant LUC carbon footprints—for the agricultural commodities—or the carbon emissions from timber extraction in natural forests from year 2000); (2) changes in LUC carbon footprints or the carbon emissions resulting from degradation and clearing of natural forests (calculating by holding export volumes constant from year 2000).
Download figure:
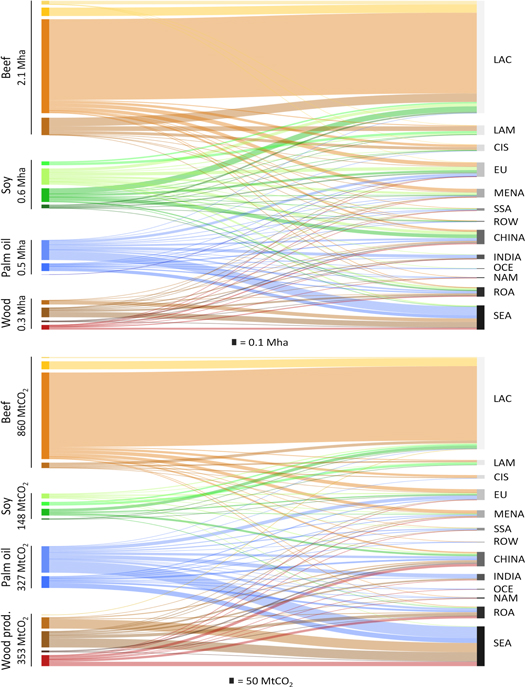
Standard image High-resolution imageFigure 5 gives a more detailed account of the trade links between producers and consumers of LUC and associated carbon emissions embodied in beef, soybean, palm oil, and wood products in our case countries. Domestic beef consumption in the Latin American case countries constituted a major share of the producer to consumer flows, especially in terms of embodied LUC area. In fact, if we exclude Brazilian beef from the analysis, the share of LUC area and associated emissions embodied in exports rises to over 50%. The three most important regions outside the producing countries consuming these embodied flows in 2011 were China (0.24 Mha, 123 ± 17 MtCO2), the European Union (0.24 Mha, 94 ± 16 MtCO2), and rest of Asia (0.16 Mha, 100 ± 14 MtCO2).
Figure 5. Major flows (larger than 1000 ha or 1 MtCO2) of embodied land-use change (upper panel) and associated carbon emissions (lower panel) between producers and consumers of beef, soybean, palm oil and wood products in 2011. For beef and soy products, source countries are displayed in the following order (from top to bottom): Argentina, Bolivia, Brazil, Paraguay; for palm oil products the source country order is Indonesia, Malaysia, Papua New Guinea; for wood products the source country order is Brazil, Indonesia (timber), Malaysia, Papua New Guinea, Indonesia (pulp and paper).
Download figure:
Standard image High-resolution image
Looking at the largest individual export flows between producer countries and consumer regions in 2011, the LUC area list is, somewhat surprisingly, topped by Paraguayan beef exports to other Latin American countries (75 800 ha). This is partly due to the fact that in Paraguay more than half of the beef produced was exported, whereas in the other Latin American case countries most of the beef was consumed domestically. Still, most of the top LUC flows (table S4) are exports of beef and soybean products to markets in Europe, China, the former Soviet bloc, the Middle East and Northern Africa. Top flows of embodied LUC emissions are more diverse, but dominated by Southeast Asian exports of palm oil and wood products to consumers in China, India and the rest of Asia, as well as to the European Union. In addition, Brazilian beef exports to consumers in EU, the Middle East and Northern Africa, and the former Soviet Union countries also figure high in this list.
4. Discussion
The findings presented here are subject to a range of uncertainties. Deforestation and carbon loss estimates in the literature display high variation due to differences in methodologies, underlying forest definitions and assumptions of biomass stocks [68], the latter of which can involve uncertainties of up to 60% [69, 70]. We sought to reduce these uncertainties as much as possible by relying on remote-sensing sources for forest clearing rates, and by using a single, methodologically coherent source of biomass stocks [47]. Based on the estimated uncertainty in [47] and the Monte Carlo analysis conducted here, our estimates of total LUC emissions from the production of our case commodities in 2011 display a relatively modest uncertainty of 15% (95% confidence interval). Uncertainty for emissions embodied in the consumption for each region are in the same range (13%–23%).
Still, we note for instance that the biomass carbon estimate in [47] for Atlantic forest in Paraguay seems very low (51 tC/ha); compared to an estimate of 160 tC/ha for Atlantic forest in northern Argentina [50]. Using this higher value would increase the emissions embodied in Paraguayan soy production from 12 to 37 MtCO2 in 2011. Further uncertainties arise from the exclusion of soil carbon, especially for the conversion of Cerrado and Chaco vegetation to cropland in South America, which can cause soil emissions higher than those from biomass loss [71]. Including soil emissions can increase the LUC carbon footprint for soy by as much as 36% [36]. If we add soil carbon changes to our analysis, in line with the assumptions in [38], the emissions embodied in Latin American soy production in 2011 increase by one third, from 148 to 196 MtCO2. While we did include soil emissions from peatland drainage in Southeast Asia, peatland emissions values cited in the literature usually relate to few sample plots only and involve high uncertainties [45].
Another bottleneck when estimating embodied LUC is the lack of quantified data on deforestation drivers; i.e., information about which land uses replace forest, to determine in how far specific agricultural crops cause deforestation. A recent review of deforestation drivers [10] found quantitative estimates for only 11 out of 100 tropical countries. Still, these were at a highly aggregated level, differentiating only between, e.g., commercial and subsistence farming. This emphasizes the need for further research in this field. In addition, the share of commercial agriculture in driving deforestation presented by reference [10] is most likely underestimated, as our findings suggest that 40% of total tropical deforestation between 2000 and 2011 came from commodity production in our seven case countries alone.
Although a range of remote-sensing studies exist for some countries and crops (e.g., palm oil and timber plantations in Southeast Asia [59, 62, 72]) the results show high variations. Especially for the assumptions regarding the share of deforestation due to clear-cutting of timber and conversion to pulp wood plantations in Southeast Asia, we deem these uncertainties to be large. Also, information on the share of forests logged prior to conversion and the associated biomass loss involves additional uncertainties, as different sources present very different estimates [73].
Changing the amortization period (i.e., the period over which LUC and emissions are allocated to products) affects how responsive the footprint estimates are to changes in deforestation for a given commodity [38], with a shorter amortization period implying that changes in deforestation rates and drivers impact LUC and emissions embodied in production and trade more quickly. Overall, our results are quite insensitive to the choice of amortization period (see figure S5) for values in the range 8–20 years. For lower values, the recent and dramatic drop in deforestation in the Brazilian Amazon is reflected in lower total LUC area and emissions embodied in production. Total LUC area and emissions embodied in exports are however affected to a much lesser extent (figure S6). Finally, uncertainties arise from the FAOSTAT database as the currently only available source of physical bilateral trade data. Therefore the data provided can only be compared to national statistics rather than another international database, making it difficult to consistently evaluate the quality of data.
Our findings are in line with other results, that 33%–49% of deforestation embodied in crop products was traded internationally between 1990 and 2008 [36], and that 30% of Brazilian deforestation emissions between 2000 and 2010 were embodied in beef and soy exports [35]. While several studies roughly agree in the identified trends and the share of deforestation emissions embodied in trade, the absolute results of these studies differ greatly and are not directly comparable, due to different methods and data sources used.
One difference is the direct vs. indirect approach to LUC attribution: studies that adopt a direct approach to LUC footprints attribute LUC to the agricultural commodities produced on the cleared land [e.g., this study, 35, 73]. An alternative approach is to allocate LUC to the commodities based on their relative contribution to the expansion of agricultural area in a country, indicating their indirect contribution to the clearing of natural vegetation [e.g., 24, 36]. In the case of Brazil, adopting the indirect approach would imply a near zero LUC carbon footprint for beef (since the total pasture area in Brazil has been stable in the last decades), whereas sugar cane cultivation would be allocated nearly 20% of LUC emissions [36], although there is hardly any direct clearing of forests for sugar cane in the country. Consequently, demand-side measures targeting this crop would have little impact on deforestation, so that the indirect approach limits the suitability of the results for informing demand-side measures. In other words, if the aim is to inform supply-chain initiatives, like the recent rise of zero-deforestation pledges and commodity moratoria and roundtables, a direct approach that analyzes the proximate drivers of deforestation is more suitable, whereas a discussion on underlying drivers of deforestation can typically inform supply-side interventions (e.g., REDD+ policies).
Another difference lies in the applied trade assessment methods. Some of the studies on deforestation teleconnections [35, 36] trace trade flows to consumer countries using Multi-Regional Input-Output (MRIO) models. Based on monetary flows between different sectors and countries, environmentally-extended MRIO analyses comprehensively assess environmental impacts embodied in final (household or government) consumption. In contrast, the trade-flow framework used here produces results at the level of apparent consumption, implying that the last country in the supply chain (covered by the included level of processing) is considered the consuming country (see methods). While MRIO models cover entire supply chains, they typically group individual products into aggregated sectors, and countries into world regions, which is problematic when assessing individual commodities and countries. To address the limited sector-resolution, MRIO frameworks have been combined with bottom-up life-cycle approaches to create hybrid methods with both depth and detail [74, 75]. However, we are not aware of a study on deforestation and land-use emissions employing this approach.
Approaches based on biophysical information such as the method applied here provide a higher resolution at the product-scale [24]. They do, however, omit trade in highly processed products, which introduces additional uncertainties. For instance, our numbers include trade in paper and newsprint, but not in books. Additionally, indirect flows covered by MRIO assessments (e.g., the amount of biofuels used in the production chain of beef) are excluded here. Several recent studies discuss the differences between trade approaches in more detail [76–80]; here we would like to stress that these differences should be kept in mind when comparing our results to those of MRIO-based assessments.
Despite the methodological differences, the results of the MRIO study by Karstensen et al [35] are similar to the findings for Brazil presented here, regarding the percentage of emissions embodied in exports, the increasing trend over time, and the main consumer countries. However, the absolute results of our studies differ substantially, since [35] allocates all deforestation in Brazil to commercial agriculture whereas, based on the literature [81], we allocate around 20% of deforestation to other activities such as smallholder farming. In addition, [35] attributes a much larger share of deforestation to soy, assuming that most of the land cleared in the Amazon forest biome is cropped with soy for the first years before being converted to pastures. Similarly, our results of LUC drivers in Brazil are in line with the findings of Lenzen et al [82], who used Structural Decomposition Analysis in a MRIO framework to identify the most important causal paths behind LUC as domestic beef consumption and breeding, beef for export, and soy production.
The general trend of rising emissions embodied in exports shown here has also been described in global assessments of fossil-fuel emissions embodied in trade [30–33]. These find growing transfers of embodied emissions between regions, including from countries without to countries with climate policy targets [30]. This indicates an overall international displacement effect where domestic emissions reductions in industrialized nations are offset by increases in and exports of emissions from developing countries. These trends highlight that supply-side measures alone, e.g., in the form of payments for good forest stewardship and reduced deforestation as in REDD+, may not be effective in the long-term, both because of the risk that international economic factors might override national policies [83] and because globalized drivers pose a high risk for international leakage effects [84].
Complementing forest conservation measures in tropical countries with demand-side measures therefore seems promising. However, it is also important to acknowledge the limitations of demand-side initiatives, be it certification schemes [85], commodity roundtables or moratoria [86], or zero-deforestation pledges. A key point is the fact that LUC is driven by marginal increases in demand, implying that most production will come from land not recently deforested. In our analysis the share of total production of our case commodities in 2011 that originates from land cleared in the previous ten years is below 15% for almost all commodities and countries (figure S7). This implies that unless nearly all of the market is covered by zero-deforestation standards, there is a large risk that the share of production linked to recent deforestation is simply diverted to markets not demanding these standards. This type of leakage has been documented for example for the Brazilian Cattle agreement, where non-compliant ranchers simply sell their cattle to slaughterhouses not participating in the agreement (or launder the cattle, by moving them to compliant ranches before transport to slaughter) [22].
5. Conclusion
In this study we have shown how the production of a few forest-risk commodities in a small number of tropical countries is responsible for a substantial share of total tropical forest loss. We also conclude that production for export markets plays an increasing role in promoting agricultural expansion and LUC in the tropics. This and similar studies illustrate the role of consumers in furthering LUC, and advance the understanding of distant driving forces for tropical deforestation, which are becoming increasingly important in addition to domestic factors. This trend implies that supply-side measures such as REDD+ might be overridden by increasing international demand or undermined by leakage to countries without REDD policies in place. Quantifying global teleconnections can support the design of demand-side measures to complement supply-side action to decrease global deforestation levels. However, our analysis also points to the limits of demand-side measures, which carry the risk of being seriously undercut by leakage effects unless market coverage is close to complete. Effective forest conservation in the tropics is therefore likely to require a combination of supply- and demand-side policies [87], which has been identified as one reason for the dramatic reduction of deforestation in the Brazilian Amazon [88]. A key avenue for future research in this area is therefore how these different types of policy interventions interact [89, 90], in order to understand how demand-side policies can best be used to leverage support for other regulatory (supply-side) forest conservation policies.
Acknowledgments
This work was supported by the Swedish Research Council (FORMAS), the Norden Top-level Research Initiative subprogramme 'Effect Studies and Adaptation to Climate Change' through the Nordic Centre of Excellence for Strategic Adaptation Research (NORD-STAR), the European Research Council Grant ERC-263522 (LUISE), and the Center for Global Development (CGD). We are grateful to the two anonymous reviewers for helpful comments.
Footnotes
- 4
Forest-risk commodities are products whose cultivation involves deforestation and vegetation clearing in the producing countries [19].
- 5
The term here refers to exports from the countries where the primary commodity is produced, as opposed to countries that import a commodity and export it—often after processing-again.