

Dear Clemson Tigers,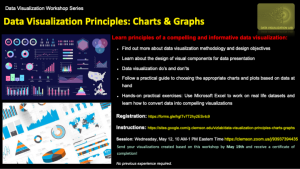
The Clemson Data Visualization Lab is pleased to announce the third Data Visualization Principles: Charts & Graphs workshop. The knowledge of data visualization and the skill of choosing the right plots and charts to demonstrate the relationships in data at hand are vital for scientists to find new research insights. In this workshop you’ll learn how to:
Find out more about data visualization methodology and design objectives
A practical guide to choosing the appropriate charts and plots based on data at hand
Hands-on practical exercises: Using Microsoft Excel to work on real life dataset and visualization
Instructions are available at https://sites.google.com/g.clemson.edu/vizlab/data-visualization-principles-charts-graphs
Session for this workshop will be held on Wednesday, May 12, 10:00 AM – 1:00 PM Eastern Time https://clemson.zoom.us/j/93937394435.
If you cannot make this session, you can always email me directly at yousefi@nullclemson.edu
Registration: https://forms.gle/yzeBGfduRVCXKD128
This workshop is suitable for all Clemson students, staff, and faculty, specifically those who are interested in data visualization. There is no need for prior experience to attend the workshop. In order to receive a certificate of completion send your visualizations created based on this workshop by May 19 to yousefi@nullclemson.edu.
Mehrdad Yousefi
Clemson Data Visualization Lab