The aggregation for the count field in counter values appears to be a rate rather than the actual count:
This particular counter is incremented by one, so sample_rate is basically the same graph, scaled to 1/s instead of 1/aggregation interval.
| • GWicke | |
| Aug 8 2015, 4:22 PM |
| F2538460: graphite.wikimedia-2.png | |
| Sep 3 2015, 9:58 PM |
| F2538457: graphite.wikimedia-1.png | |
| Sep 3 2015, 9:58 PM |
| F872686: pasted_file | |
| Aug 8 2015, 4:22 PM |
| F872427: pasted_file | |
| Aug 8 2015, 4:22 PM |
The aggregation for the count field in counter values appears to be a rate rather than the actual count:
This particular counter is incremented by one, so sample_rate is basically the same graph, scaled to 1/s instead of 1/aggregation interval.
that's by design, counters are reset at each flush interval, https://github.com/etsy/statsd/blob/master/stats.js#L105
@fgiunchedi, I guess the idea would be to aggregate a sum with another sum in graphite, so that we end up with a monotonically increasing counter.
thoughts on how to do that? also what's the underlying problem you are trying to solve?
what's the underlying problem you are trying to solve?
The main problem I'm trying to solve is counting events like page views. The aggregation of rates is currently fairly murky (see also T111170), and it isn't clear how we can get a reliable count out of a statsd counter. It might actually make more sense to sum the sum property in graphite for this.
I'm not even sure it'll work with sum, looking at T111170 there count gets aggregated by summing but the graphs don't look like an ever increasing counter due to flush periods.
To achieve sth like an ever increasing counter I'd suggest keeping an internal counter that increments on page view and push that as a gauge per-service, on service restart it gets reset to 0 but that's easy to detect and doesn't alter summing, to get total page views you can sum across different services. That incidentally makes it slightly more reliable since losing one push of the counter isn't as bad. Of course if you want reliable tracking analytics-type analysis is more suited
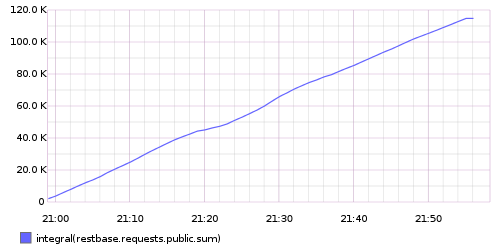
@Krinkle: Good point! Had missed that integration is supported. It might not be as precise as actually summing up the values, but is probably the closest we can get for now & good enough to get an order of magnitude.
@Krinkle nice !
I've added a FAQ section at https://wikitech.wikimedia.org/wiki/Graphite since this will come up again