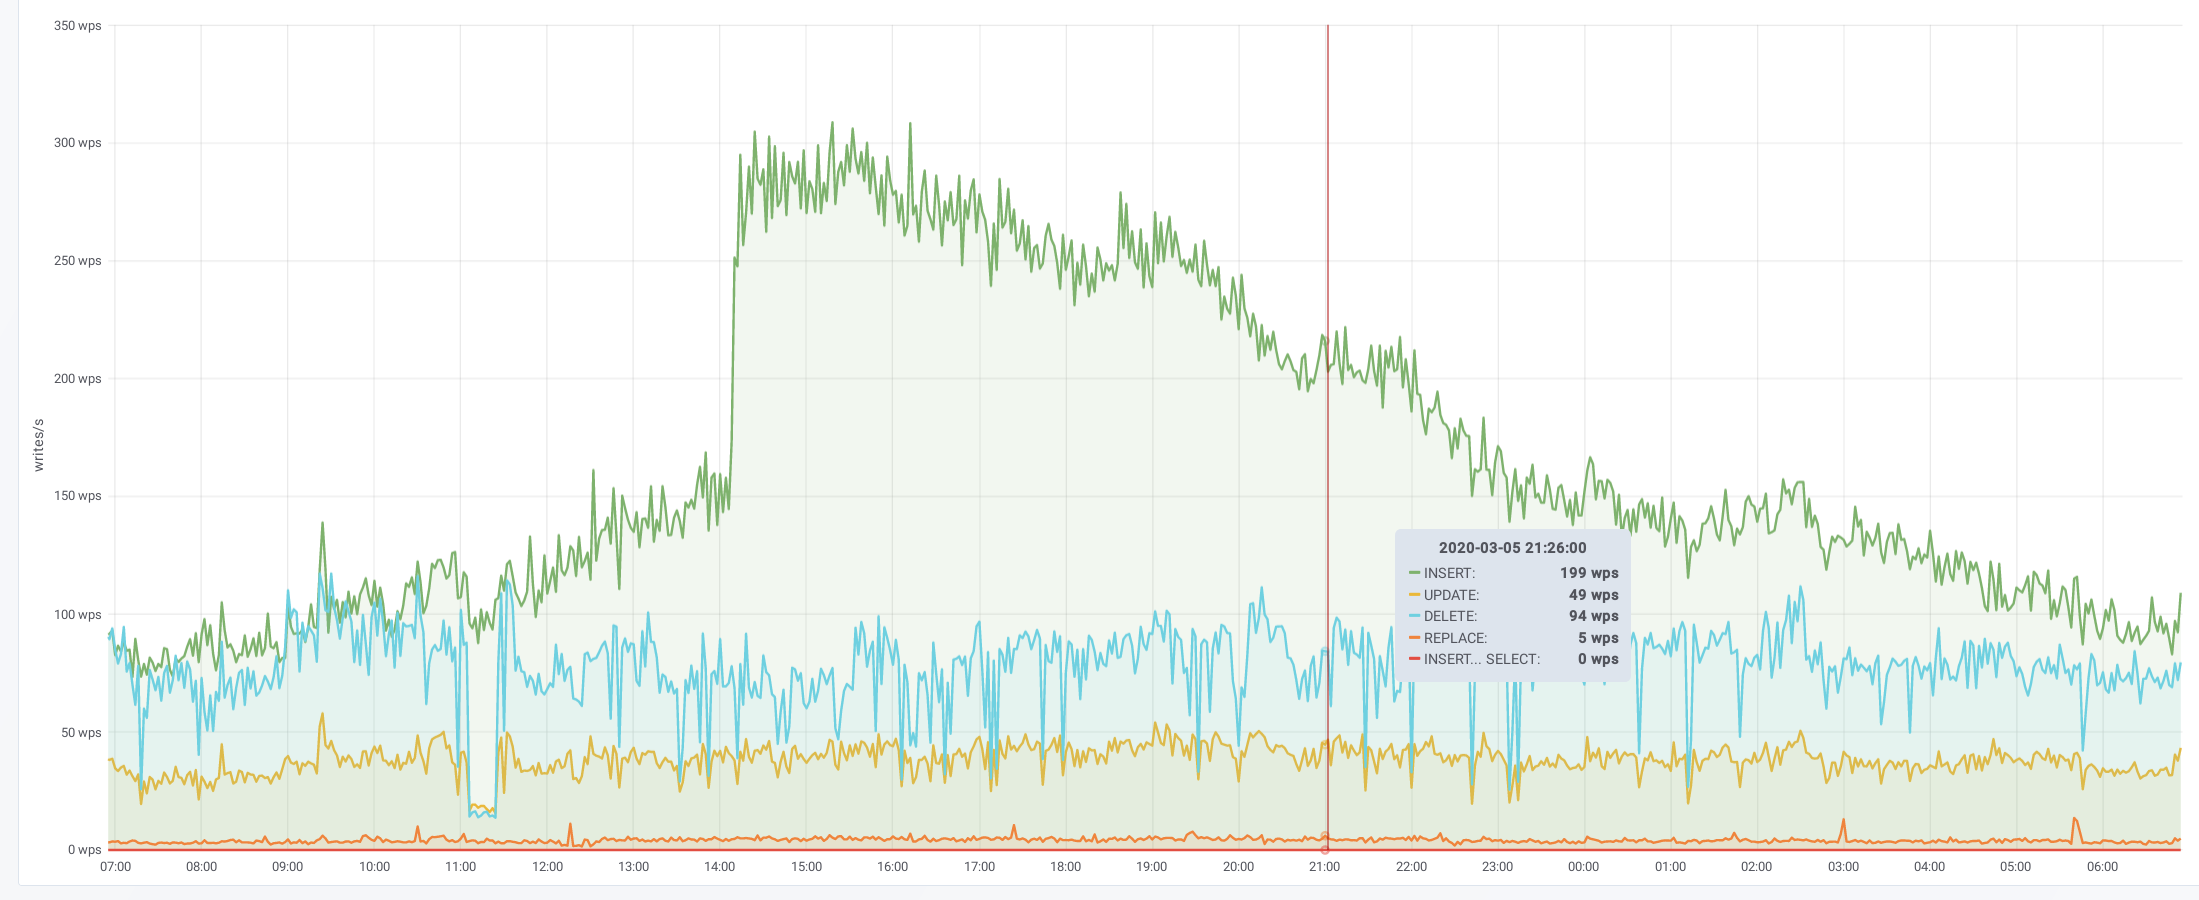
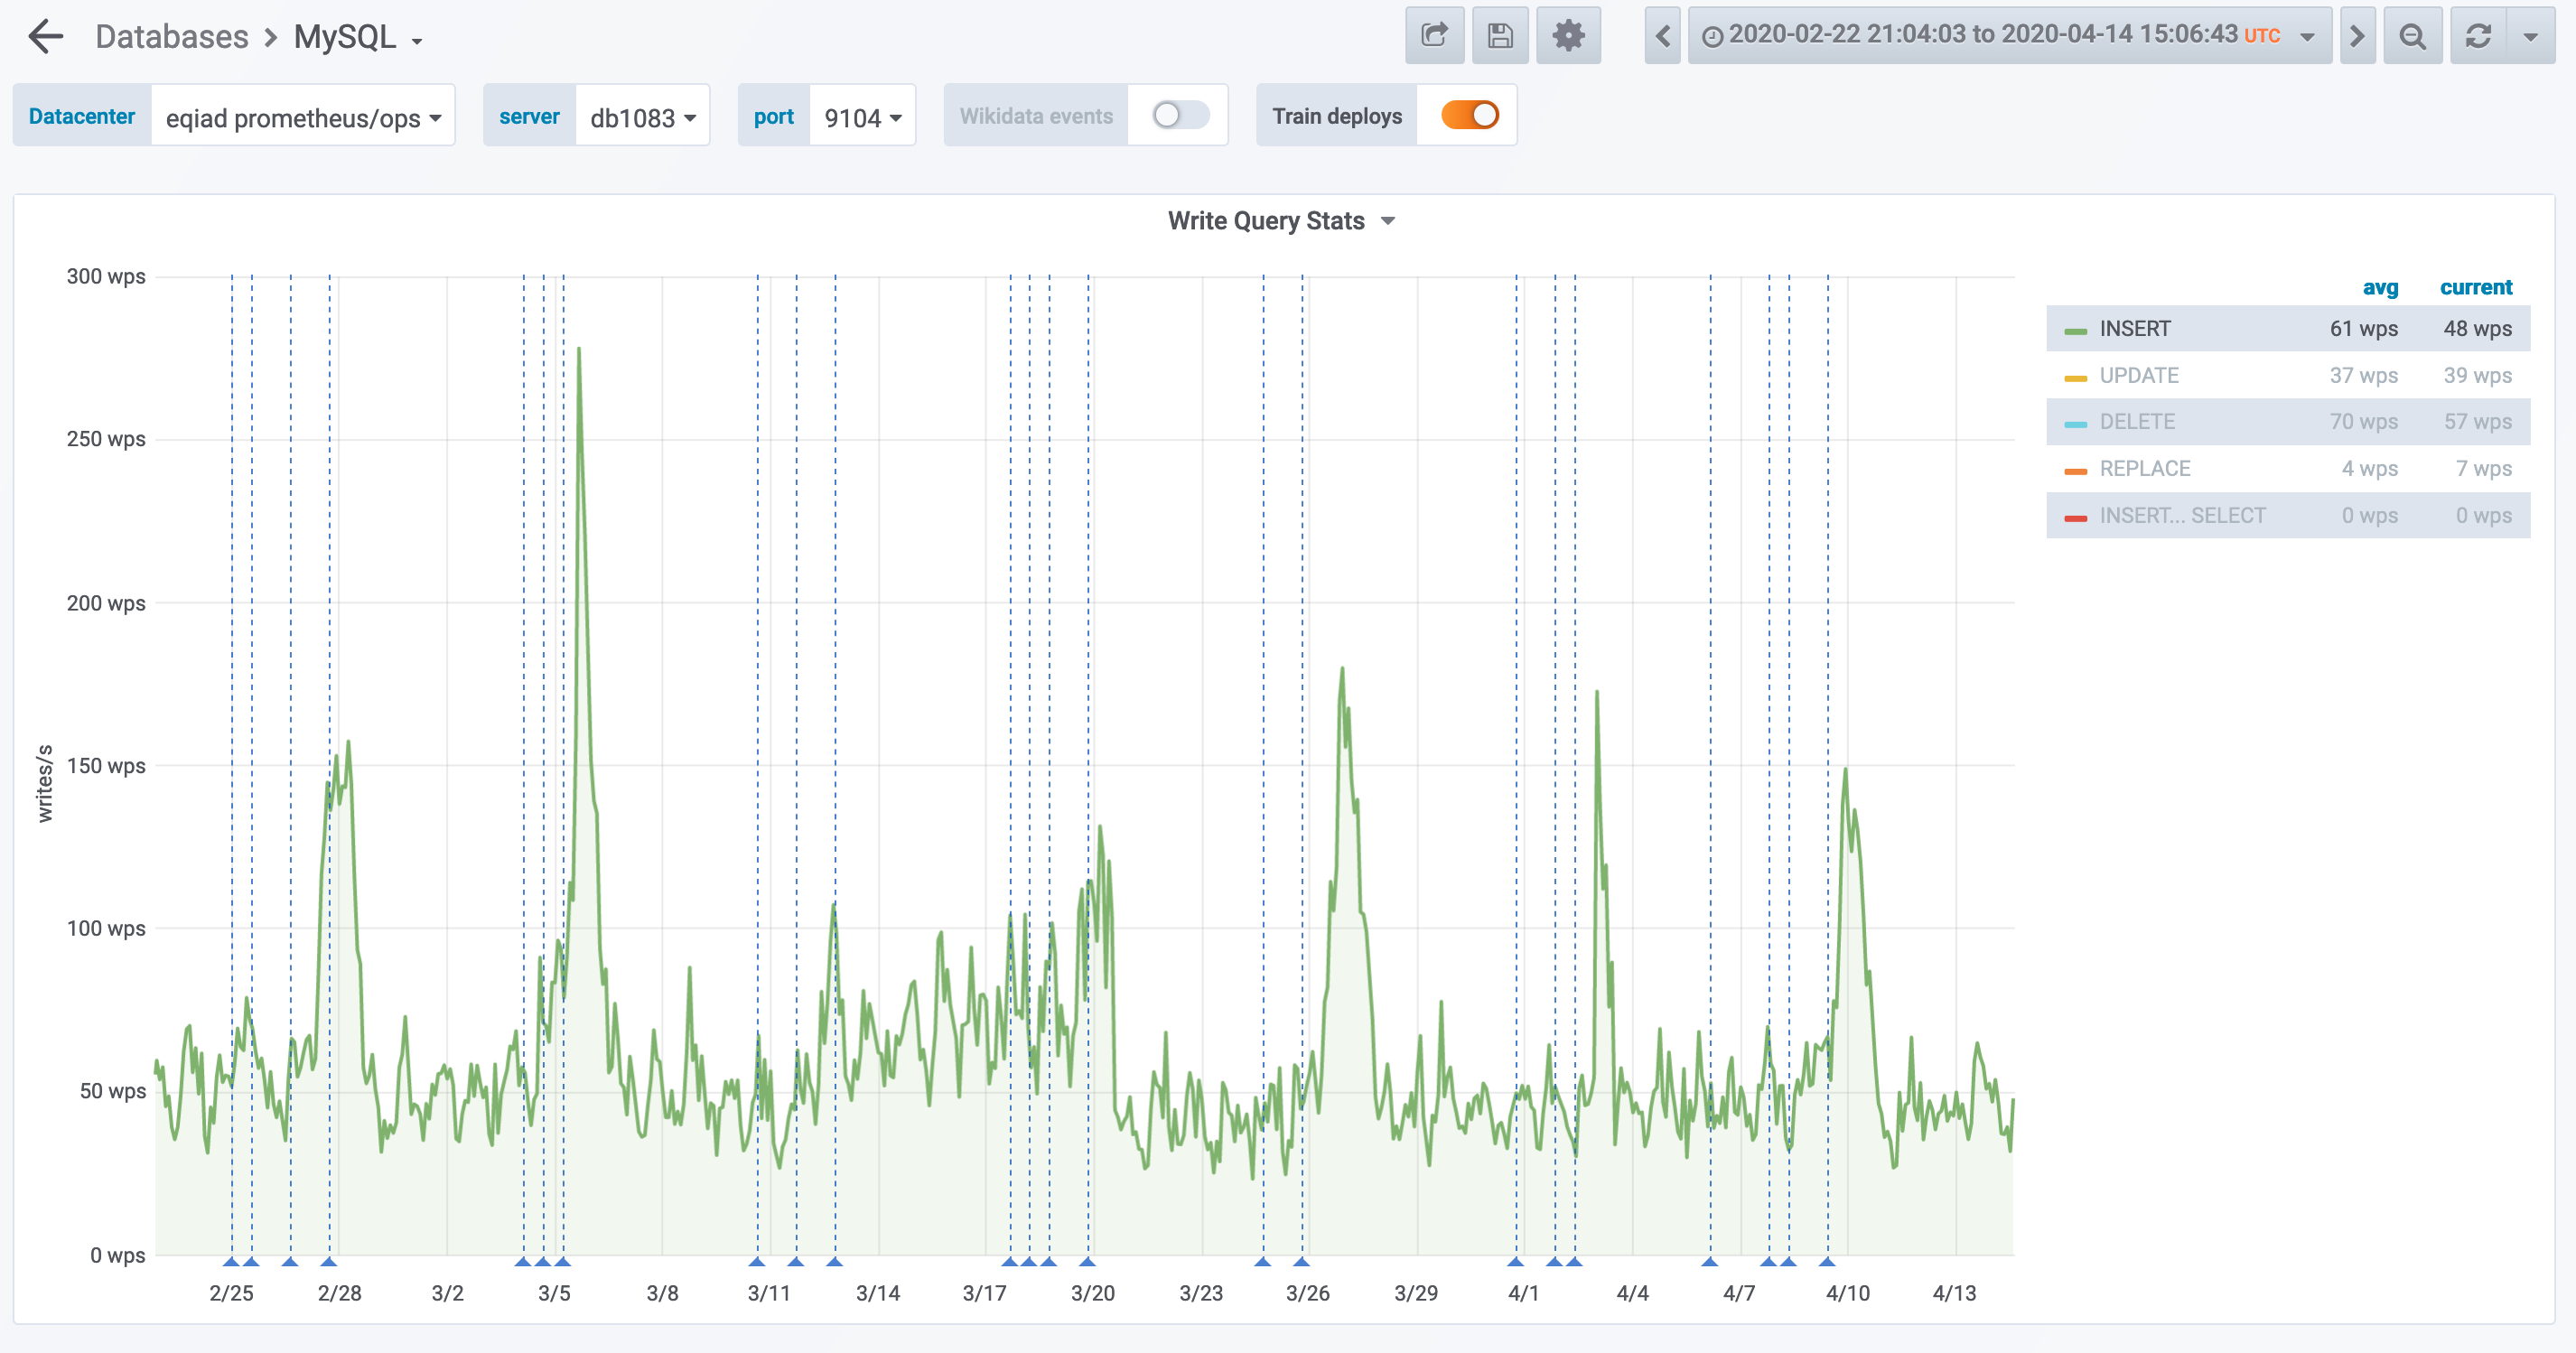
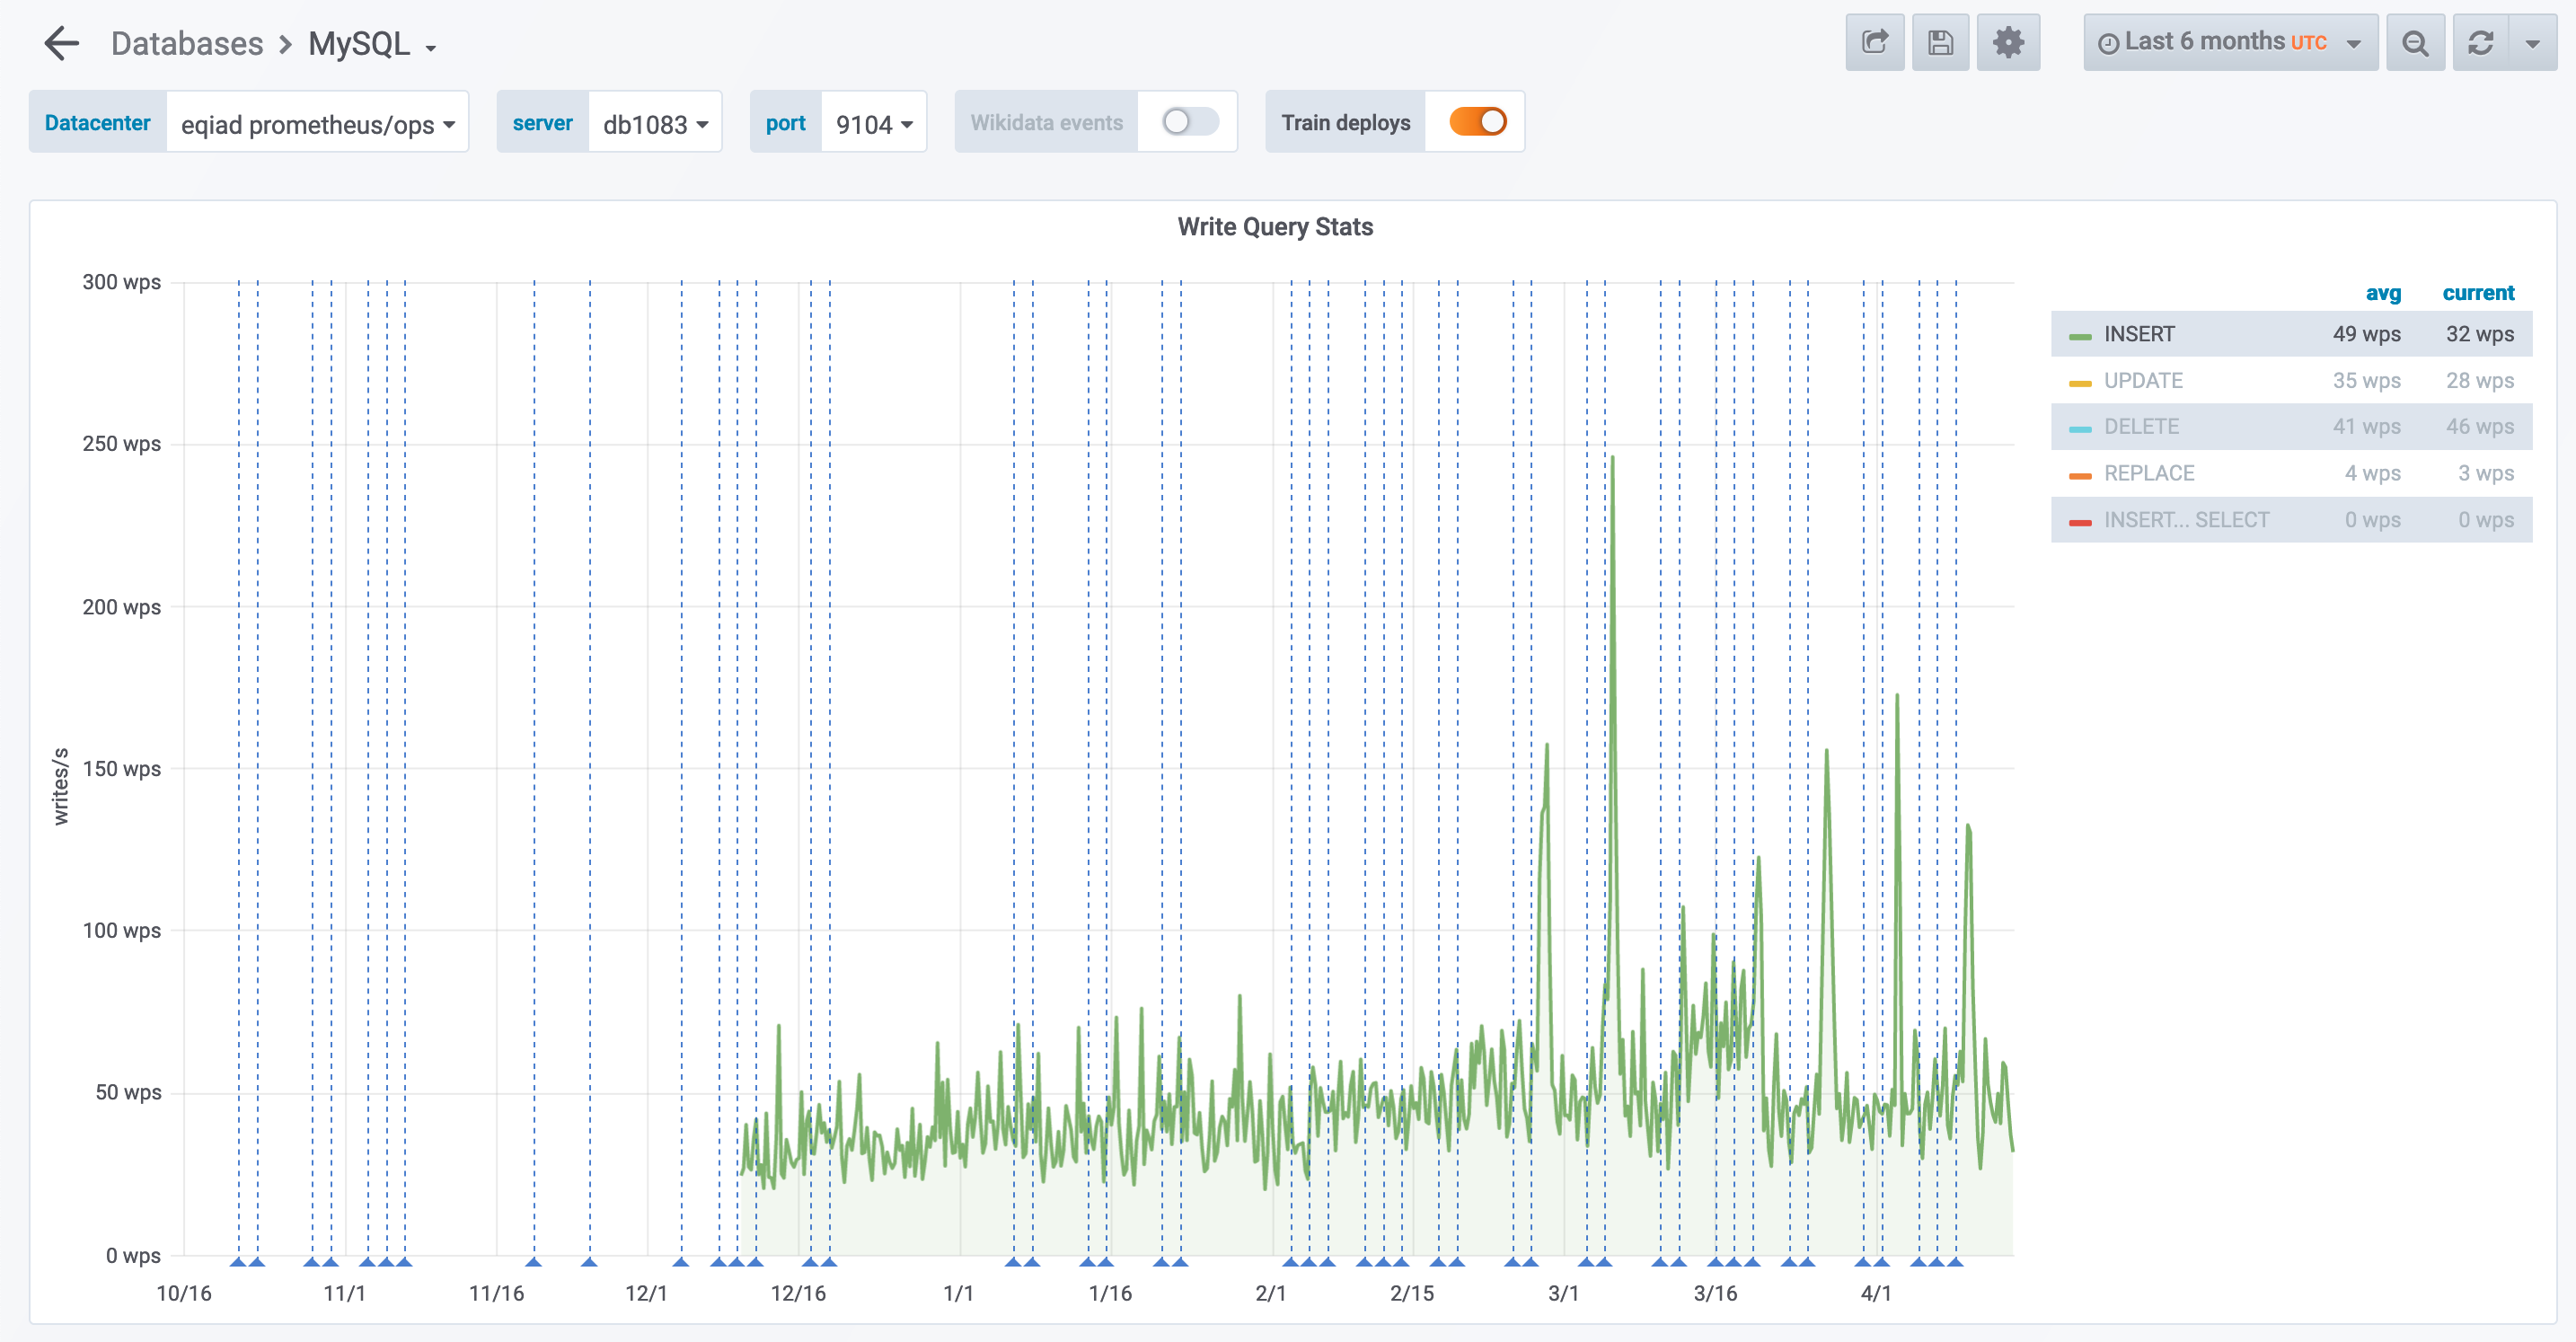
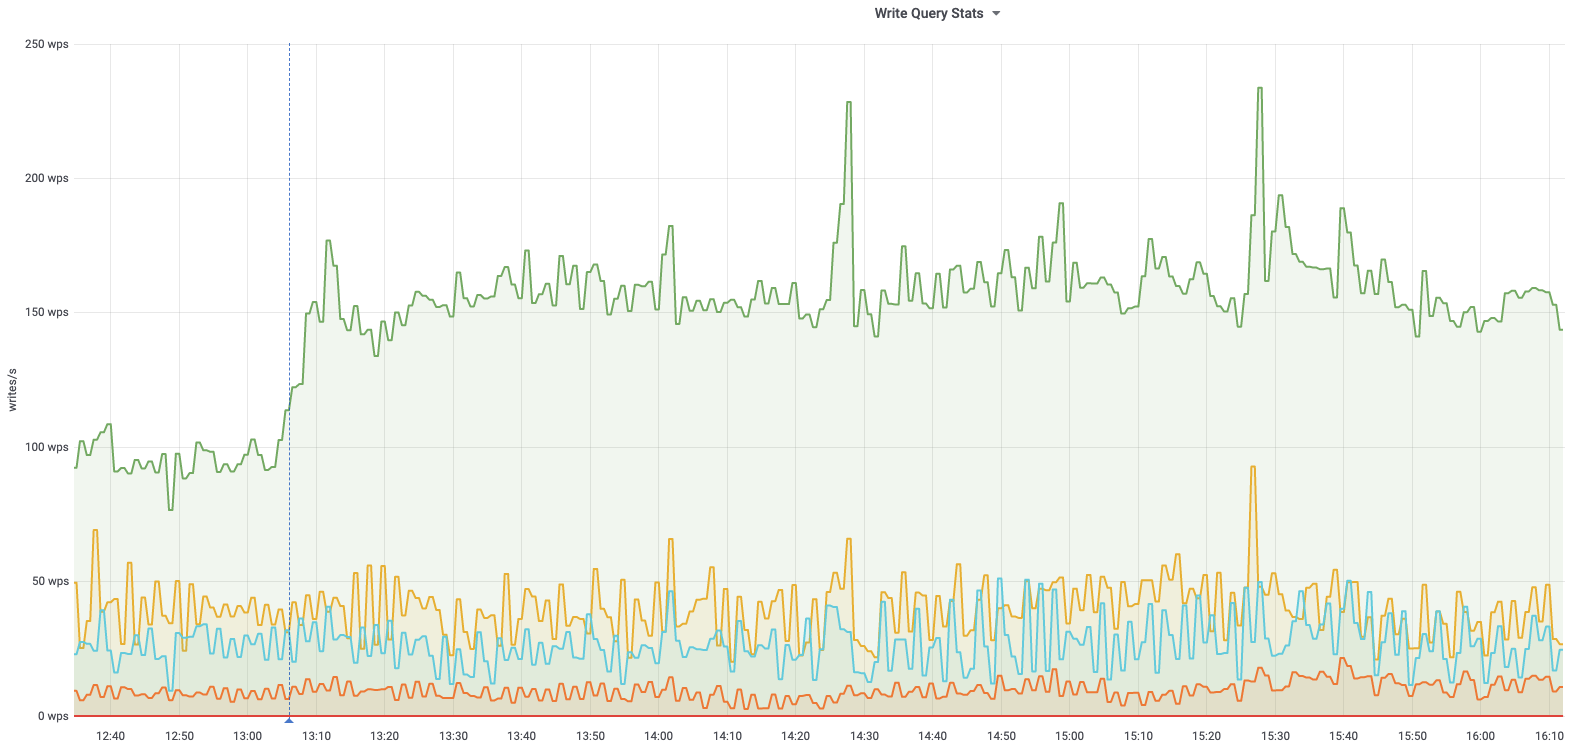
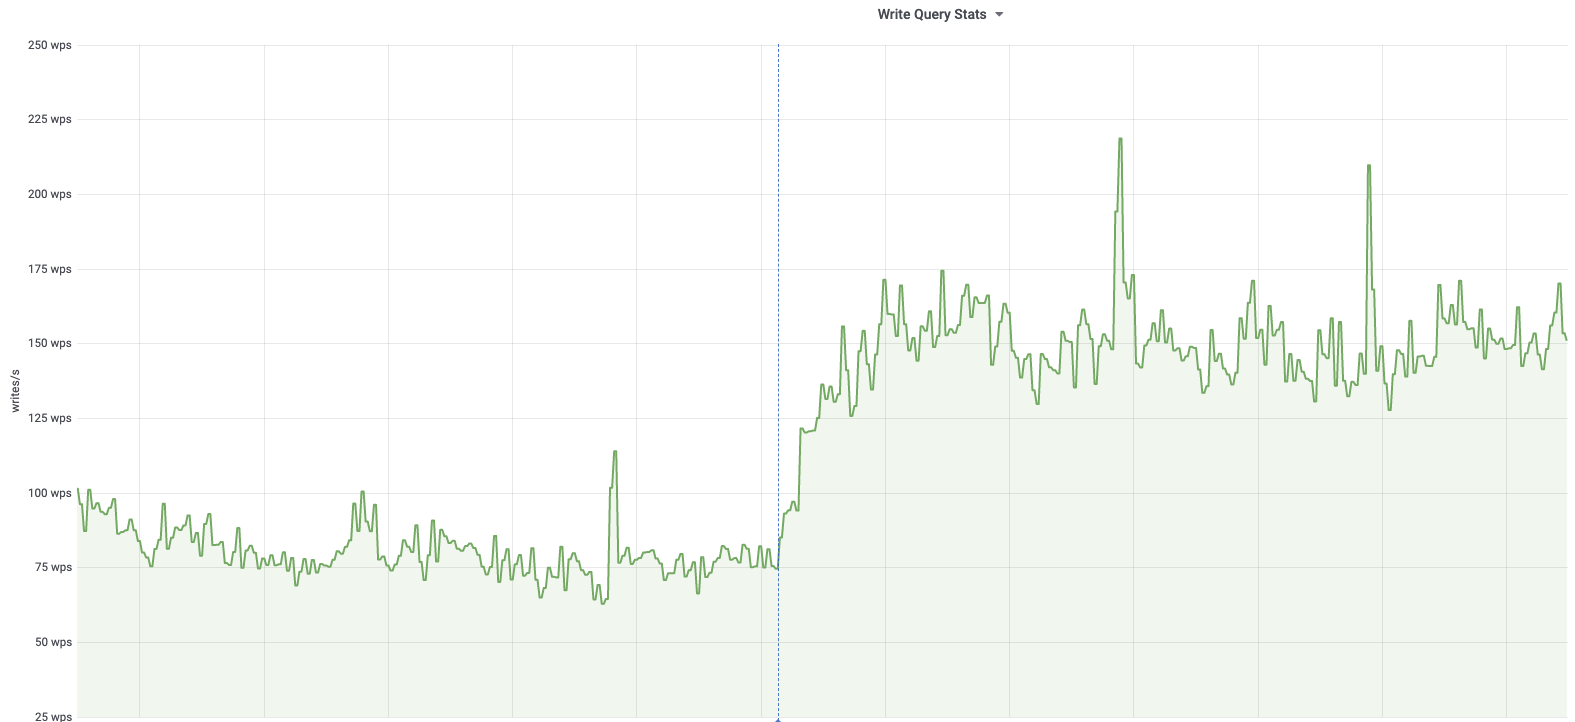
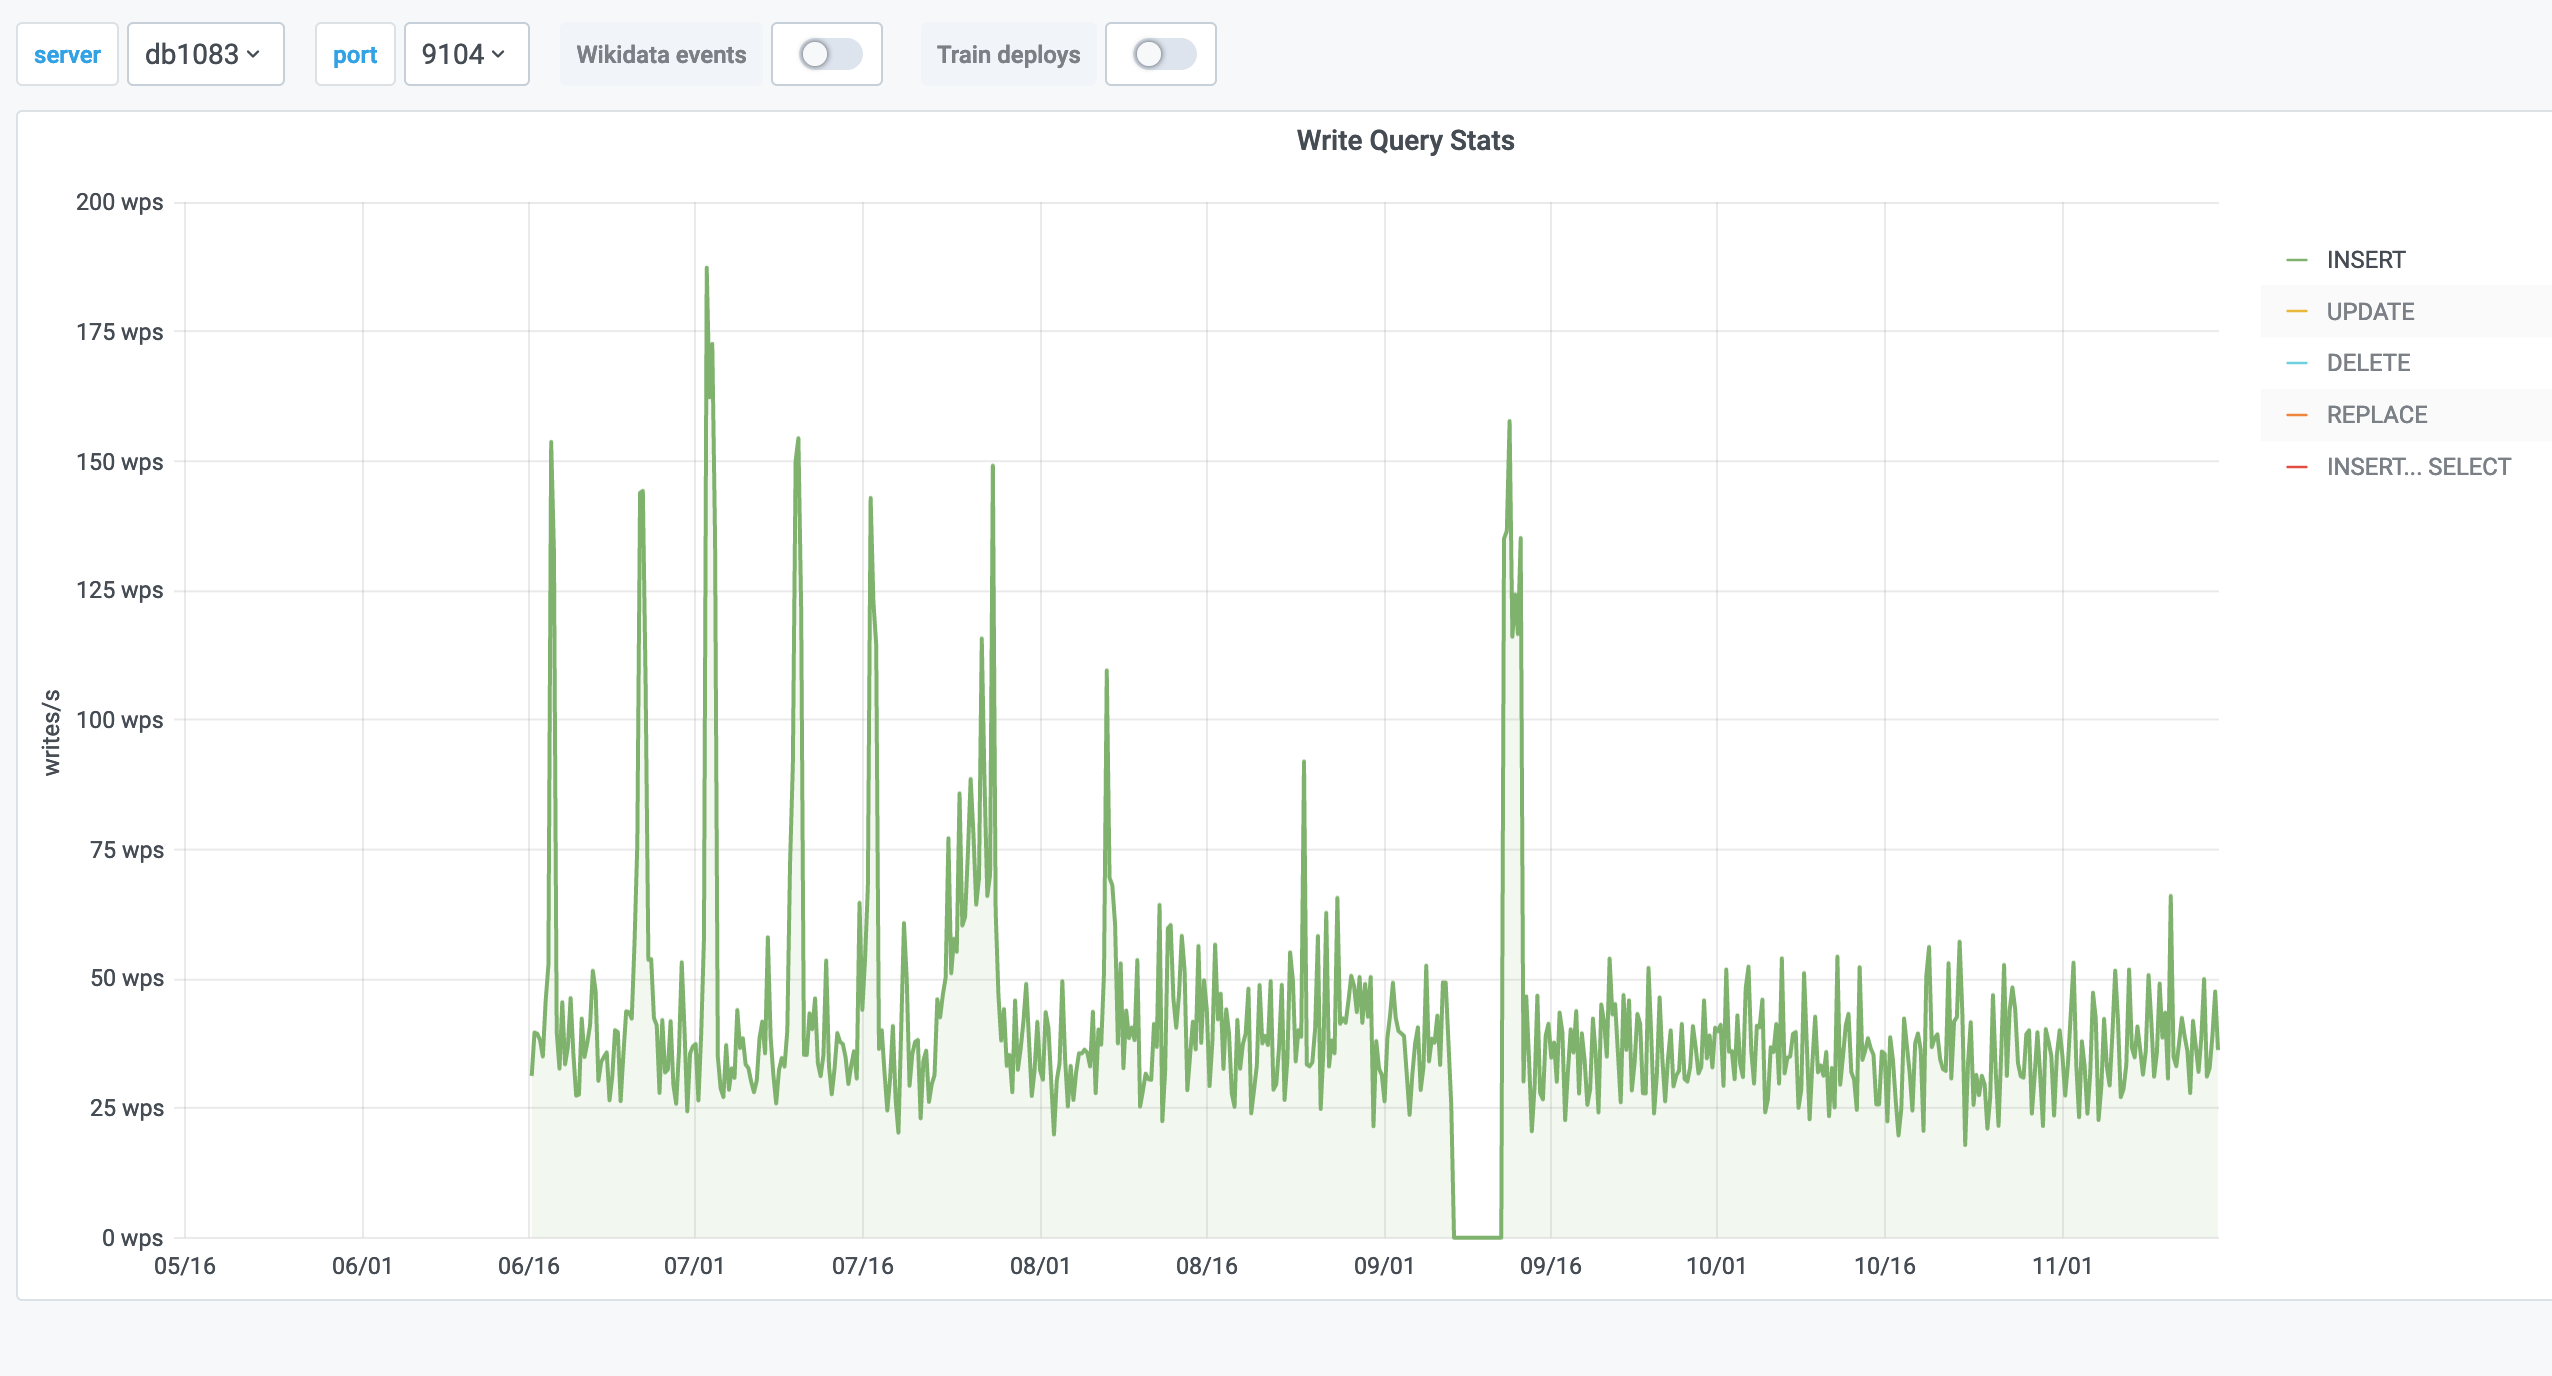
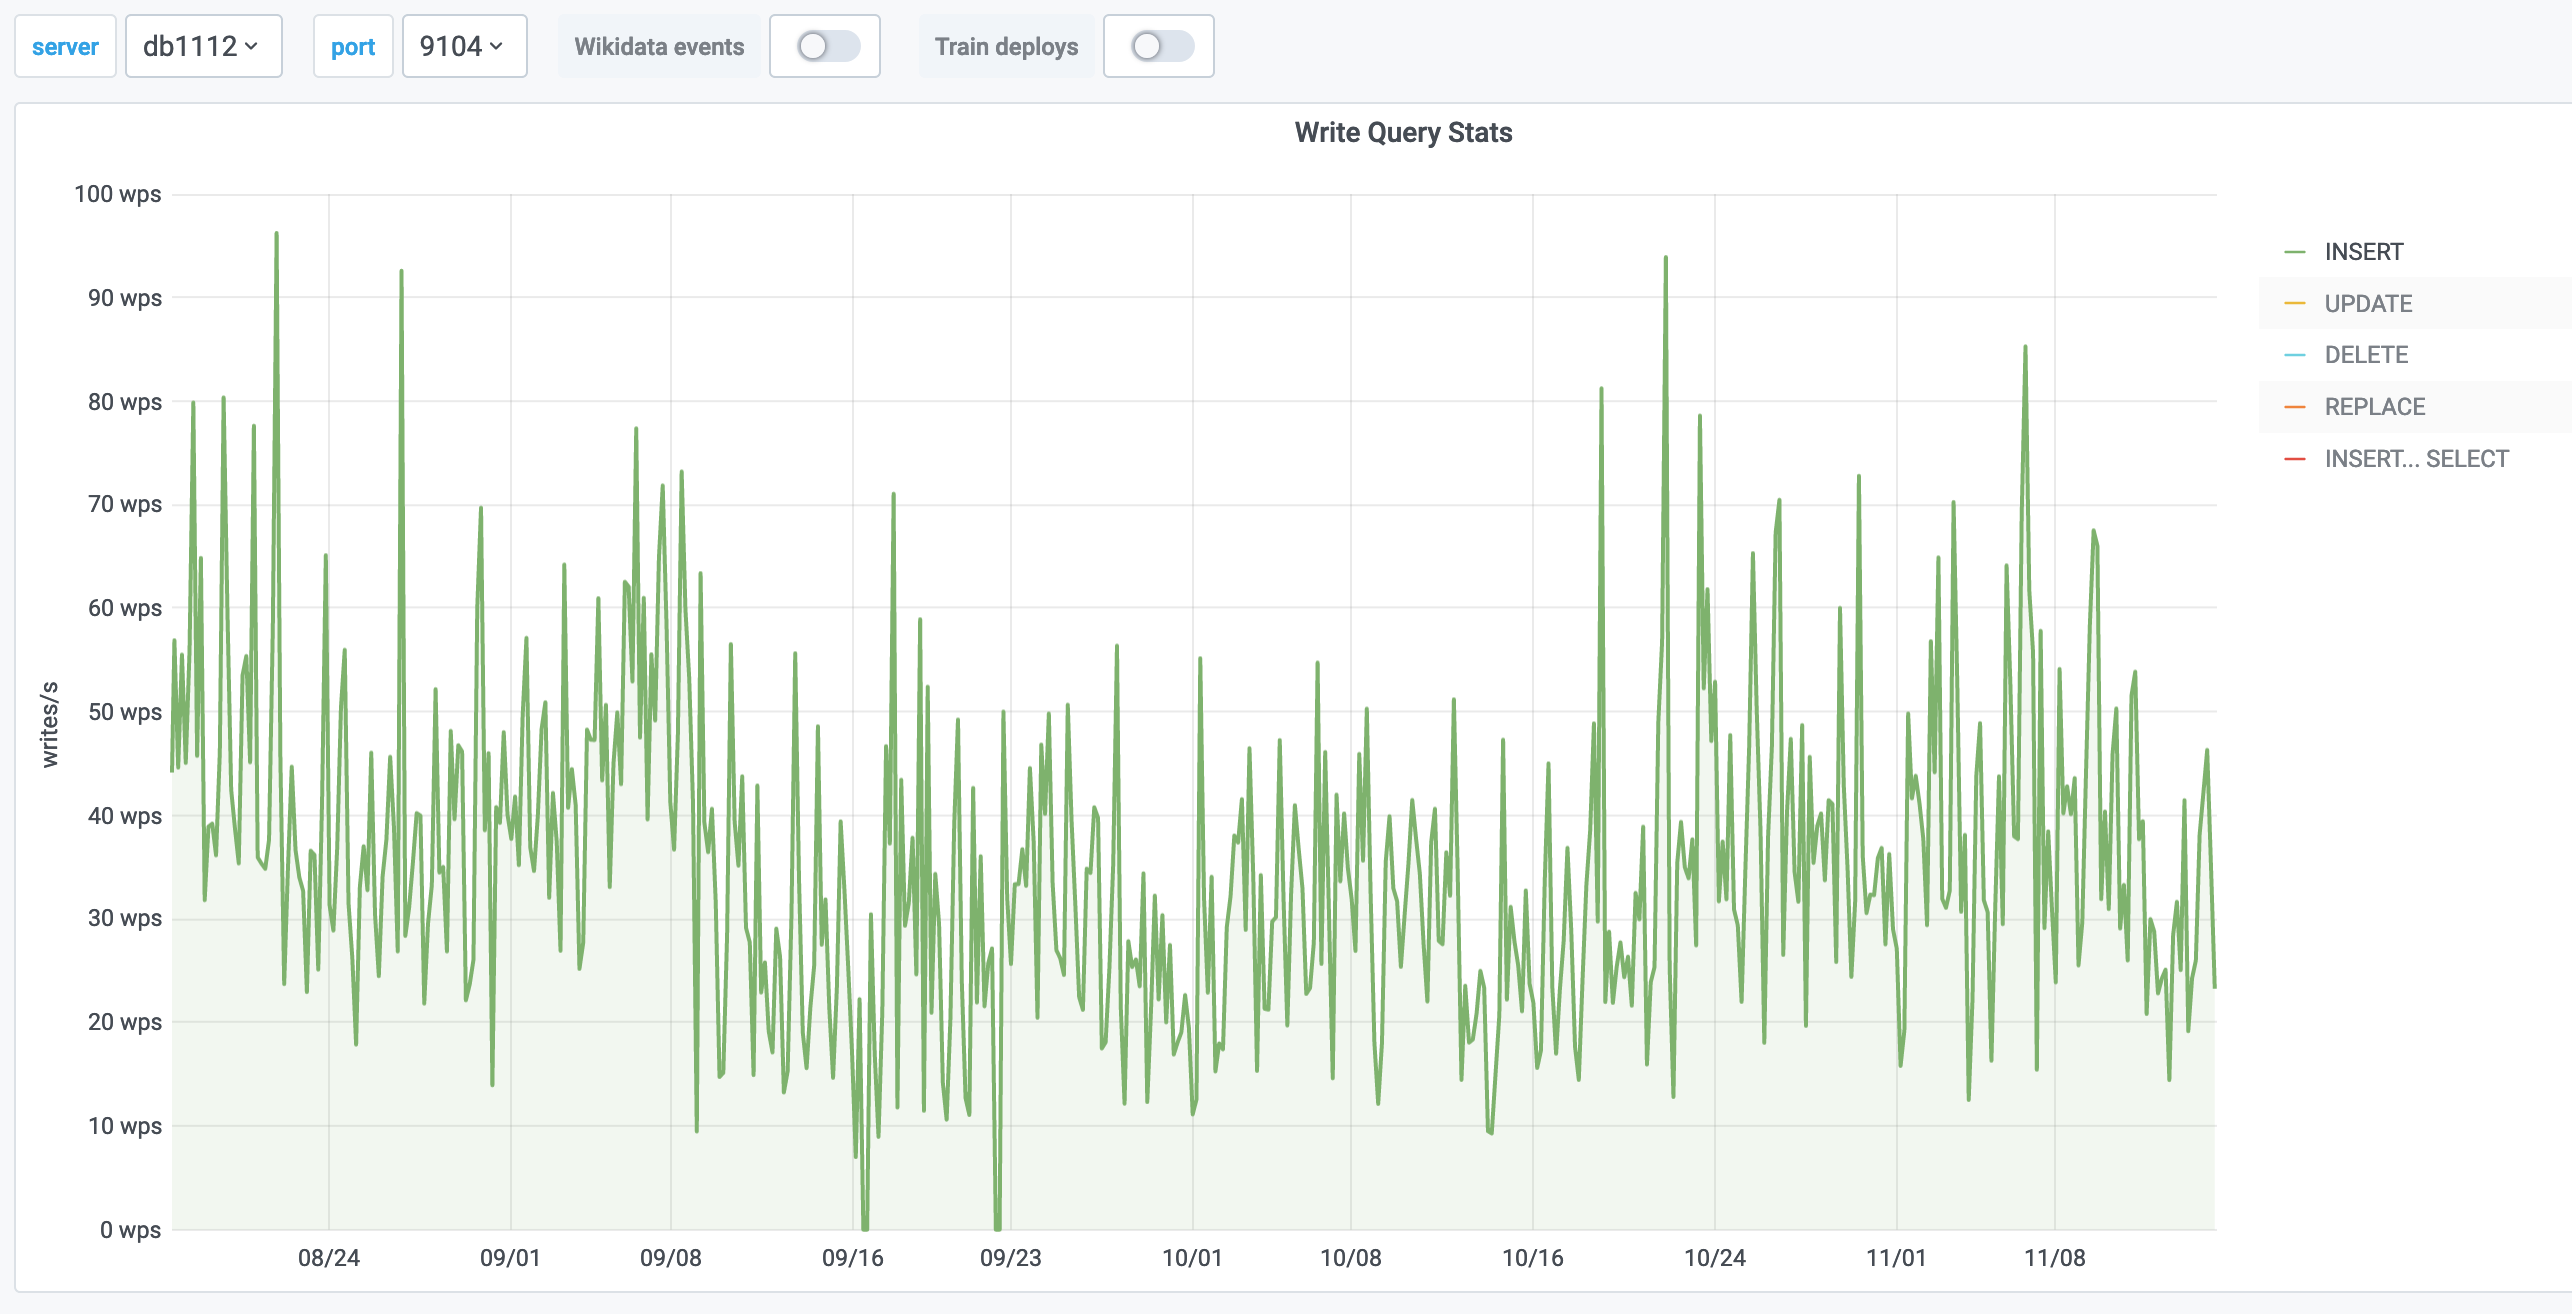
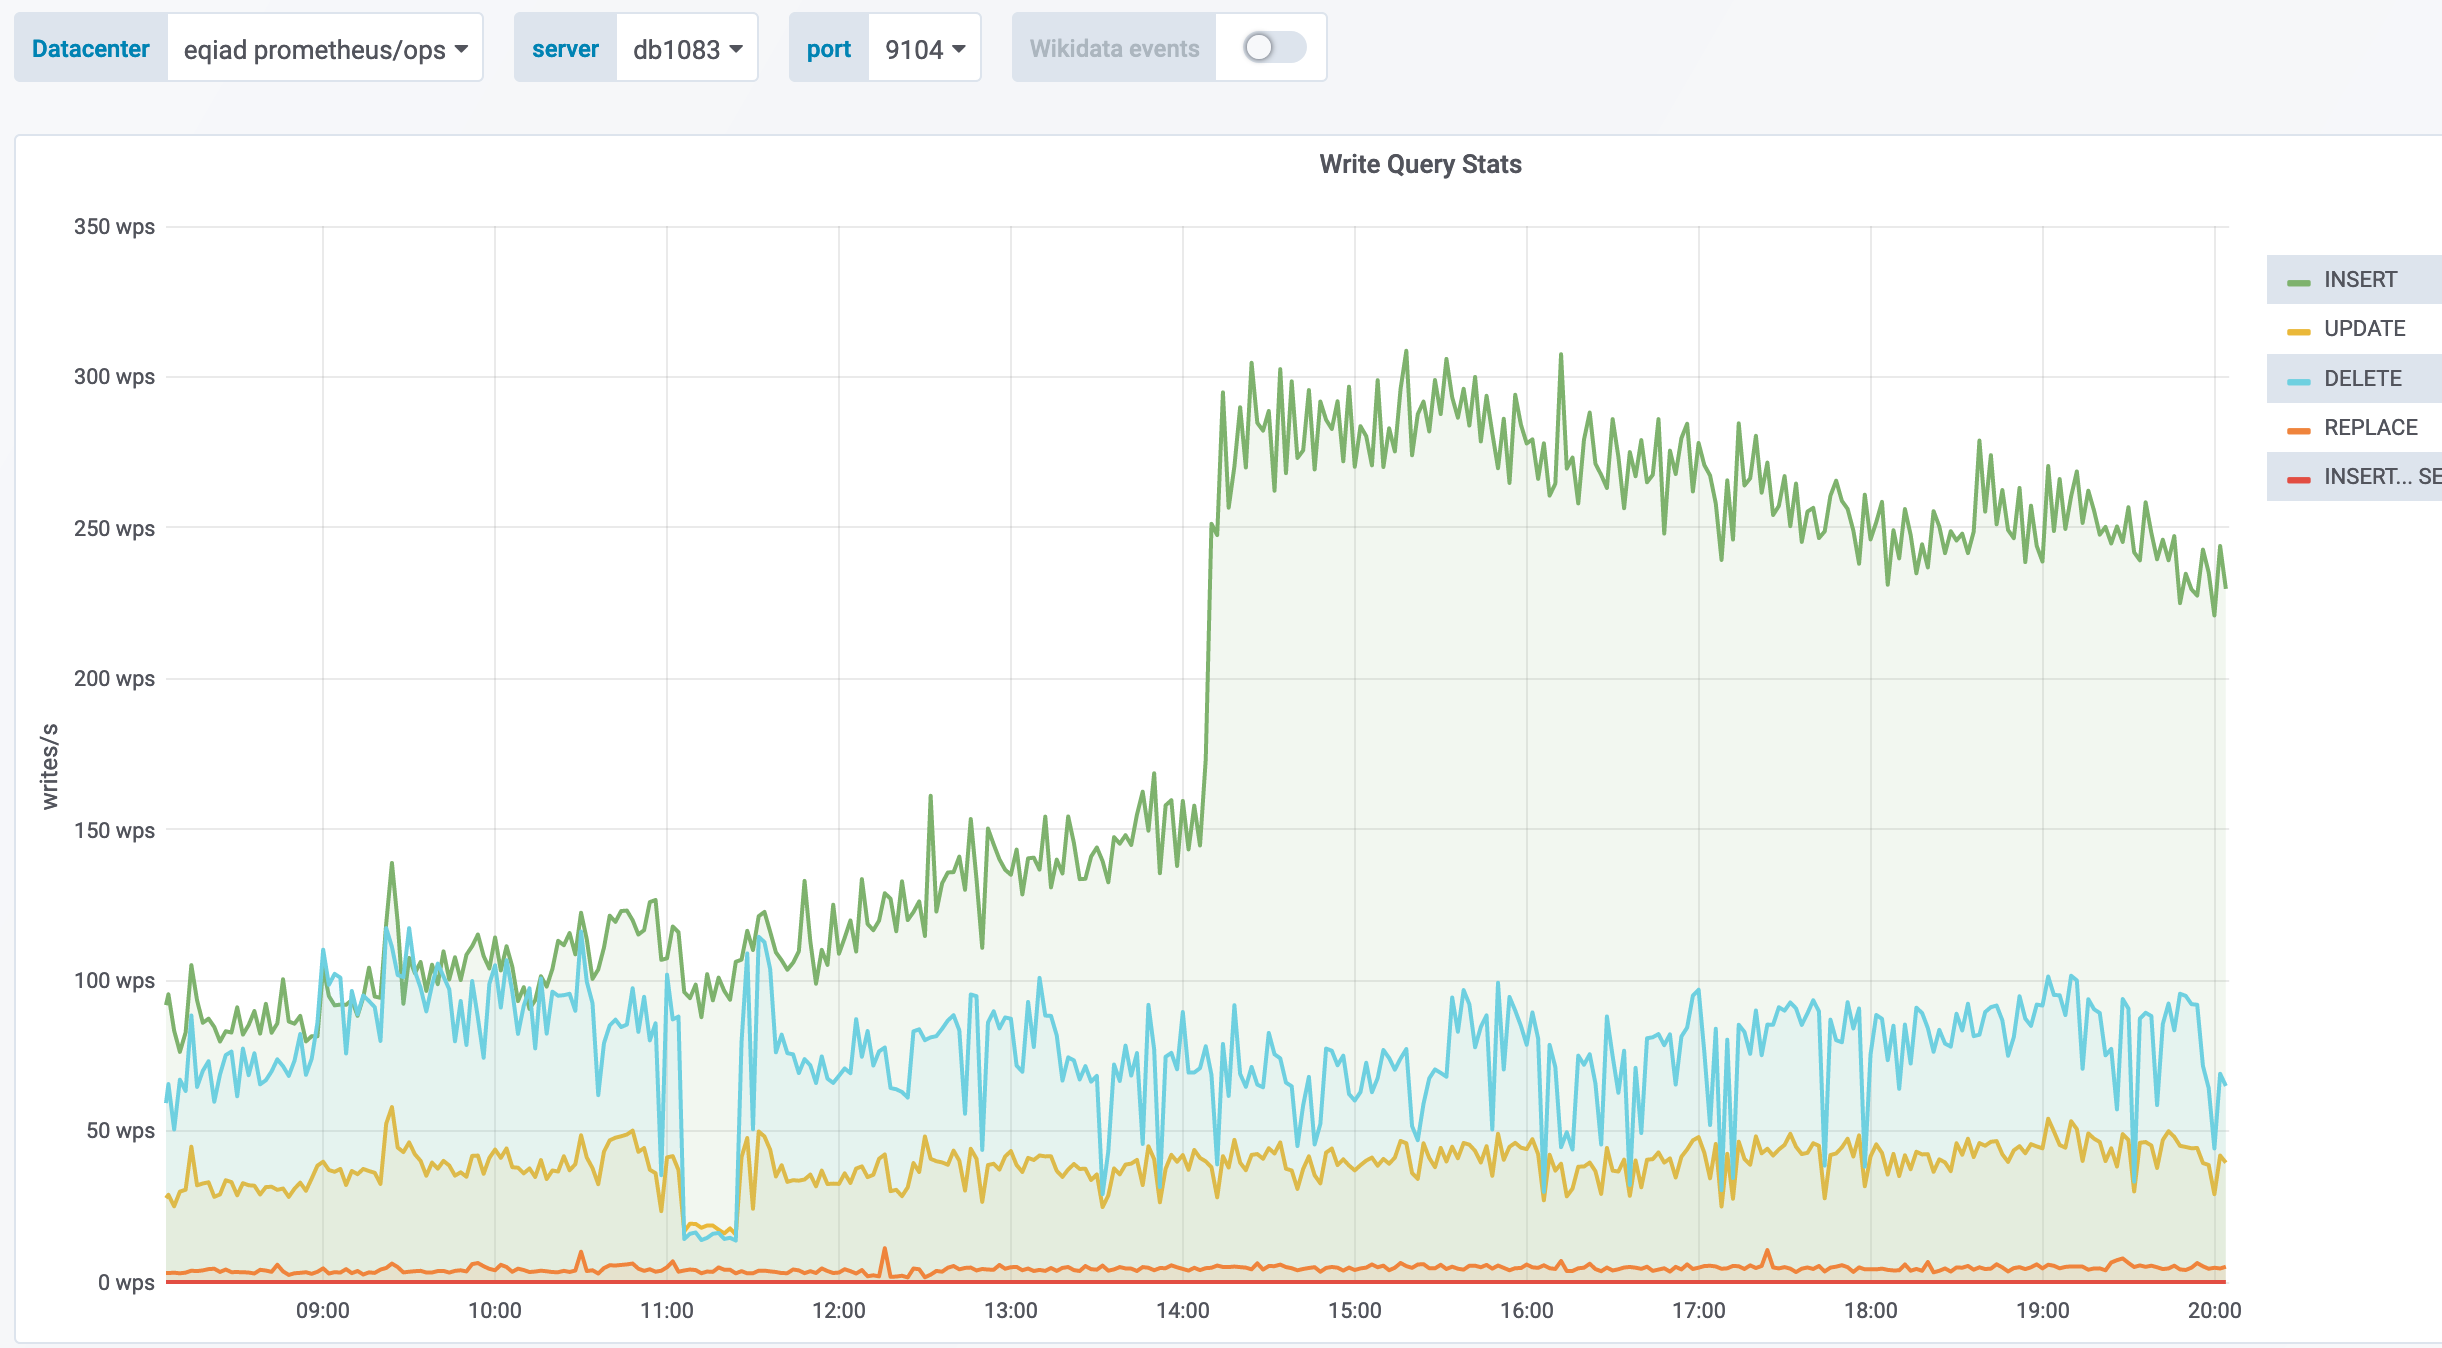
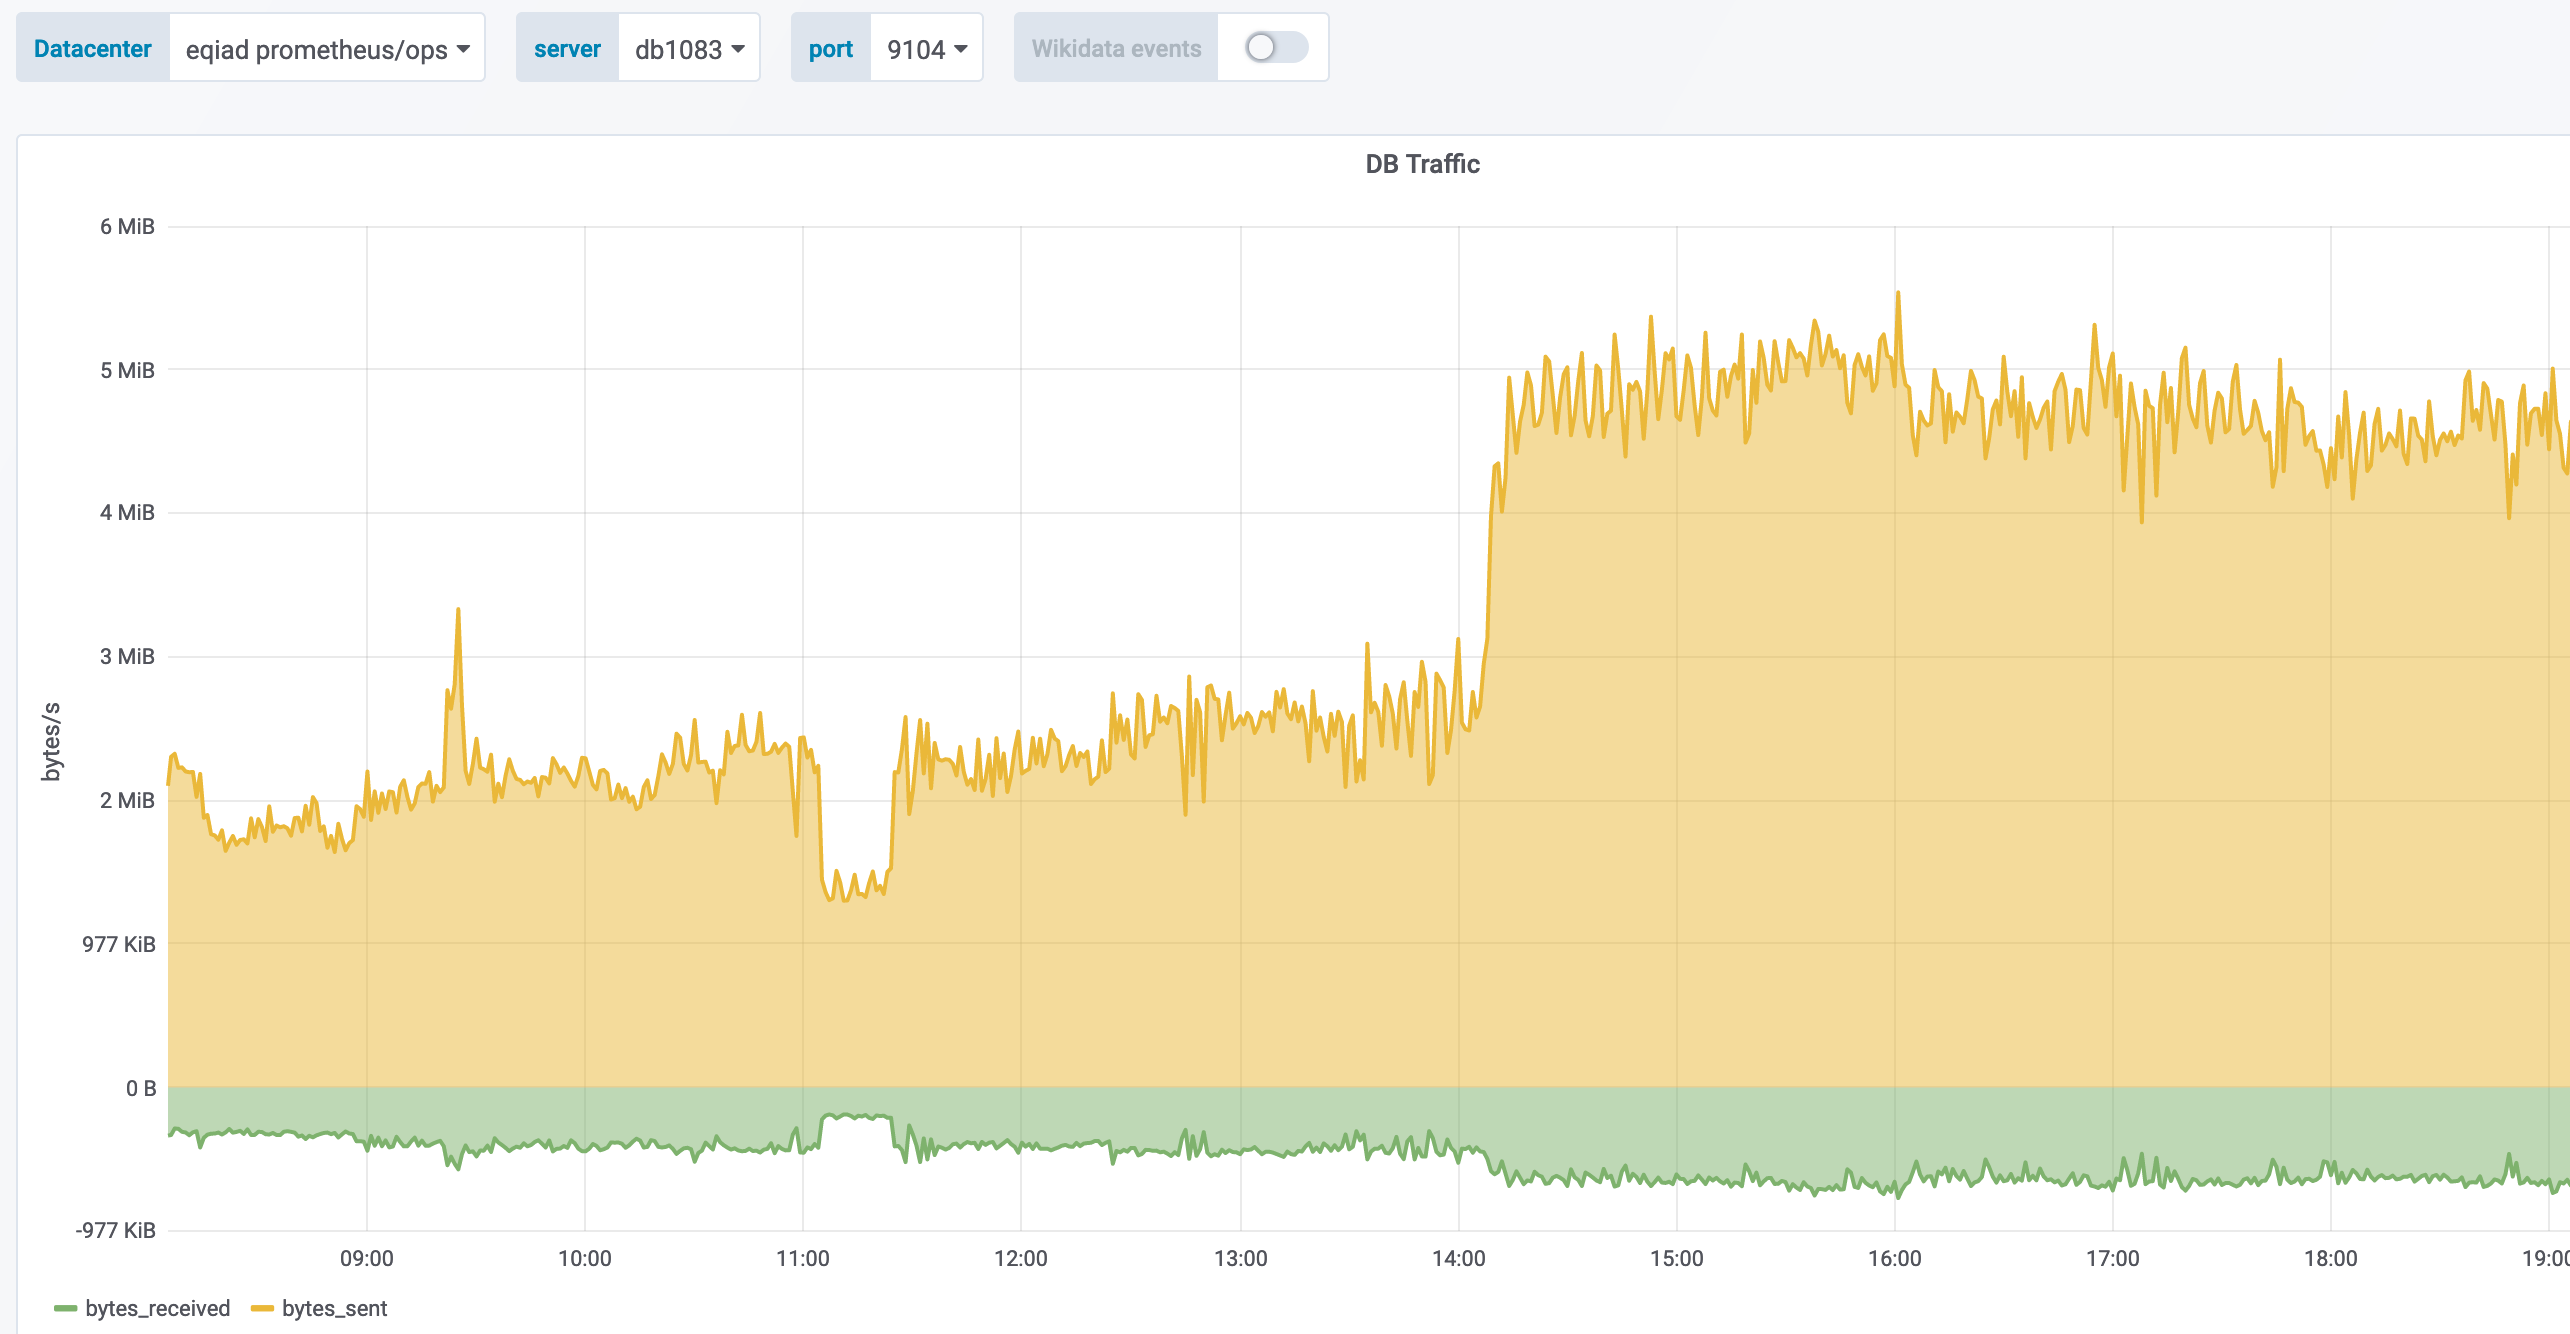
db1083 (s1 master, enwiki) 2020-03-05
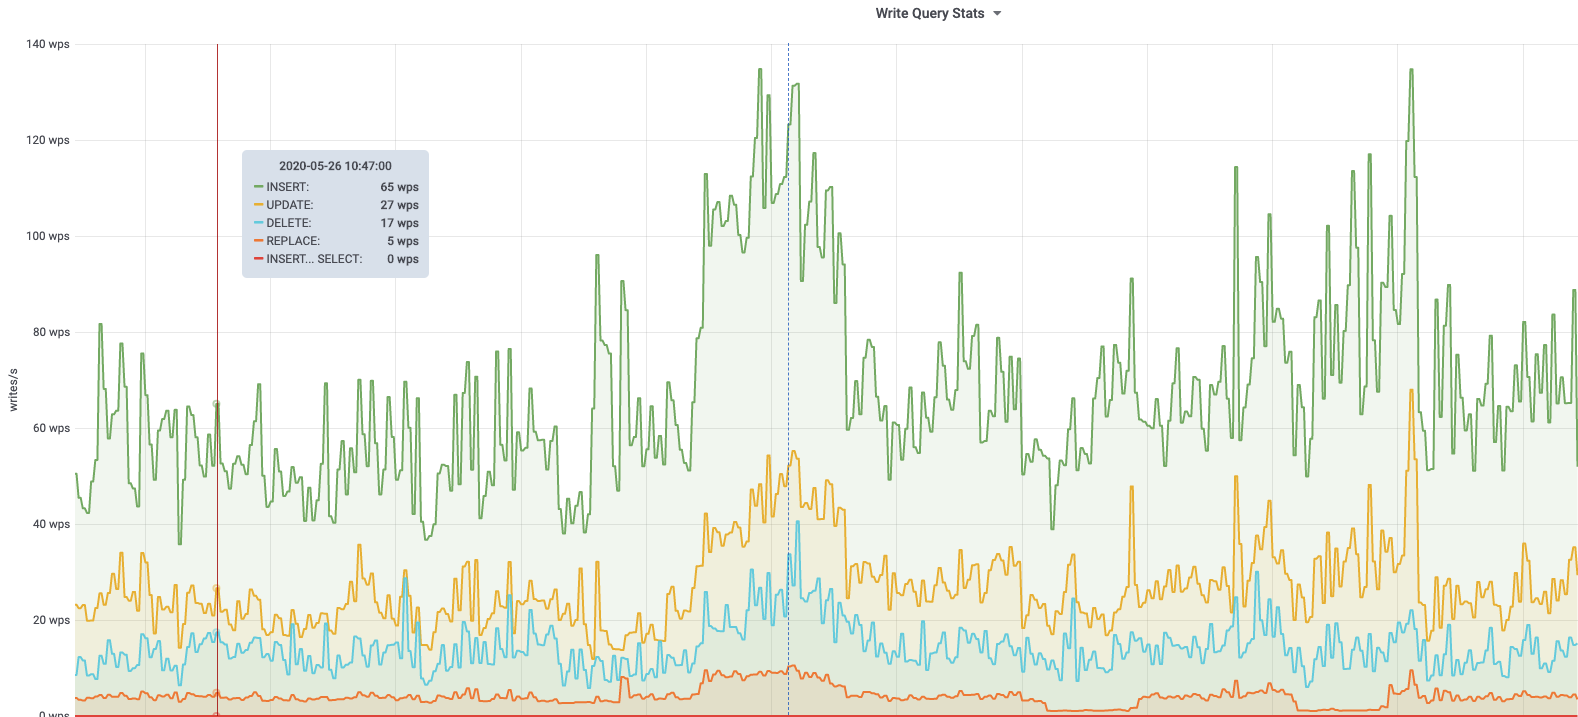
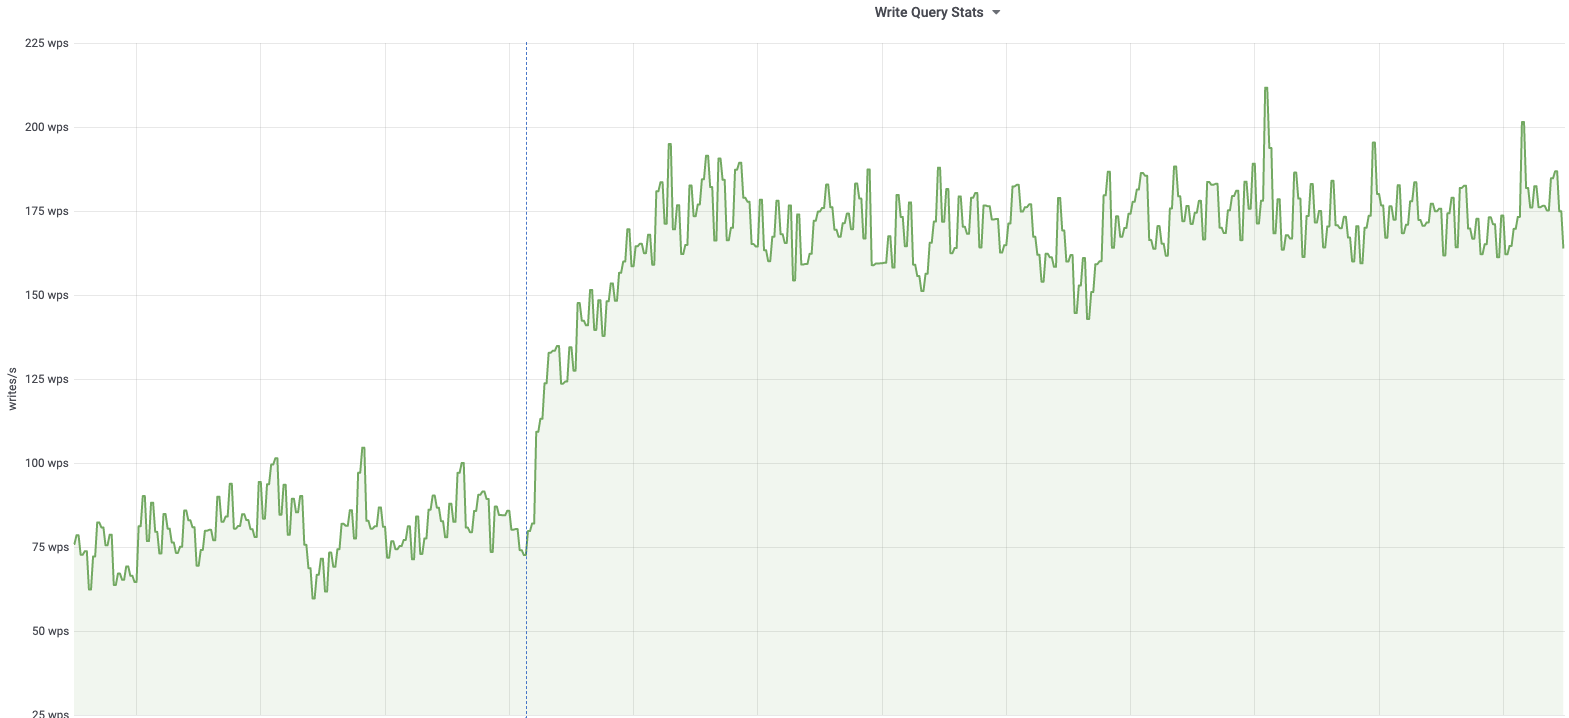
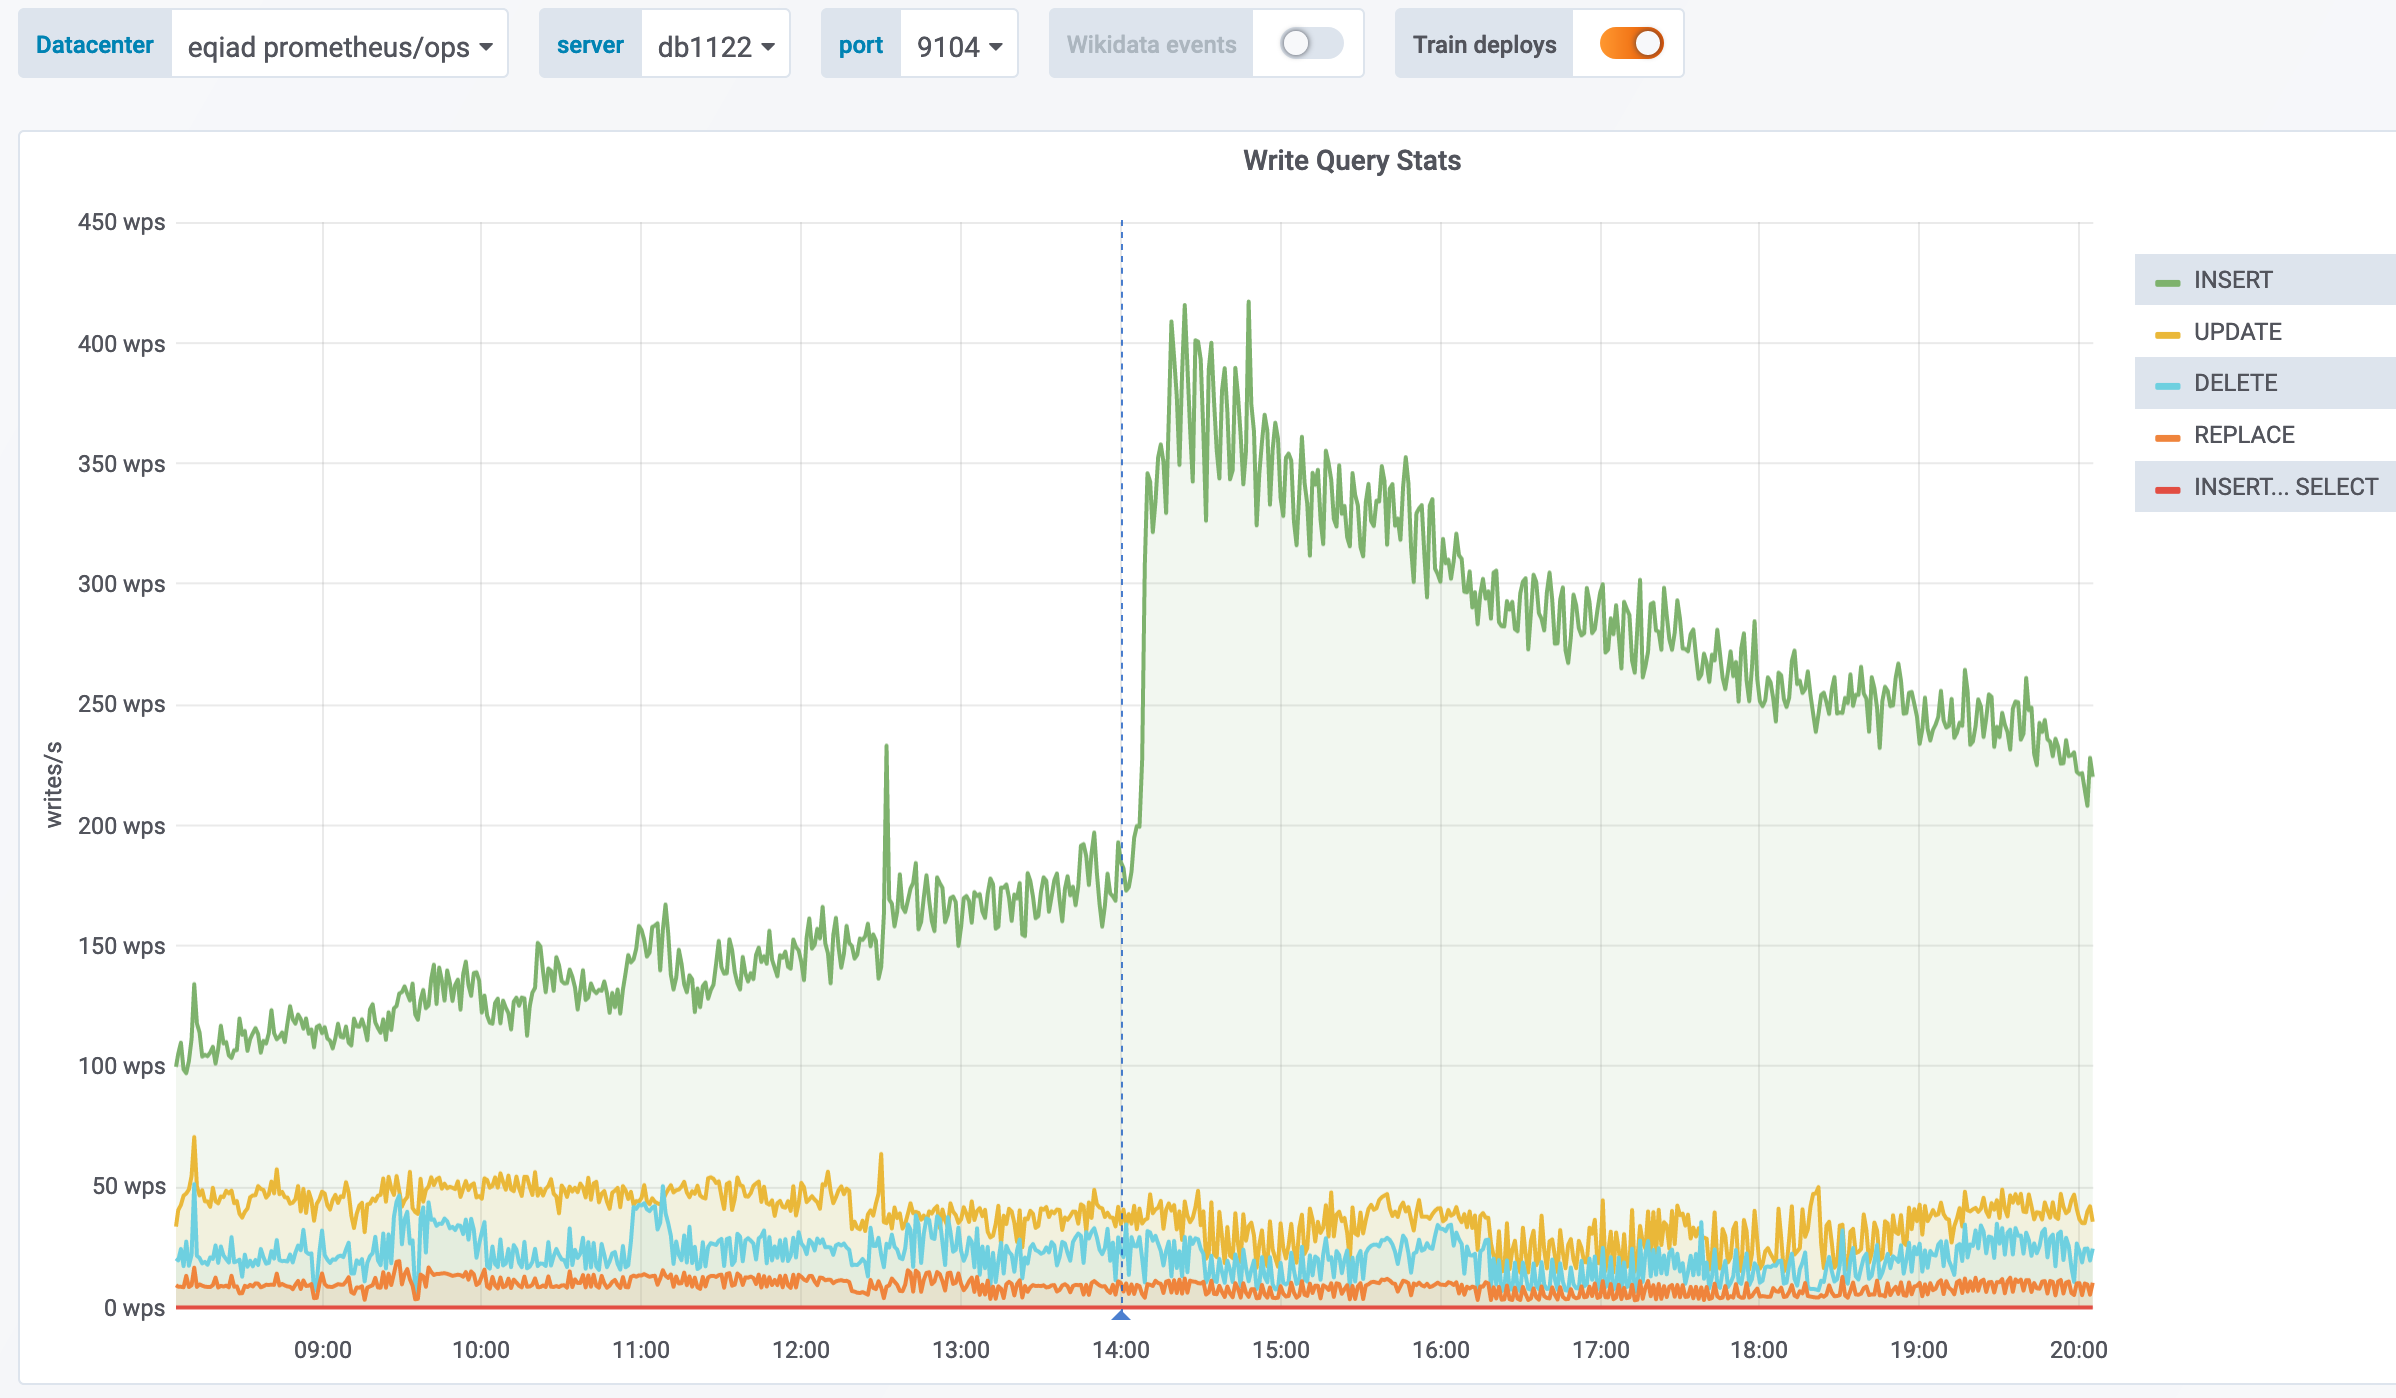
| db1122 (s2 master, e.g. zhwiki, nlwiki, ..) 2020-03-05 |
 |
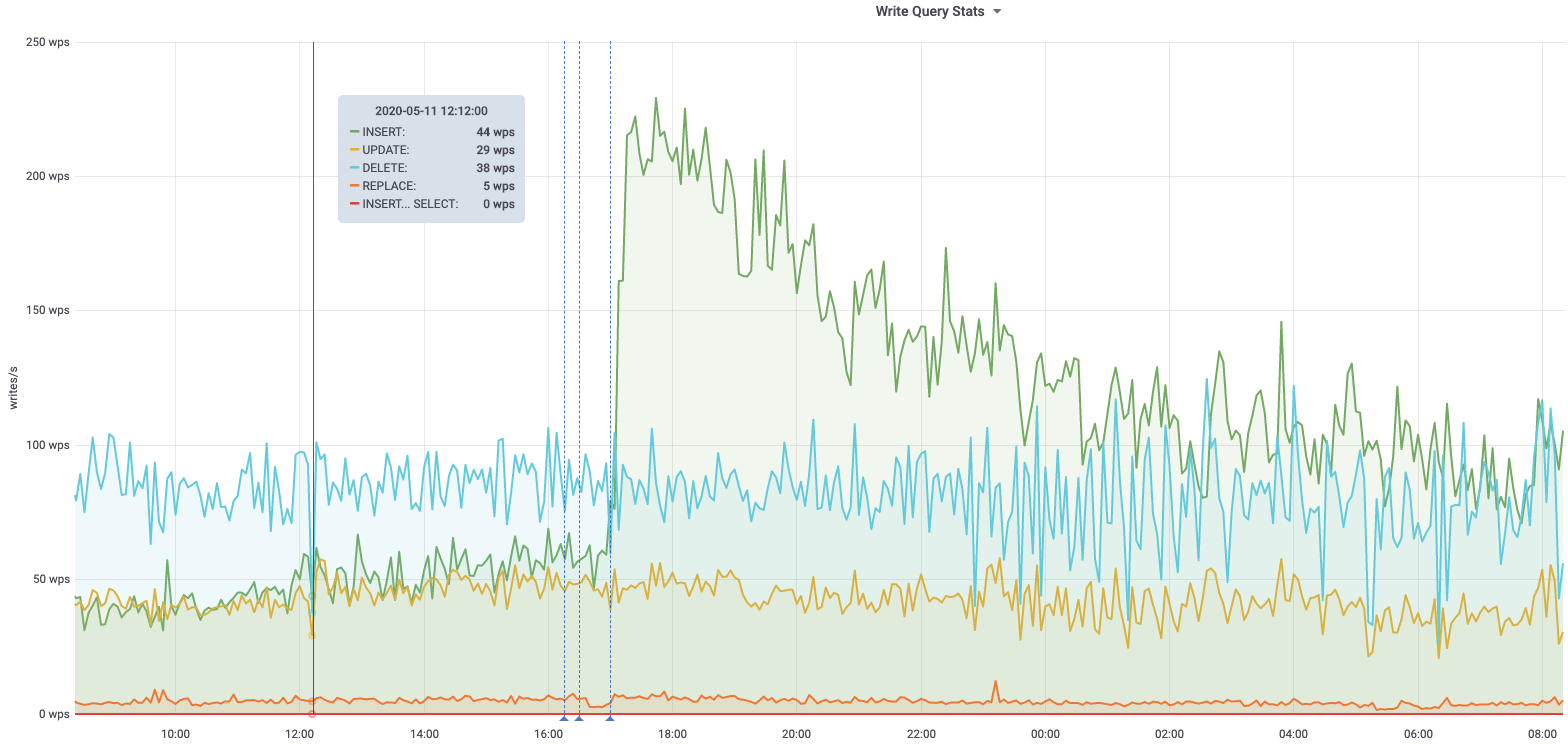
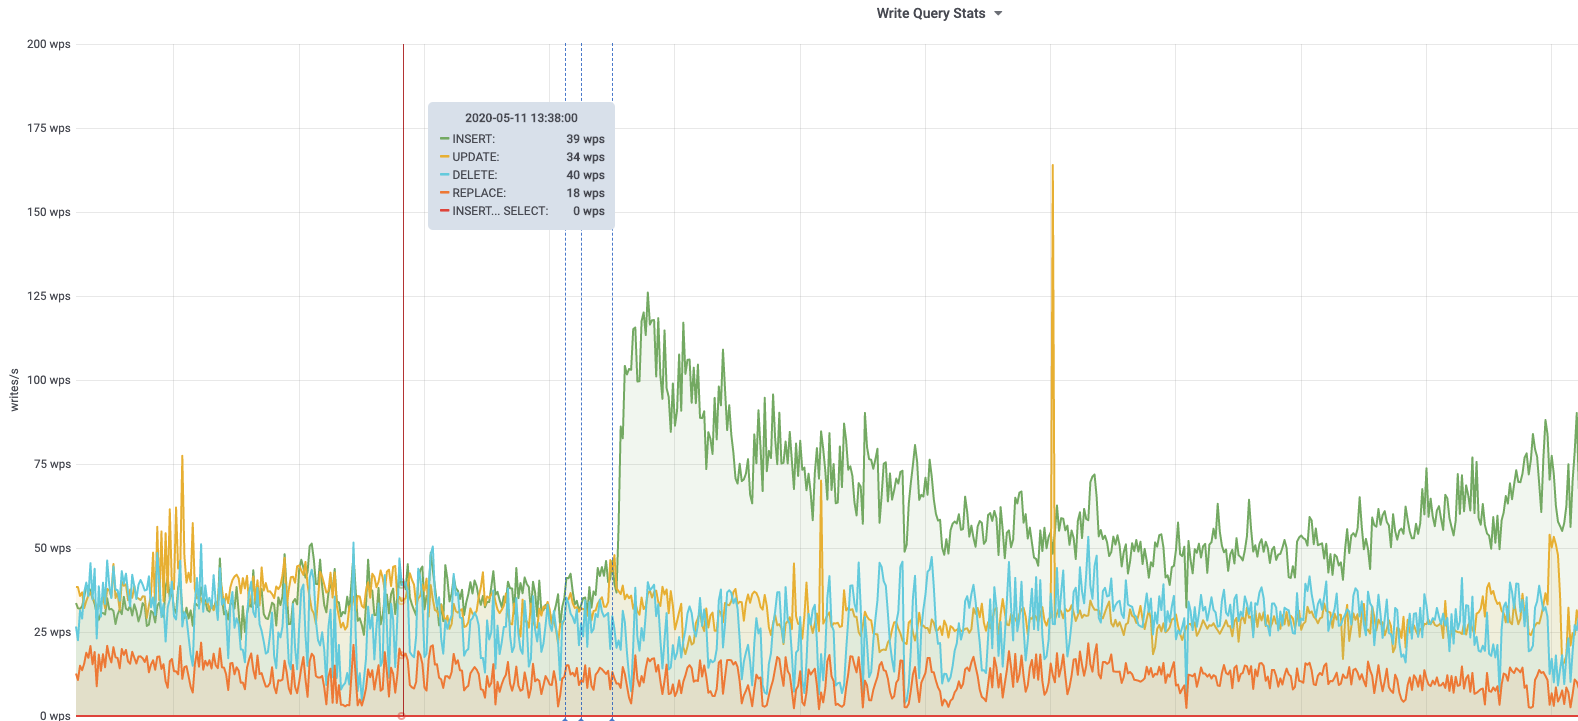
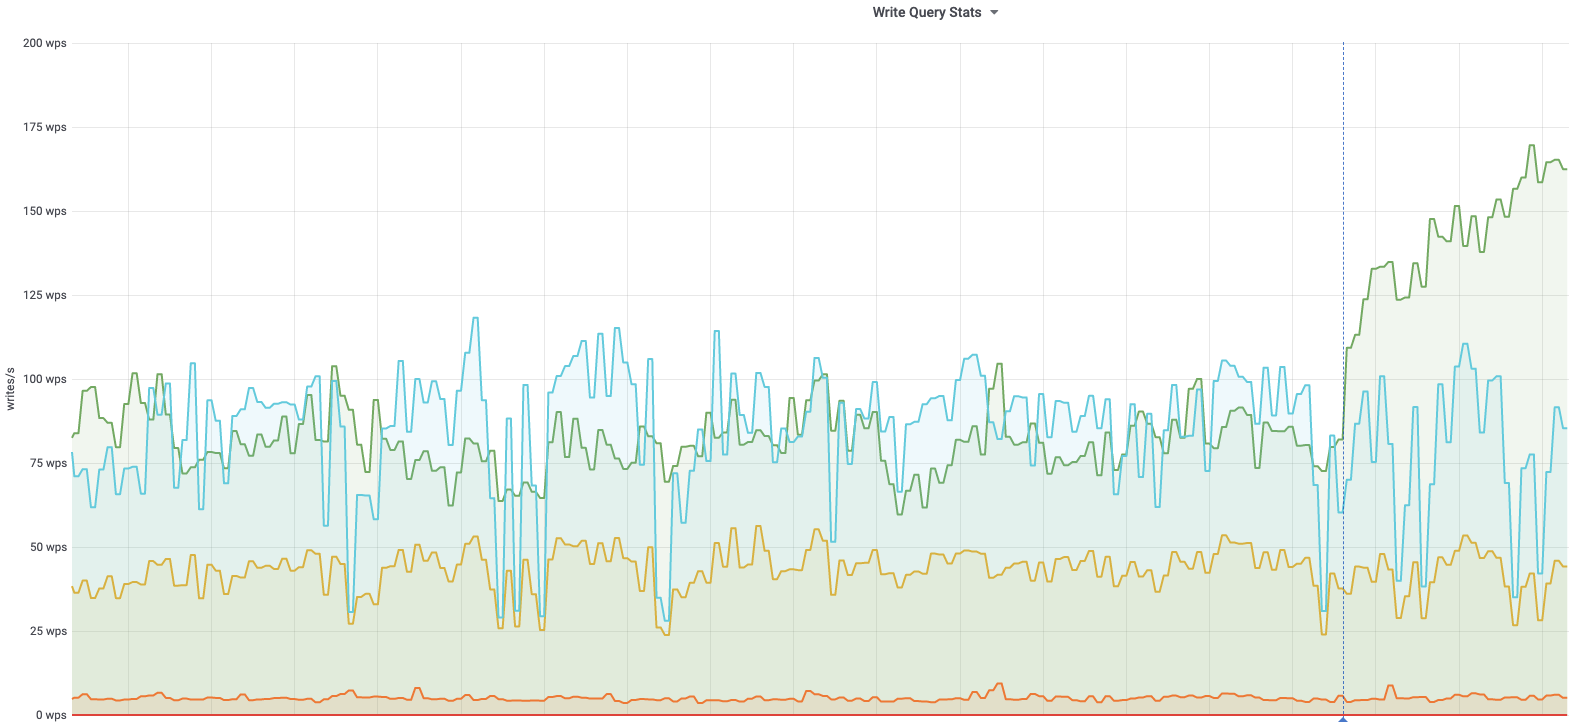
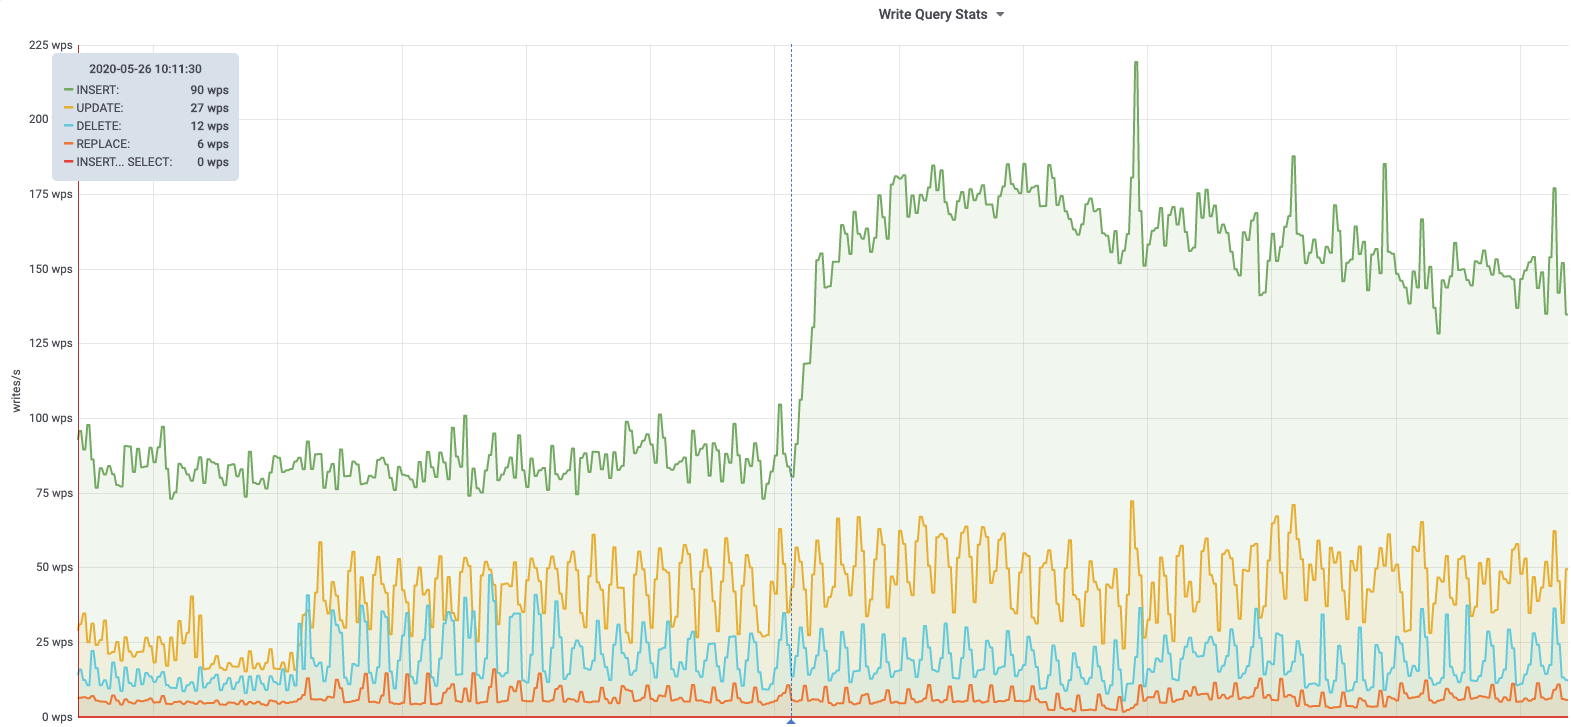
According to @jcrespo, these are largely inserts to module_deps table (about 150 per second as of 6 hours ago):
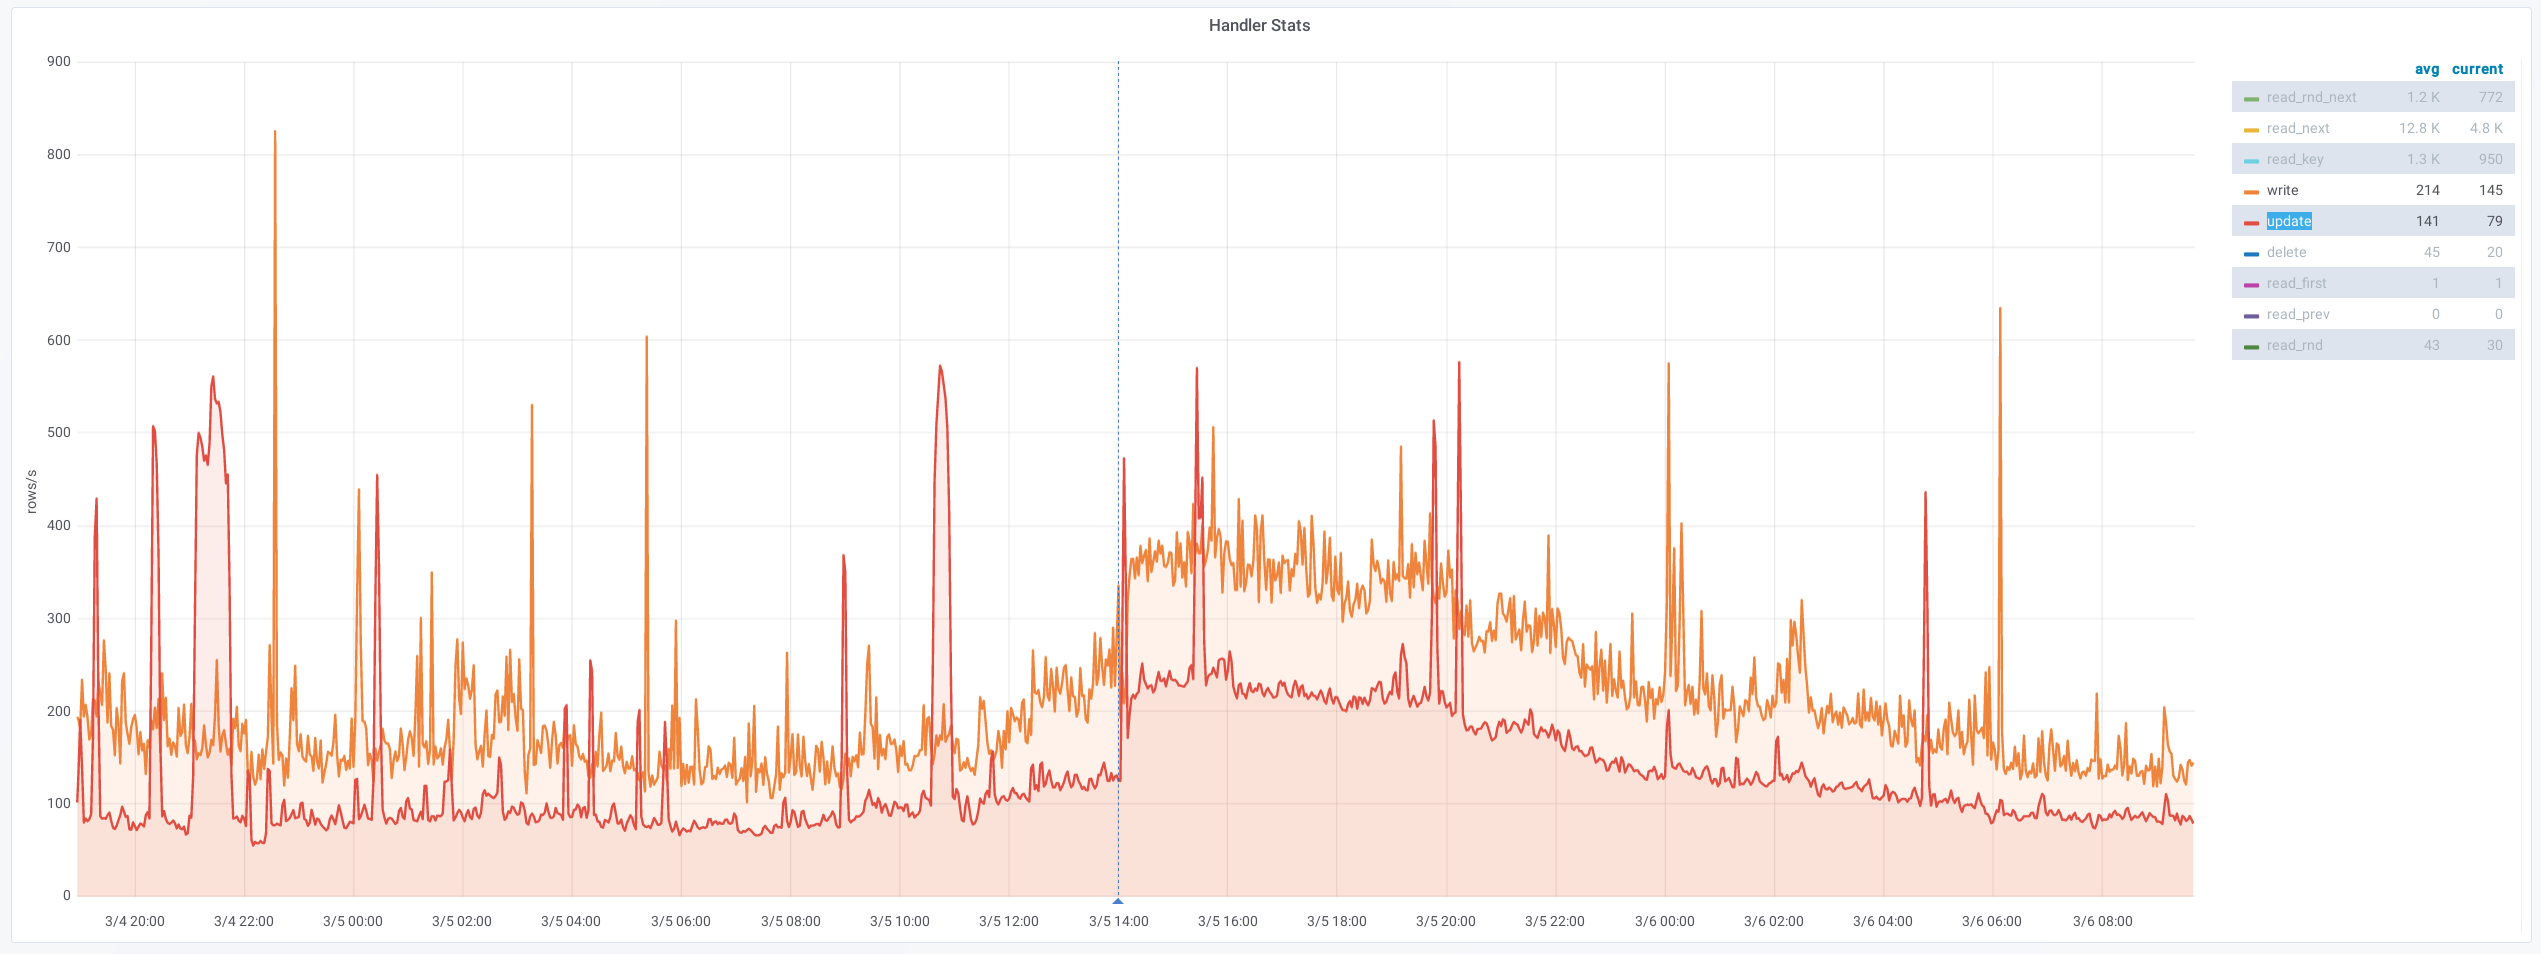
INSERT /* Wikimedia\DependencyStore\SqlModuleDependencyStore::storeMulti */ INTO `module_deps`
20:11 <jynus> not a huge fan of the ON DUPLICATE KEY UPDATE which I think it is what it is hiting instead of inserting