Page MenuHomePhabricator

automatically collect network error reports from users' browsers (Network Error Logging API)
Open, MediumPublic

Description

There are many classes of reliability issues (e.g. failures/misconfigurations in intermediate networks) that we only find out about via direct, manual reports from users, or (for very widespread cases) we notice because traffic is 'missing' and below expected rates.

Some sort of 'external' monitoring is the usual solution to such blind spots, but of course such solutions come with their own false positive errors and other limitations (requires agreements with commercial providers; sometimes limited APIs for scraping result data; often reliability problems that are specific to the monitoring provider's infrastructure rather than something 'real'; generally such a provider's probes run within datacenters instead of on Internet edges / from within residential ISP networks; geographic distribution of provider's probes don't match userbase geographic distribution; characteristics of synthetic traffic doesn't necessarily match characteristics of real traffic; &c. &c.).

There's another option, which is asking browsers to send you an error report some fraction of the time when they can't fetch from your site. This is a W3C draft technical report, the Network Error Logging API, part of the broader Reporting API. Currently the NEL API is implemented and enabled by default in only Chrome >=71 and Edge >=79, but that's still a large fraction of all traffic and users.

Asking browsers to enable NEL is implemented by serving HTTP response headers Report-To and NEL, which together define a set of endpoints that can receive reports, sampling fractions for each of failures and successes, and a TTL for this entire definition to be stored in the user's browser. See Sample Policy Definitions.

Privacy concerns

See Sample Network Error Reports
Error reports are full of PII. They're sent from user IP addresses, contain the URL that the user was attempting to fetch, any Referer: from that original request, and in the future could optionally include specific request or response headers from the original request. They require TLS over the wire and deserve all the same protections that our logs data gets at rest.

v0: Minimum viable deployment:
  • Legal review
  • T259160 Privacy review
  • Configure EventGate to receive NEL reports and store them in Logstash via Kafka.
    • We'll likely use the exact same EventGate instances set up to receive client-side Javascript error reports in T226986.
    • However, EventGate-Wikimedia will have to be modified, as NEL reports don't include EventGate-specific expected metadata fields. @Ottomata has prepared a simple patch that ought to allow us to set a reporting endpoint URI of something like https://intake-logging.wikimedia.org/v1/events?schema_uri=/network/error/logging/1.0.0&stream=network.error
    • Determine whether or not we want additional stream processing to split apart NEL responses into their component events, as each POST made to the reporting endpoint is potentially a batch of multiple error reports. EventGate does this already!
    • Modify EventGate to be compatible with the CORS headers required by Chrome: https://github.com/wikimedia/eventgate/pull/10 and https://gerrit.wikimedia.org/r/c/eventgate-wikimedia/+/623005
    • Write a schema that matches the NEL specification and verify it validates reports generated by Chrome stable.
    • Modify eventgate-logging-external's configuration to enable CORS mode T262087
    • Deploy an eventgate-wikimedia with all of these changes. T262087
    • Ensure some manually-constructed test events are making their way through Eventgate to Logstash: first document
  • Begin sending Report-To and NEL headers on our responses. https://gerrit.wikimedia.org/r/c/operations/puppet/+/627629
    • The traffic layer seems like the right place to insert these headers. We should do a staged rollout, starting with a small fraction of traffic and with short TTLs, and expand once confident.
    • Construct VCL that successfully emits JSON strings as response headers (surprisingly hard)
    • Launch on group0 wiki domains
    • Launch on group1 wiki domains
    • Launch on all domains
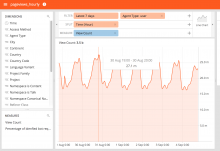
  • Build a reasonably-nice Logstash dashboard to aggregate NELs.
v1: Improvements that aren't too hard
  • T261340 Set up a "backwards GeoDNS" hostname that routes users to a faraway datacenter, or at least, a datacenter that won't be their usual primary datacenter. Use that hostname to receive error reports.
    • Browsers are supposed to buffer reports and retry later if they can't send them the first time, but this will help us receive reports as outages are happening, not after they're resolved.
    • There are possibly other alternatives to collecting reports via other-than-usual-datacenter endpoints: T261340#6437198
  • Consider if we want NEL reports stored anywhere other than Logstash -- e.g. it might be useful to also have them in their own table in Hive.
  • T263496 Augment the reported events with geoIP country data and AS number data (either as part of some sort of stream processing, or by adding a feature to eventgate-wikimedia)
Harder / more open-ended future work:
  • Attempt some sort of alerting based on receiving NELs. done, IRC alerting only
  • Set a nonzero success_fraction to also collect latency data for GeoDNS-mapping test URLs served at the edge; use that to improve our GeoDNS assignments.
  • Consider setting up some off-WMF-infrastructure report collectors, taking extra care to keep them maintainable, secure, and to not store PII at rest there. This would all require careful planning and review, but the upside is we could get near-realtime data about user issues, despite those users being unable to reach any WMF infrastructure.
Related Objects

Event Timeline

There are a very large number of changes, so older changes are hidden. Show Older Changes

e.g. it might be useful to also have them in their own table in Hive.

If we do all the EventGate stuff right, importing them into Hive will be natural (and soon more automated).

Attempt some sort of alerting based on receiving NELs.

The simplest version of this could be just throughput monitoring on the NEL topics in Kafka:
https://github.com/wikimedia/puppet/blob/e936a98f2aebe559eab6777d3b712af1079e3350/modules/monitoring/manifests/alerts/kafka_topic_throughput.pp

Determine whether or not we want additional stream processing to split apart NEL responses into their component events, as each POST made to the reporting endpoint is potentially a batch of multiple error reports.

Oo, interesting, how are they batched? If they are POSTed as an array of the same NEL object that all conform to the same schema, EventGate will treat them as individual events and post them as individual messages to Kafka.

Looking at the spec, I think that's how they're reported: https://w3c.github.io/reporting/#sample-reports

So that's great!

CDanis triaged this task as Medium priority.
CDanis renamed this task from automatically collect network error reports from users' browsers to automatically collect network error reports from users' browsers (Network Error Logging API).Jul 29 2020, 5:10 PM

Change 623005 had a related patch set uploaded (by CDanis; owner: Ottomata):
[eventgate-wikimedia@master] Update eventgate dependency for NEL

https://gerrit.wikimedia.org/r/623005

Change 623005 merged by CDanis:
[eventgate-wikimedia@master] Update eventgate dependency for NEL

https://gerrit.wikimedia.org/r/623005

Change 623067 had a related patch set uploaded (by CDanis; owner: CDanis):
[schemas/event/primary@master] Created reportingapi/report 1.0.0

https://gerrit.wikimedia.org/r/623067

Change 623067 merged by Ottomata:
[schemas/event/primary@master] Created w3c/reportingapi: report fragment & network-error

https://gerrit.wikimedia.org/r/623067

Rollout planning braindump

There's three degrees of freedom to play with here:

  1. The set of domains for which we request reports
  2. The sampling fraction we set for all of/each of those (when a user agent sees an error, how often does it create a report for that error?)
  3. The TTL we set for how long user agents will persist the above

I'm thinking the set of domains should roughly follow wiki deployment groups, as they're intended for phased rollouts that roughly follow wiki 'importance' / size of userbase affected, and also they make intuitive sense & are easy to explain).

I'm also thinking that TTLs should initially be short: let's say 1 hour to start with, and later on increasing up to something on the order of a week? The tradeoff to be made with TTLs is:

  • on a long TTL, if we also set the sampling fraction too high in a record that then persists for a long time, then eventgate and/or logstash could be overwhelmed in the event of a large outage.
  • on a too-short TTL, we won't get reports at all when infrequent users experience errors

We could probably do some analysis to figure out the per-user distribution of pageview inter-arrival times (or maybe that's already known? # of 1-day active users vs 7da vs 30da gives you enough of an idea), but I was thinking to keep it simple and just say "1 hour TTL to start, 1 week TTL when we're confident". The sampling fraction matters much more, anyway.

As for setting a sampling fraction, that's where things get really tricky.

  • Some domains are vastly more popular than other domains. There are also per-domain concerns, like vastly different geographical and geopolitical distributions of users, etc. In the long run, we very likely want different sampling fractions for different domains.
  • A sampling fraction that gives you visibility into interesting, small-scale events (one small ISP suffering from one of our sites being unreachble, for some reason) is very likely to produce an overwhelming flood of reports in the event of a large-scale outage (of Wikimedia's infra, or of a major transit network, etc).

I'm still not sure how best to resolve all the tensions here, and certainly not how to do so in a principled way. Thoughts are appreciated!

For now I think it could be okay to empirically set a sampling rate that seems reasonable, starting off low and then ramping up (but not too high).

Super cool work!

We could probably do some analysis to figure out the per-user distribution of pageview inter-arrival times (or maybe that's already known? # of 1-day active users vs 7da vs 30da gives you enough of an idea),

Let us know if there is any data we can get you.

Thoughts that come to mind:

For sampling ratios I think we want to look at user requests, not pageviews or devices.

Some napkin math follows:

The peak of pageviews last week was 27 million per hour. Say pageviews are made of about 20 requests in average, the peak of requests per second would be 150,000 for all domains for user traffic alone (this is an over estimate)

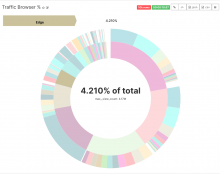
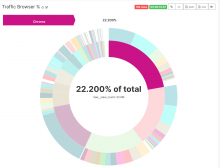
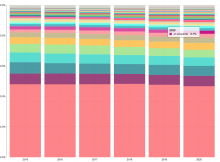
For last quarter Chrome (all versions) was about 22.2% and Edge (all versions) was 4.2%, of *all pageview traffic*. That makes 26.4% . Extrapolating to all traffic, that would leave us about 40,000 requests per second potentially affected by this protocol (all domains). That seems a lot of traffic that might be potentially affected. We can enable just a small wikipedia, like pt.wikipedia that represents 2% of traffic (800 requests per second of Chrome plus Edge requests ) at 1%, which will give us 8 request per second (again, an overestimate). That seems easy to try and not likely to cause problems with a TTL of 1 hour. Probably a 10% sampling is also easily sustainable.

Links:

https://bit.ly/3jLkRV6
https://superset.wikimedia.org/r/314
https://superset.wikimedia.org/r/313

Screenshots:

Screen Shot 2020-09-04 at 1.58.46 PM.png (1×1 px, 108 KB)

Screen Shot 2020-09-04 at 1.27.22 PM.png (1×1 px, 270 KB)

Screen Shot 2020-09-04 at 1.24.13 PM.png (1×1 px, 252 KB)

Screen Shot 2020-09-04 at 1.23.59 PM.png (1×1 px, 256 KB)

on a long TTL, if we also set the sampling fraction too high in a record that then persists for a long time, then eventgate and/or logstash could be overwhelmed in the event of a large outage.

This (I think) is also eventgate's responsability to prevent and we should have some throttling policies that we can apply per topic (cc @Ottomata)

Change 627364 had a related patch set uploaded (by CDanis; owner: CDanis):
[operations/puppet@production] logstash collectors: accept Network Error Logging reports

https://gerrit.wikimedia.org/r/627364

Mentioned in SAL (#wikimedia-operations) [2020-09-14T21:24:01Z] <cdanis> T257527 ✔️ cdanis@cumin1001.eqiad.wmnet ~ 🕠🍺 sudo cumin 'R:Class ~ "(?i)profile::logstash::collector7"' 'disable-puppet "cdanis rolling out Ifa3c68e4"'

Change 627364 merged by CDanis:
[operations/puppet@production] logstash collectors: accept Network Error Logging reports

https://gerrit.wikimedia.org/r/627364

Mentioned in SAL (#wikimedia-operations) [2020-09-14T21:30:36Z] <cdanis> T257527 ✔️ cdanis@cumin1001.eqiad.wmnet ~ 🕠🍺 sudo cumin 'R:Class ~ "(?i)profile::logstash::collector7"' 'enable-puppet "cdanis rolling out Ifa3c68e4"'

Change 627582 had a related patch set uploaded (by CDanis; owner: CDanis):
[operations/puppet@production] original logstash: accept Network Error Logging reports

https://gerrit.wikimedia.org/r/627582

Rollout planning braindump

There's three degrees of freedom to play with here:

  1. The set of domains for which we request reports
  2. The sampling fraction we set for all of/each of those (when a user agent sees an error, how often does it create a report for that error?)
  3. The TTL we set for how long user agents will persist the above

I'm thinking the set of domains should roughly follow wiki deployment groups, as they're intended for phased rollouts that roughly follow wiki 'importance' / size of userbase affected, and also they make intuitive sense & are easy to explain).

I'm also thinking that TTLs should initially be short: let's say 1 hour to start with, and later on increasing up to something on the order of a week? The tradeoff to be made with TTLs is:

  • on a long TTL, if we also set the sampling fraction too high in a record that then persists for a long time, then eventgate and/or logstash could be overwhelmed in the event of a large outage.
  • on a too-short TTL, we won't get reports at all when infrequent users experience errors

We could probably do some analysis to figure out the per-user distribution of pageview inter-arrival times (or maybe that's already known? # of 1-day active users vs 7da vs 30da gives you enough of an idea), but I was thinking to keep it simple and just say "1 hour TTL to start, 1 week TTL when we're confident". The sampling fraction matters much more, anyway.

As for setting a sampling fraction, that's where things get really tricky.

  • Some domains are vastly more popular than other domains. There are also per-domain concerns, like vastly different geographical and geopolitical distributions of users, etc. In the long run, we very likely want different sampling fractions for different domains.

Thanks very much for starting this task and all your work on it so far!

Some thoughts:

  1. For the TTL (defined by max_age member), there seem to be two TTLs we have to think about: the TTL for report_tothat specifies the endpoint group where the NEL reports will be sent to, and the other for the NEL policy itself. The TTL for the endpoint can be greater than or equal to the TTL of the NEL policy. (As per the standard: "If the Reporting policy expires, NEL reports will not be delivered, even if the NEL policy has not expired.")
  1. The sampling fraction also has two members: success_fraction that takes into account the successful network requests, and failure_fraction that is concerned with failed network requests. I am trying to think if there is a use case where we may be concerned about the requests that completed successfully. Do you have such a case in mind? It's possible that I am looking at this from a censorship measurement perspective and therefore I am more concerned about the requests that didn't complete successfully -- which makes me think that we can have a larger sampling fraction for failure_fraction but a smaller one for success_fraction, if we need it at all.
  1. Nuria has commented about rate-limiting on EventGate's end but even ignoring that for a second, given that the resource for which we are enabling NEL also shares the same infrastructure as the NEL endpoint (if this is assumption is true), assuming wikimedia.org goes down, shouldn't nel-endpoint.wikimedia.org also be affected? In which case the concern is the large number of reports that are queued, can we also set retry_after for the endpoint to dictate the time after which the report should be (tried) submitted again? That way we can set a long TTL and a large retry_after to help manage the ingestion of reports.

Change 627582 merged by CDanis:
[operations/puppet@production] original logstash: accept Network Error Logging reports

https://gerrit.wikimedia.org/r/627582

Change 627589 had a related patch set uploaded (by CDanis; owner: CDanis):
[operations/puppet@production] logstash: NEL: rename overloaded body field to report_body

https://gerrit.wikimedia.org/r/627589

  1. For the TTL (defined by max_age member), there seem to be two TTLs we have to think about: the TTL for report_tothat specifies the endpoint group where the NEL reports will be sent to, and the other for the NEL policy itself. The TTL for the endpoint can be greater than or equal to the TTL of the NEL policy. (As per the standard: "If the Reporting policy expires, NEL reports will not be delivered, even if the NEL policy has not expired.")

Yep! I was planning on making the two TTLs equivalent -- I think this will be fine, and it's what the current users do (P12583)

  1. The sampling fraction also has two members: success_fraction that takes into account the successful network requests, and failure_fraction that is concerned with failed network requests. I am trying to think if there is a use case where we may be concerned about the requests that completed successfully. Do you have such a case in mind? It's possible that I am looking at this from a censorship measurement perspective and therefore I am more concerned about the requests that didn't complete successfully -- which makes me think that we can have a larger sampling fraction for failure_fraction but a smaller one for success_fraction, if we need it at all.

I have only vague thoughts for how we might use success_fraction. Here's one thing I've imagined:

  • Set a high (1.0) success_fraction for some special domains which each map to a single edge datacenter.
  • Some small fraction of the time, via some Javascript, have a sample of users fetch an identical small asset from each of our N edge datacenters (pointing at each of those N domains).
  • Use those success reports to aggregate per-ASN / per-IP-block latency numbers for each of our edge DCs, and use that to improve our GeoDNS mapping.

There's a lot of handwaving and open questions embedded in the above, though 😅

For now, we'll set success_fraction: 0.

  1. Nuria has commented about rate-limiting on EventGate's end but even ignoring that for a second, given that the resource for which we are enabling NEL also shares the same infrastructure as the NEL endpoint (if this is assumption is true), assuming wikimedia.org goes down, shouldn't nel-endpoint.wikimedia.org also be affected? In which case the concern is the large number of reports that are queued, can we also set retry_after for the endpoint to dictate the time after which the report should be (tried) submitted again? That way we can set a long TTL and a large retry_after to help manage the ingestion of reports.

Ah, I think you got confused by the spec, which doesn't clearly differentiate between origin-provided configuration and user-agent-internal state. retry_after isn't something we publish; it's a value computed and maintained by the user-agent itself. (Same for failures.)

To address the stated assumption: I think it's incredibly unlikely that we could get so many NELs that we overwhelm the Traffic infrastructure itself*. I think we could potentially overload Logstash, but likely only temporarily, and finally I think we could easily overwhelm the eventgate-logging-external EventGate deployment running on Kubernetes, which at present is just a handful of replicas. But we can easily scale up that last piece, if needed.

(*: The rate at which NELs can be emitted by user-agents is naturally limited by the rate at which users can request pages; one NEL upload can contain many reports in its payload; NELs are 'cheaper' to serve than actual page fetches on most axes at most layers of the stack.)

Change 627589 merged by CDanis:
[operations/puppet@production] logstash: NEL: rename overloaded body field to report_body

https://gerrit.wikimedia.org/r/627589

Change 627591 had a related patch set uploaded (by CDanis; owner: CDanis):
[operations/puppet@production] collector7: fix omitted 'tags' stanza

https://gerrit.wikimedia.org/r/627591

Change 627591 merged by CDanis:
[operations/puppet@production] collector7: fix omitted 'type' stanza

https://gerrit.wikimedia.org/r/627591

Change 627599 had a related patch set uploaded (by CDanis; owner: CDanis):
[operations/puppet@production] logstash NEL: use 'tags' not 'type'

https://gerrit.wikimedia.org/r/627599

Change 627599 merged by CDanis:
[operations/puppet@production] logstash NEL: use 'tags' not 'type'

https://gerrit.wikimedia.org/r/627599

Change 627629 had a related patch set uploaded (by CDanis; owner: CDanis):
[operations/puppet@production] Serve Network Error Logging headers on group0

https://gerrit.wikimedia.org/r/627629

Change 627629 merged by CDanis:
[operations/puppet@production] Serve Network Error Logging headers on group0

https://gerrit.wikimedia.org/r/627629

As of about 13:30 UTC today, we started serving these response headers on group0 wiki domains.

There's a surprising amount of two classes of traffic:

  • status_code=404 traffic for URLs that are hotlinked everywhere despite not existing (the most prominent of which is https://www.mediawiki.org/w/skins/common/images/cc-0.png )
  • failure type abandoned which is when the user hits their browser's 'Stop' button, or hits 'Back' or otherwise gives up on the pageload

There is a lot of the second kind of traffic. It's not tremendously diagnostic of anything for us -- well, unless we're seeing many such reports which also have a long elapsed_time, which might indicate latency/timeout issues somewhere in the stack. And there's so much abandoned that it will limit the sampling_fraction we can set on the larger wikis.

There's also a fair bit of phase=application, status_code=200, error type=unknown reports. I'm not sure what these mean.

So, comparing the same 24h window (19:00 UTC Tuesday -- 19:00 UTC Wednesday) between Logstash and webrequest_sampled_128 for group0 domains:

(*: There's lots of hidden complexity here, because some of the error reports we receive are for requests that either the user and/or the browser later issued retries for, possibly after we also logged the original, failed request(s)! At the same time, there are error reports we received that correspond to requests we never received in the first place. We'll staunchly ignore this: it's very hard to model, and since our only goal in modeling is to pick a reasonable sampling fraction, we only need something approximate, we can tune it later, and finally, we can cross our fingers and assume/hope that the relative ratios of all these flavors of error will remain the same. 🤞)

So, all that said, we receive reports at about 0.32% the rate we receive requests.

Looking at the webrequest table for the past week, we receive about 128*81.4M requests/day (~121K/second). 52% of this traffic is Chrome or Edge (@Nuria I think your 22.2% figure didn't include mobile Chrome...? but as turns out mobile does send NELs). So, if we were to sample 100% of errors on all traffic, and the above holds, it would be somewhere in the neighborhood of 200 reports/second steady-state.

We don't want to hit Logstash too hard with new events. It receives approx 92M events/day (~1065/second). We should limit # of reports to be at most a few percent of that. We also want to leave headroom for when we or ISPs have outages.

For future rollouts I am going to begin with 5% sampling. An average of 10 events/second seems pretty workable for Logstash, we'll still get a fair bit of data, and this gives us plenty of headroom in the event of a lot of temporally-correlated failures.

I'll do group1 tomorrow, and will continue on to all domains (group2 plus non-wiki domains) after the weekend.

Change 629717 had a related patch set uploaded (by CDanis; owner: CDanis):
[operations/puppet@production] Extend NEL to group1 wikis; lower sampling rate to 5%

https://gerrit.wikimedia.org/r/629717

Change 629717 merged by CDanis:
[operations/puppet@production] Extend NEL to group1 wikis; lower sampling rate to 5%

https://gerrit.wikimedia.org/r/629717

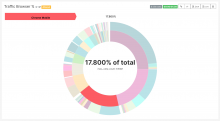
Correct, I did not included chrome mobile which is about 17.8% of pageviews for last month, that would mean that (pageview wise). The total amount of pageviews by browsers that would send us reports is 44.2%. It makes sense that this would be an underestimate cause usage of wikipedia content that is not a pageview also matters for this purpose.

Screen Shot 2020-09-24 at 2.42.53 PM.png (1×1 px, 223 KB)

Change 630597 had a related patch set uploaded (by CDanis; owner: CDanis):
[operations/deployment-charts@master] eventgate-logging-external-tls-proxy: bump CPU up

https://gerrit.wikimedia.org/r/630597

Change 630597 merged by CDanis:
[operations/deployment-charts@master] eventgate-logging-external-tls-proxy: bump CPU up

https://gerrit.wikimedia.org/r/630597

With the current 5% sampling, we're getting about 30 reports/second at peak times.

Extending NEL to all domains is going to increase our traffic by about 2.5x (assuming the same ratio of requests recorded / errors reported).

That would bring us up to something like 75 reports/sec at peak, which feels like it should be fairly manageable for Logstash (adding something like 7% to its overall load).

I think this is acceptable, but I'll be keeping an eye on things. At 5% sampling we're already seeing more error reports than I anticipated, given the previous ratio of requests/reports, so it's possible 5% is too much and we need to tune downwards.

Change 630860 had a related patch set uploaded (by CDanis; owner: CDanis):
[operations/puppet@production] launch Network Error Logging on all WMF domains

https://gerrit.wikimedia.org/r/630860

Change 630860 merged by CDanis:
[operations/puppet@production] launch Network Error Logging on all WMF domains

https://gerrit.wikimedia.org/r/630860

This is now live on all WMF domains.

In the event that it needs to be backed out, don't revert the patch.

Instead, continue serving the response headers, but modify the NEL: header failure_fraction to be 0.0.

This is because NEL-enabled browsers cache the response header for the TTL we specify (24h), and a missing response header won't affect the state of that cache in any way.

Change 630931 had a related patch set uploaded (by CDanis; owner: CDanis):
[operations/puppet@production] logstash: add throttle-exempt; don't throttle NEL or client errors

https://gerrit.wikimedia.org/r/630931

Change 630931 merged by Cwhite:
[operations/puppet@production] logstash: add throttle-exempt; don't throttle NEL or client errors

https://gerrit.wikimedia.org/r/630931

Change 679417 had a related patch set uploaded (by CDanis; author: CDanis):

[operations/puppet@production] Add es_exporter config for NEL events

https://gerrit.wikimedia.org/r/679417

Change 679417 merged by CDanis:

[operations/puppet@production] Add es_exporter config for NEL events

https://gerrit.wikimedia.org/r/679417

Change 685516 had a related patch set uploaded (by CDanis; author: CDanis):

[operations/puppet@production] Add IRC alerting for two relevant NEL subtypes

https://gerrit.wikimedia.org/r/685516

Change 685516 merged by CDanis:

[operations/puppet@production] Add IRC alerting for two relevant NEL subtypes

https://gerrit.wikimedia.org/r/685516

Change 727594 had a related patch set uploaded (by CDanis; author: CDanis):

[operations/puppet@production] NEL alert is empirically high-signal & should page SRE

https://gerrit.wikimedia.org/r/727594

Change 727594 merged by CDanis:

[operations/puppet@production] NEL alert is empirically high-signal & should page SRE

https://gerrit.wikimedia.org/r/727594

Change 731166 had a related patch set uploaded (by CDanis; author: CDanis):

[operations/puppet@production] Filter prom-exported NEL stats to <=10min old reports

https://gerrit.wikimedia.org/r/731166

Change 731166 merged by CDanis:

[operations/puppet@production] Filter prom-exported NEL stats to <=10min old reports

https://gerrit.wikimedia.org/r/731166

Change 731171 had a related patch set uploaded (by CDanis; author: CDanis):

[operations/puppet@production] Add rate of high-signal NELs as a status page metric

https://gerrit.wikimedia.org/r/731171

Change 731171 merged by CDanis:

[operations/puppet@production] Add rate of high-signal NELs as a status page metric

https://gerrit.wikimedia.org/r/731171