For some number of days now, the appserver latency alerts for codfw have been flapping:
12:31:13	<icinga-wm>	RECOVERY - High average GET latency for mw requests on api_appserver in codfw on alert1001 is OK: All metrics within thresholds. https://wikitech.wikimedia.org/wiki/Monitoring/Missing_notes_link https://grafana.wikimedia.org/d/RIA1lzDZk/application-servers-red-dashboard?panelId=9&fullscreen&orgId=1&from=now-3h&to=now&var-datasource=codfw+prometheus/ops&var-cluster=api_appserver&var-method=GET
12:35:13	<icinga-wm>	RECOVERY - Elevated latency for icinga checks in codfw on alert1001 is OK: All metrics within thresholds. https://wikitech.wikimedia.org/wiki/Monitoring/Missing_notes_link https://grafana.wikimedia.org/d/rsCfQfuZz/icinga
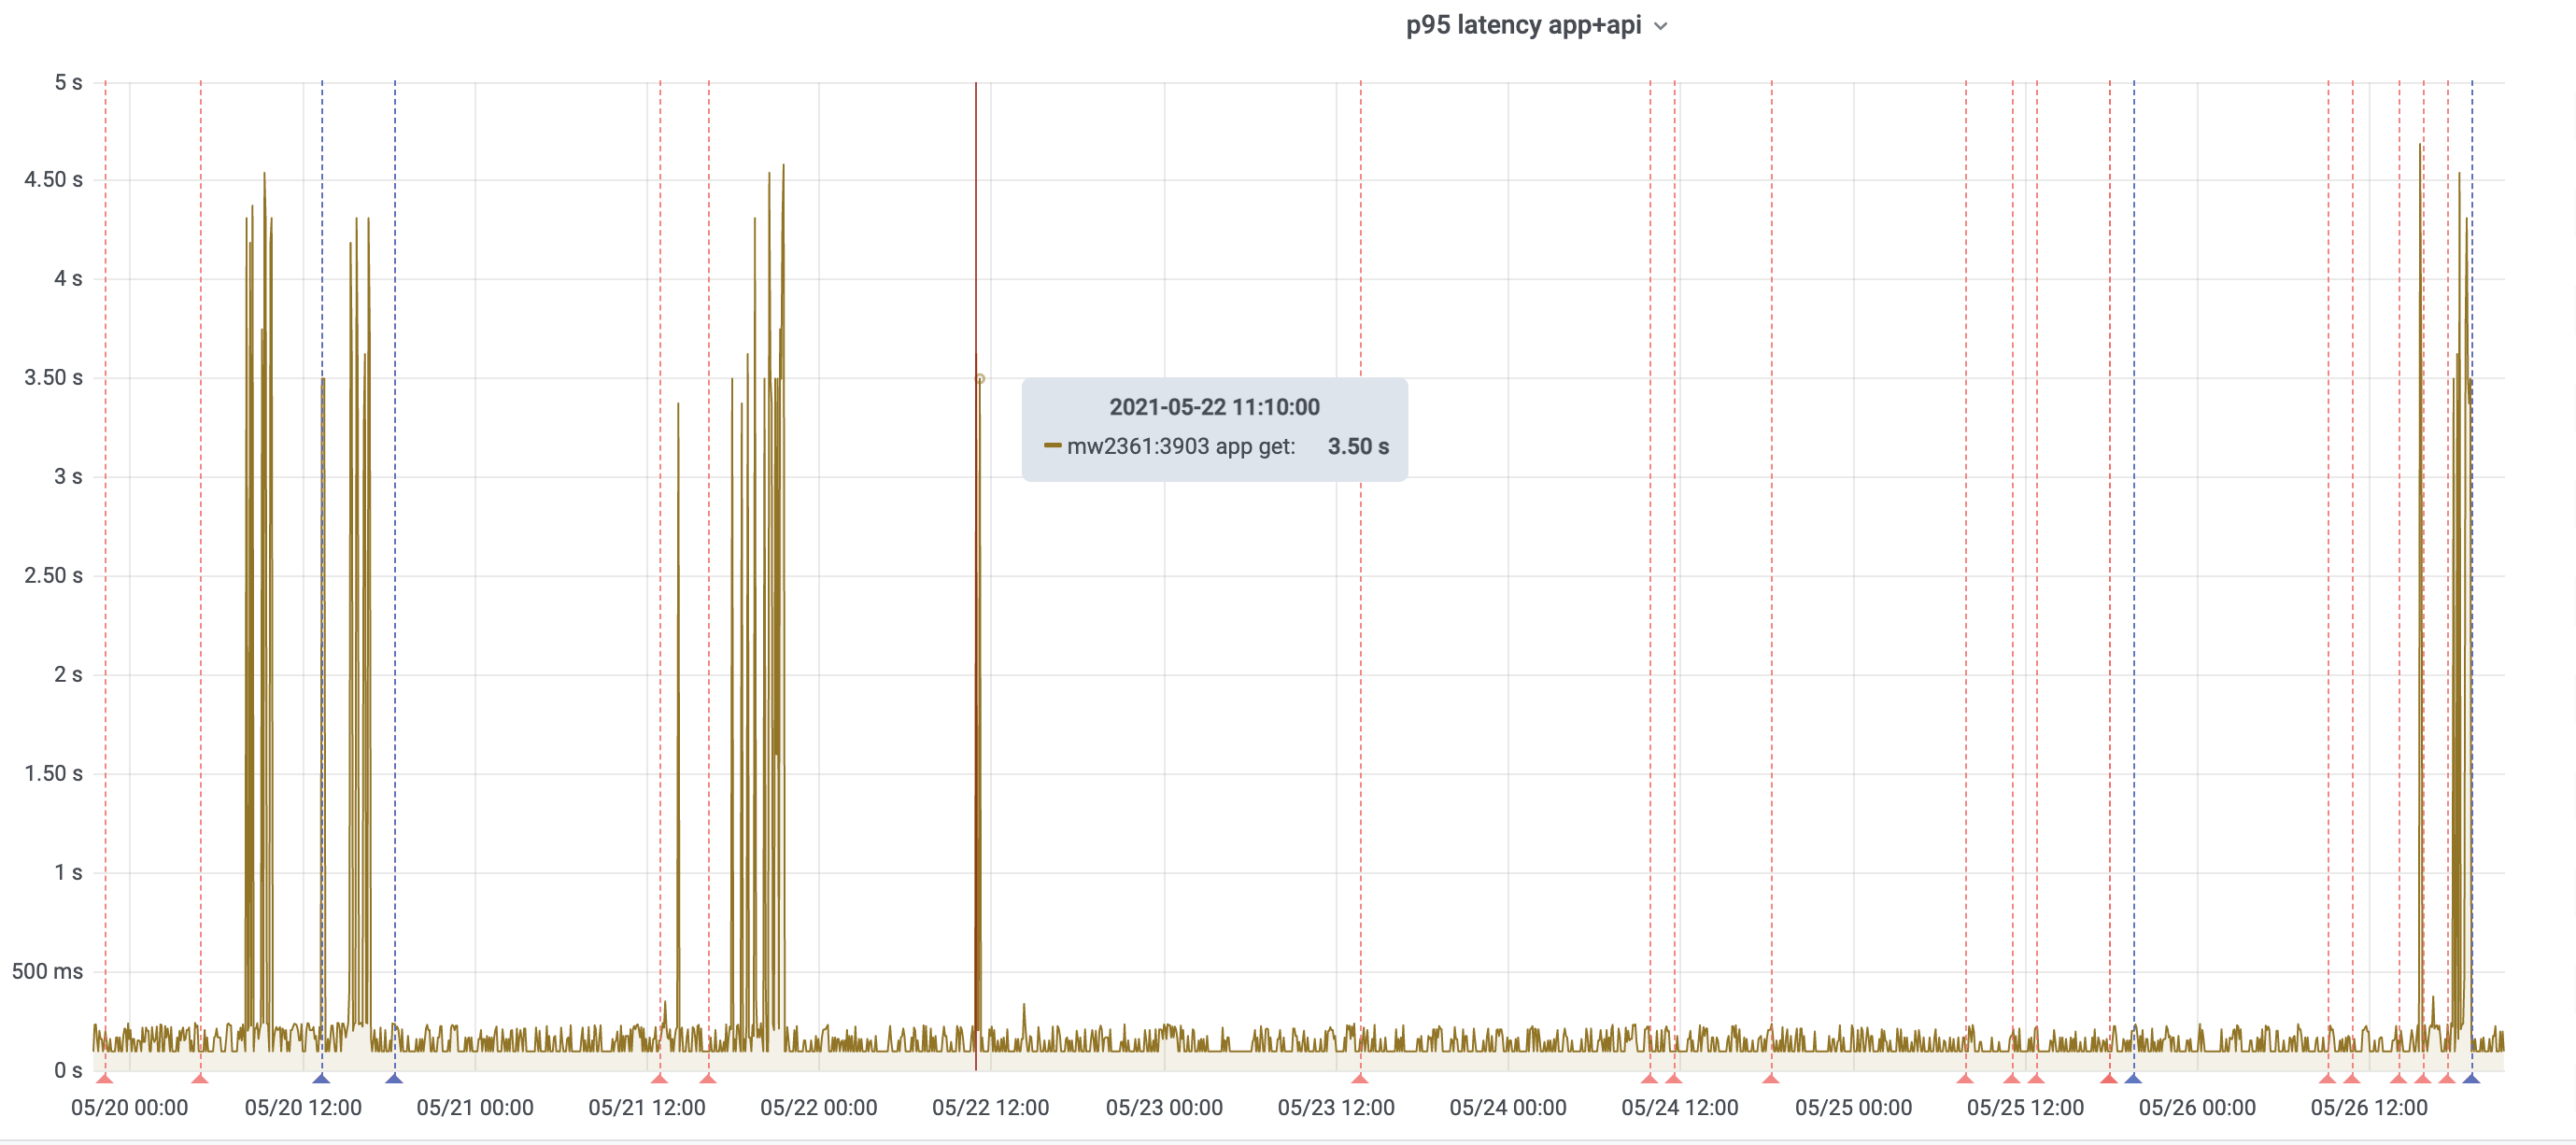
Seems to happen to both appserver and api_appserver clusters.
This isn't really concerning; mostly it is making noise.
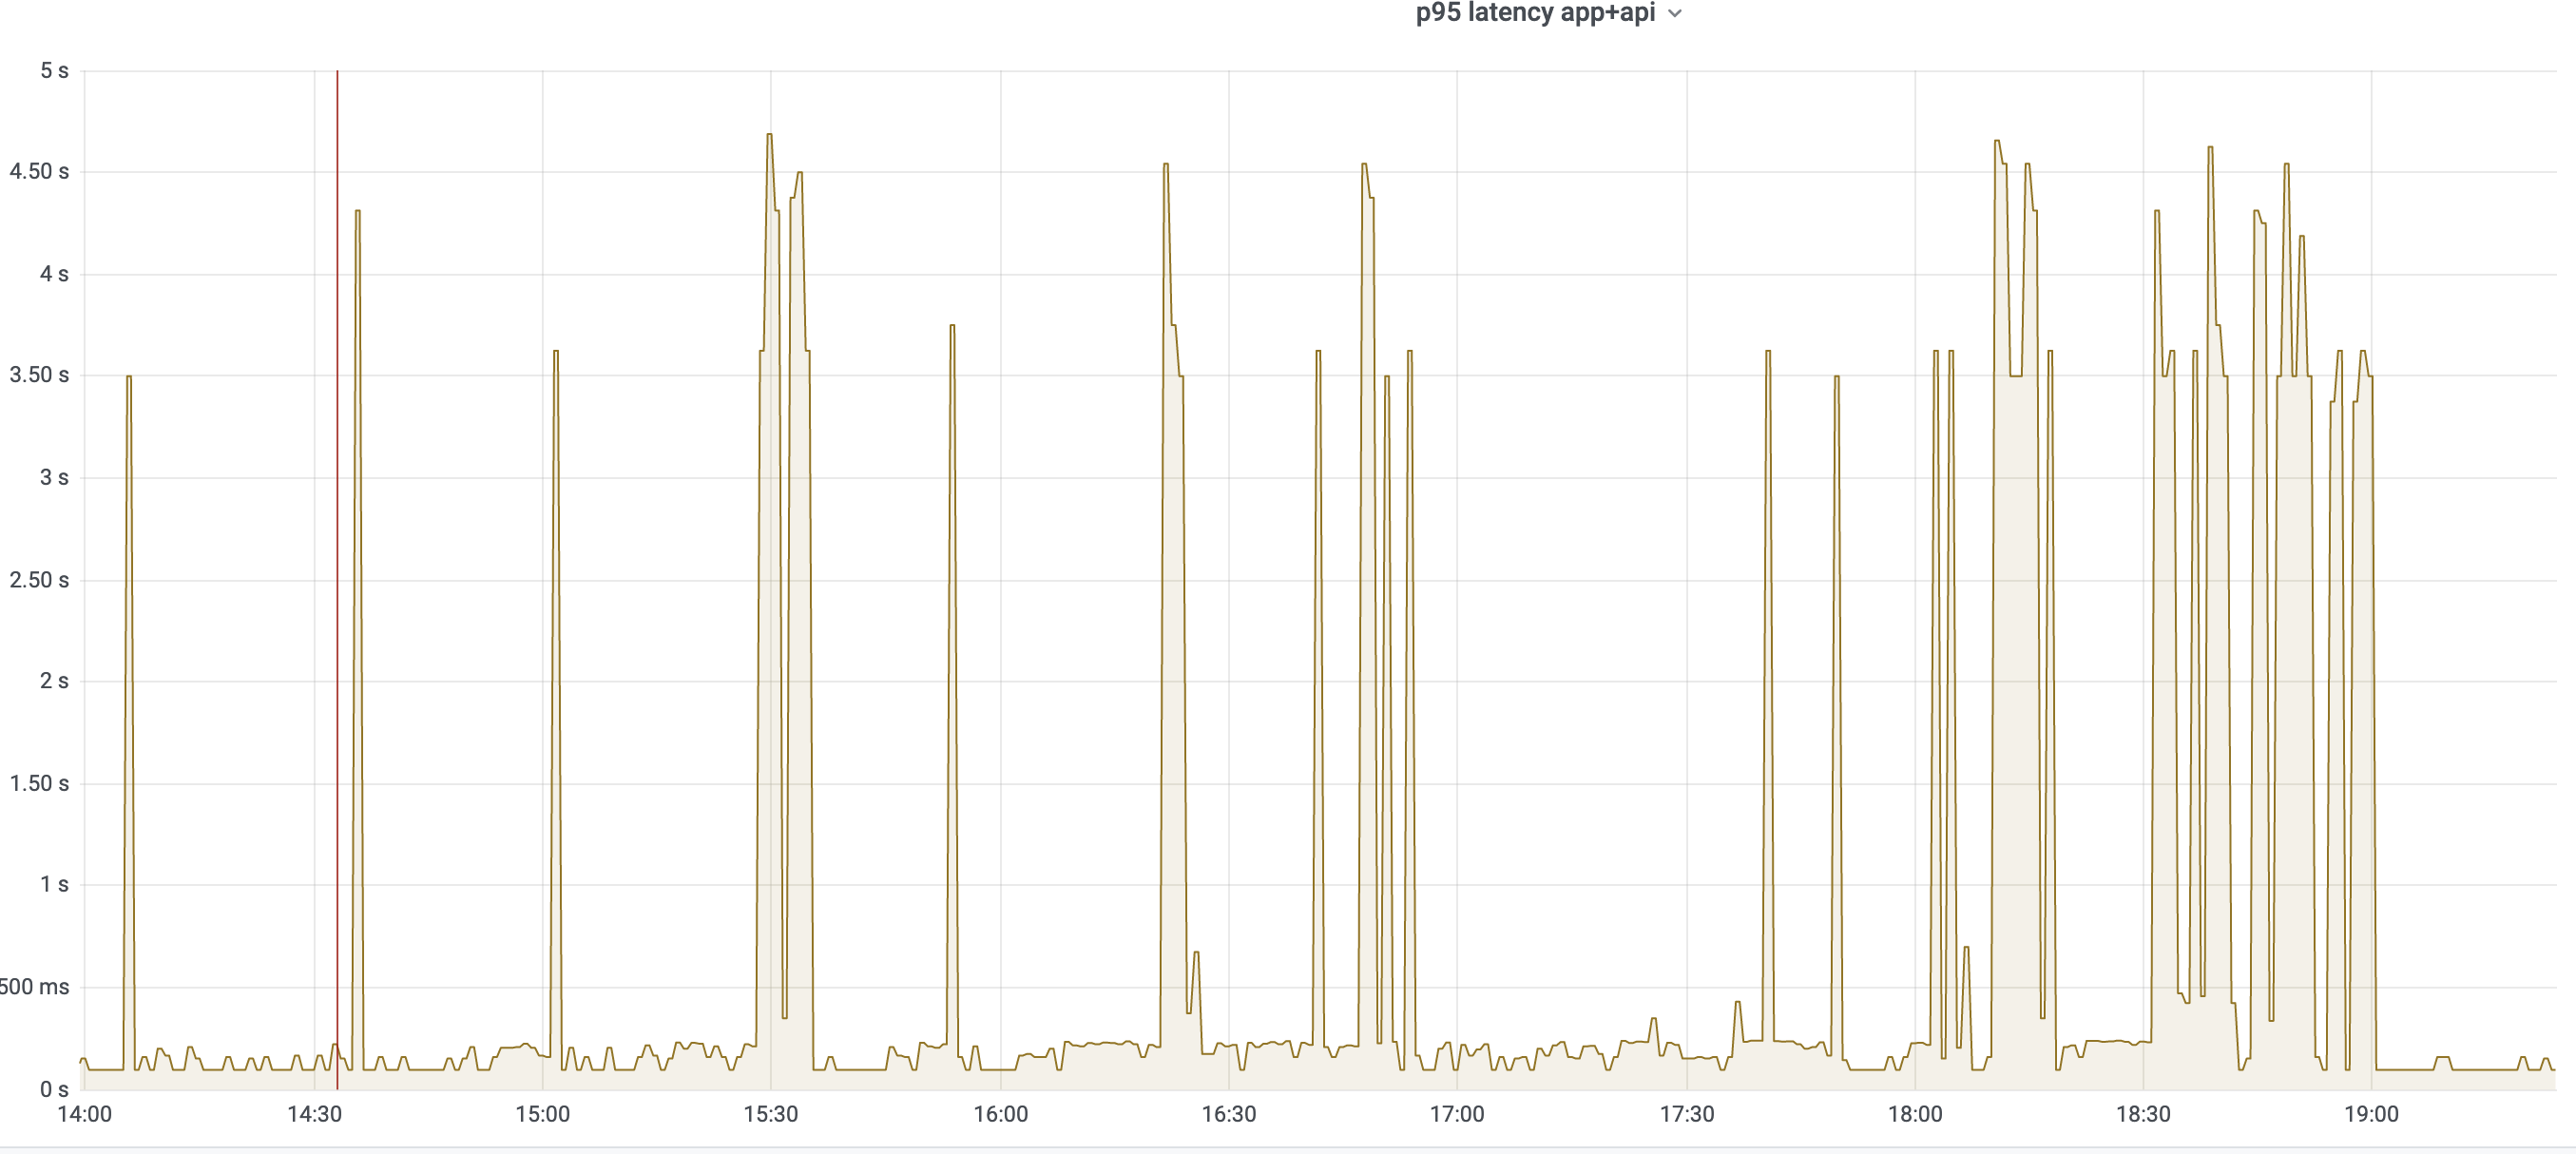
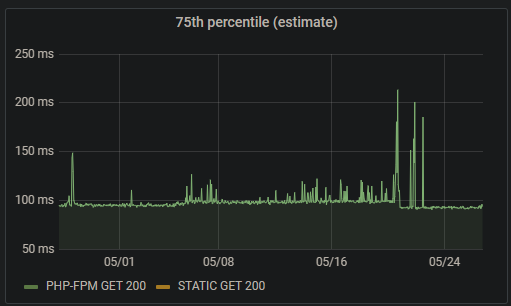
The overall number of rps in these clusters is very low -- approx 25 rps for each of api_appserver and appserver -- but they recently seem to be getting more 'slow' queries as compared to historically.
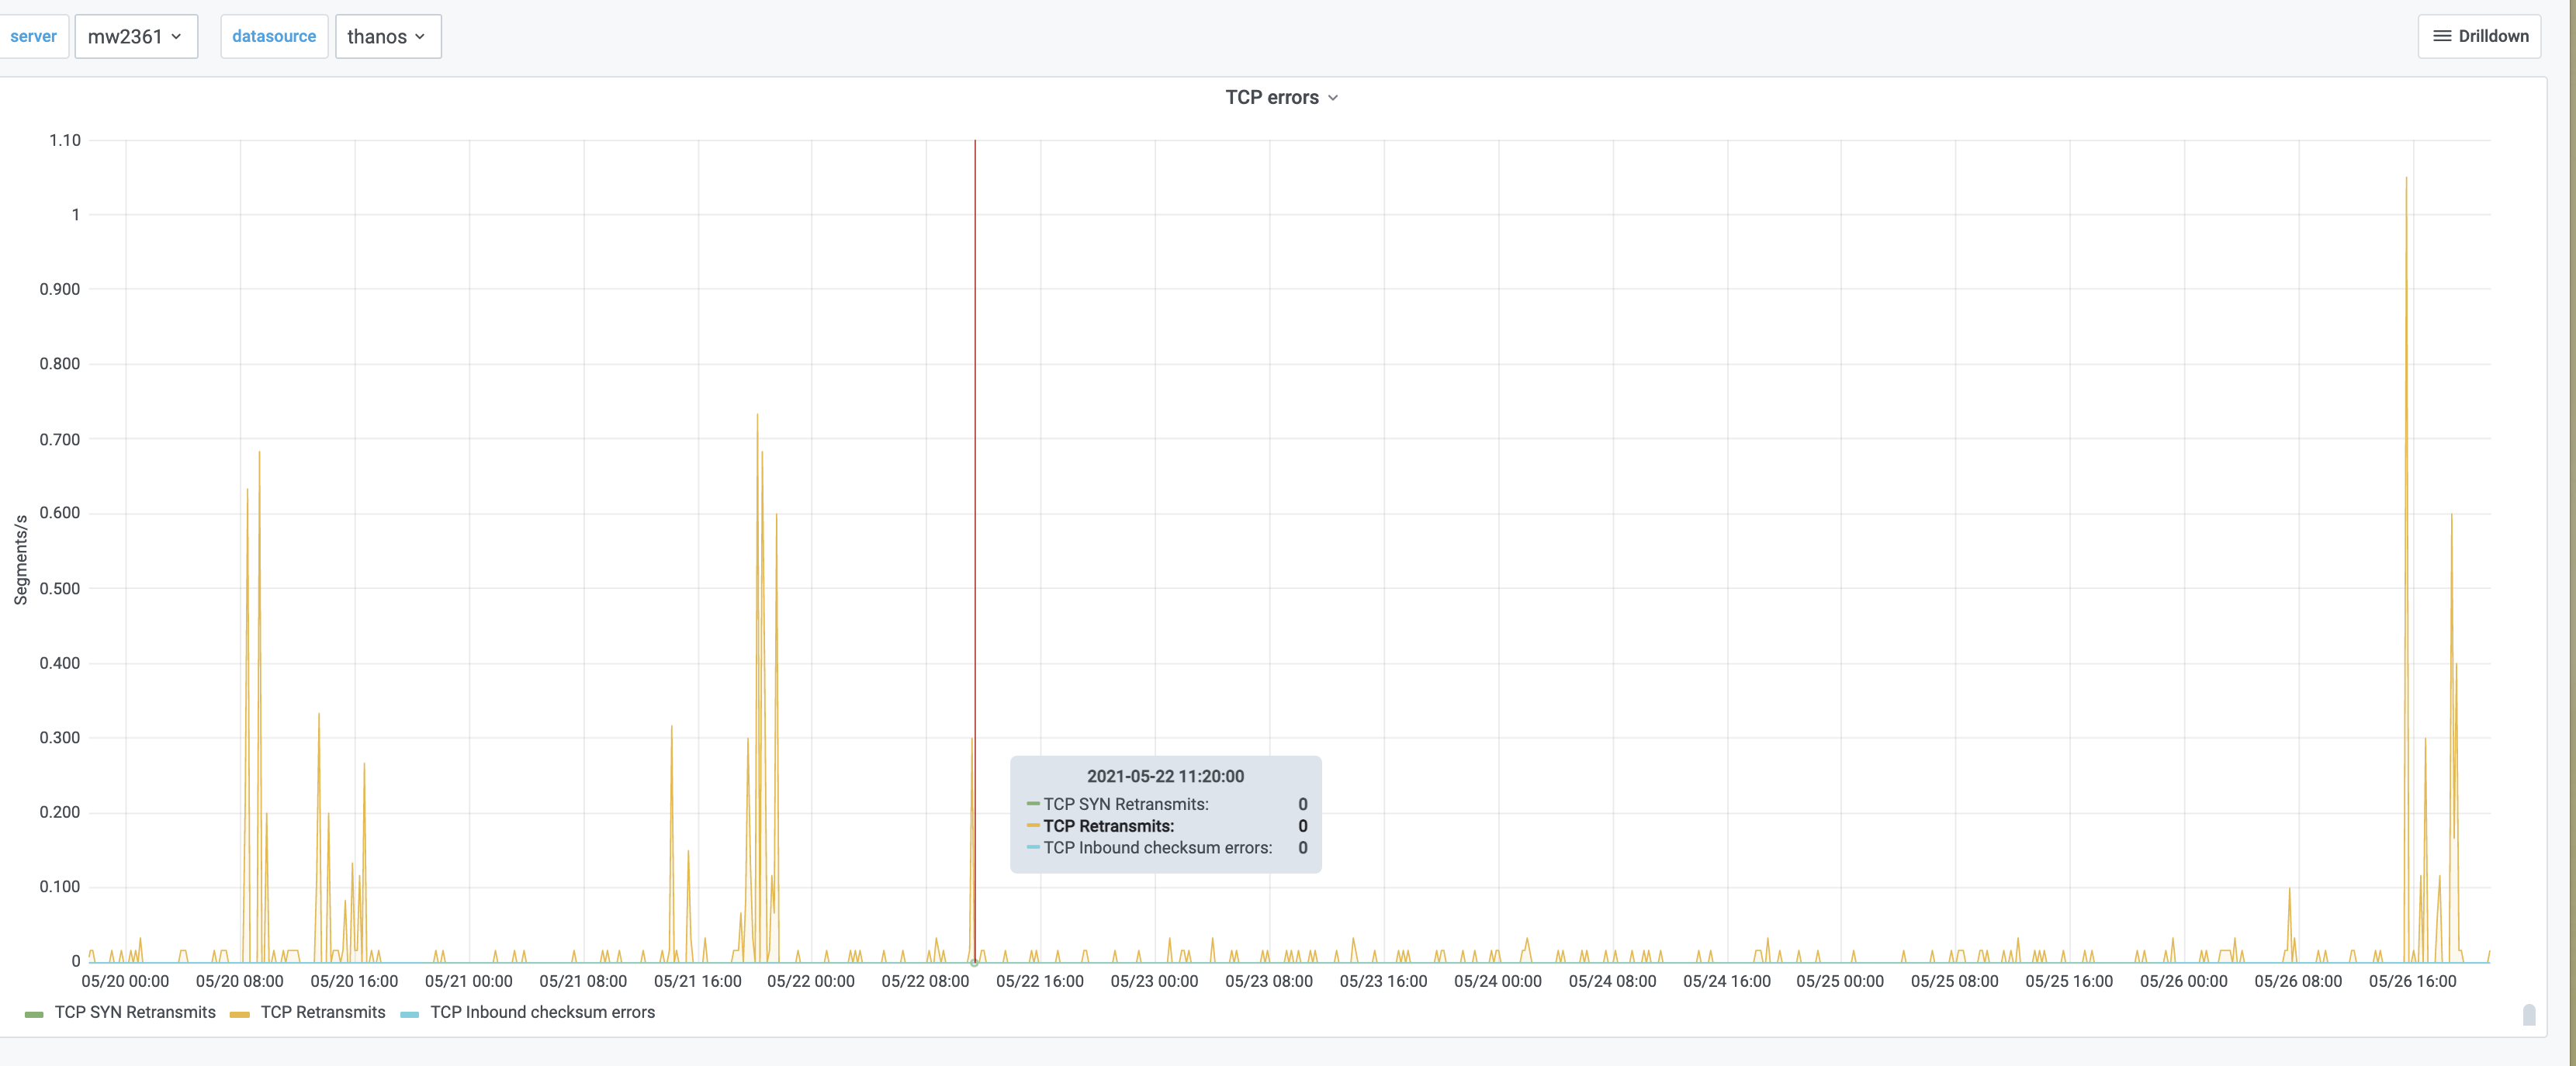
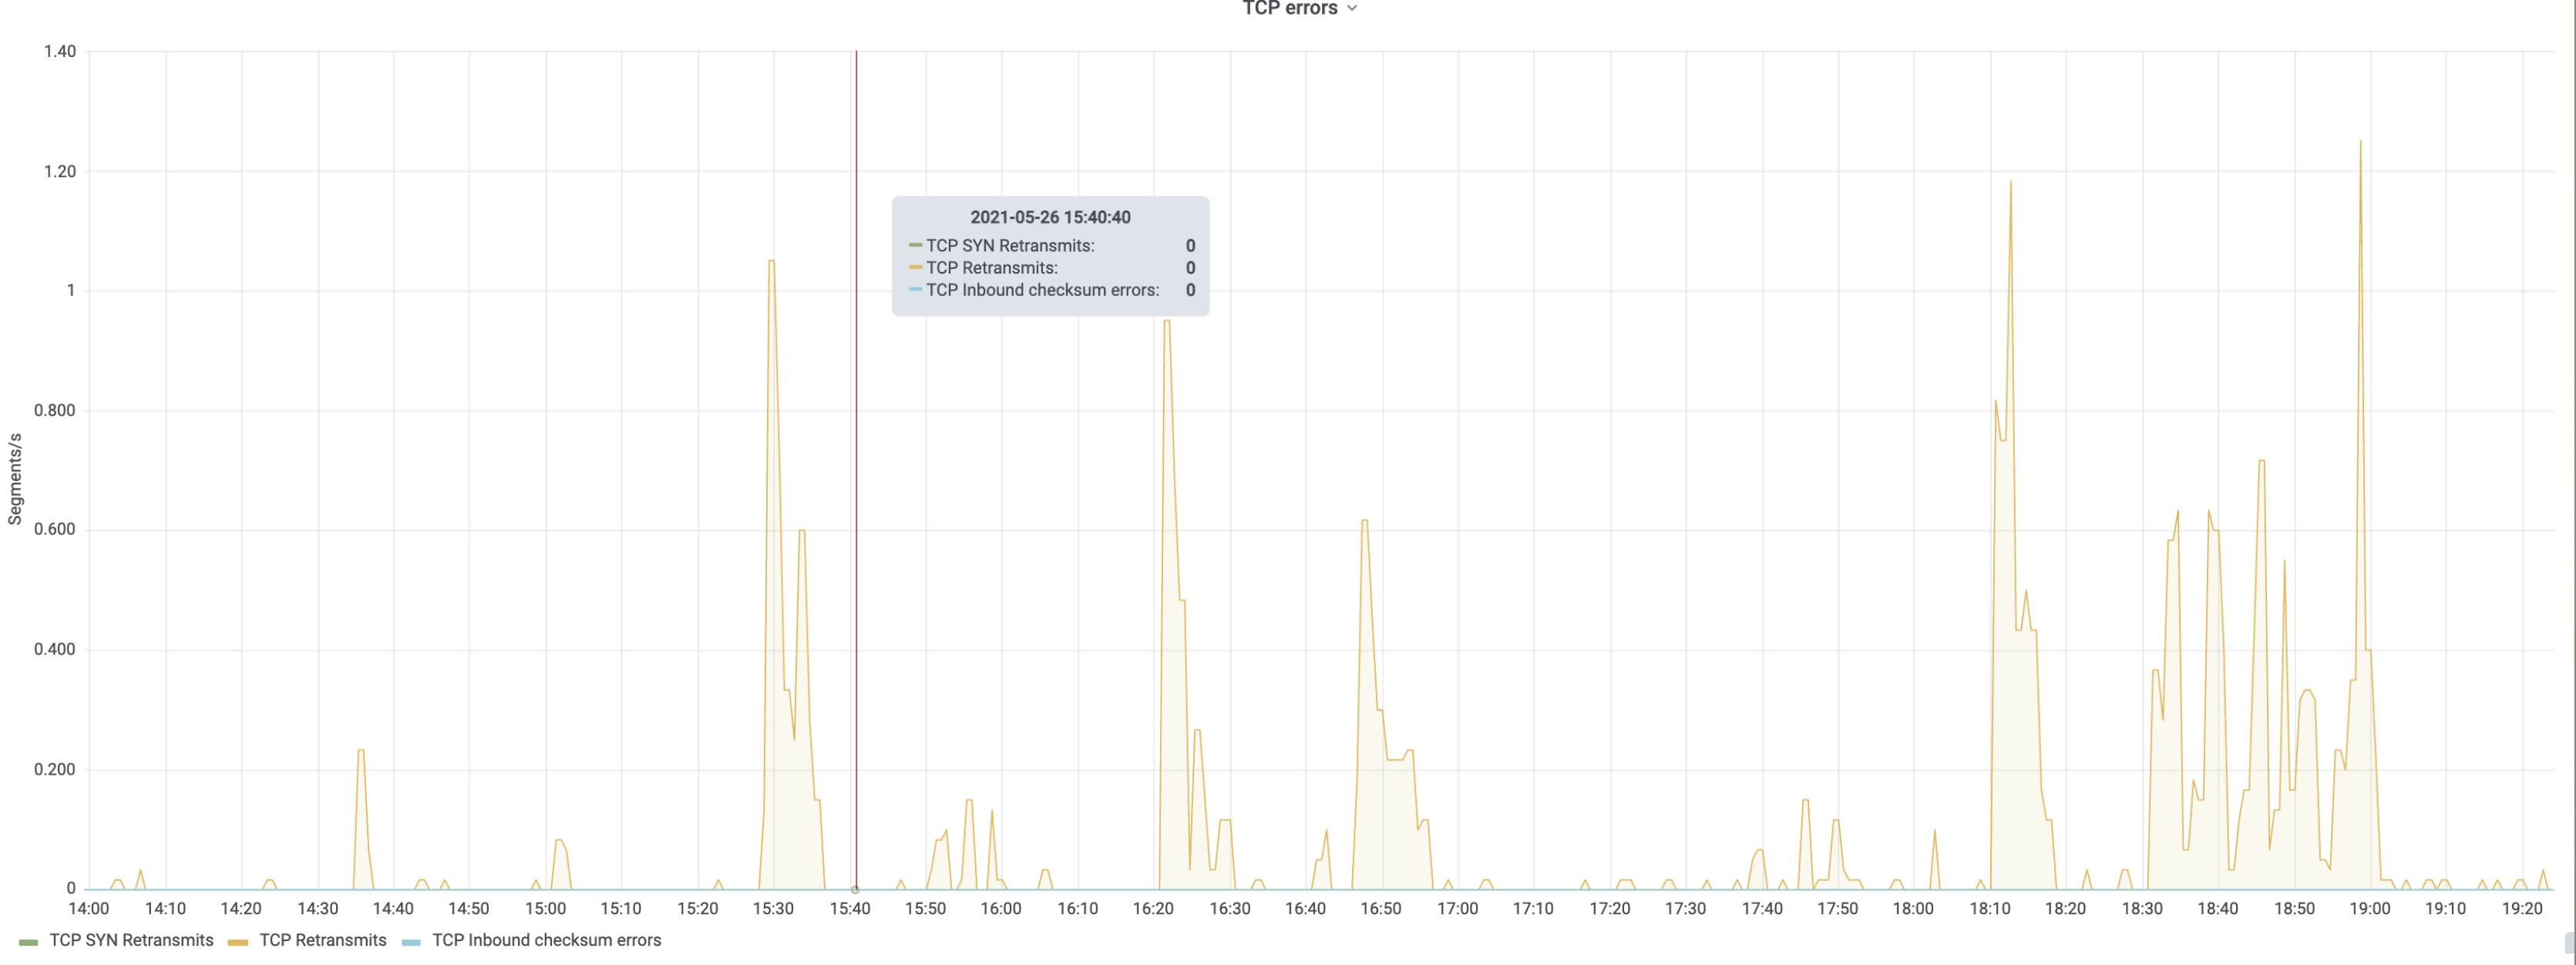
- Briefly investigate to see if something is amiss with these queries
- Modify the latency alerts to only fire if there is both high latency and query rps above a certain threshold