Page MenuHomePhabricator

puppet CI task failing with: Cannot allocate memory
Open, Needs TriagePublic

Description

I have noticed to day that the CI jobs have started to fail with the following error

 16:50:56      Puppet::PreformattedError:
16:50:56        Evaluation Error: Error while evaluating a Resource Statement, Evaluation Error: Error while evaluating a Function Call, Cannot allocate memory - fork(2) (file: /srv/workspace/puppet/modules/systemd/manifests/timer.pp, line: 38, column: 13) (file: /srv/workspace/puppet/modules/systemd/manifests/timer/job.pp, line: 169) on node 592c993e7595.integration.eqiad1.wikimedia.cloud

The fork in question is a call to /usr/bin/systemd-analyze however it has been in place in the puppet policy for a very log time.

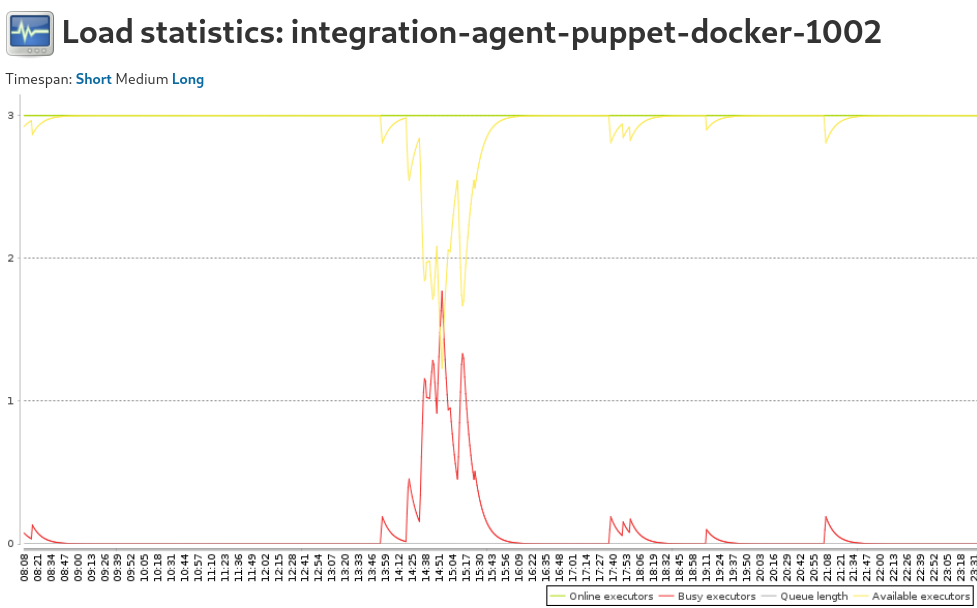
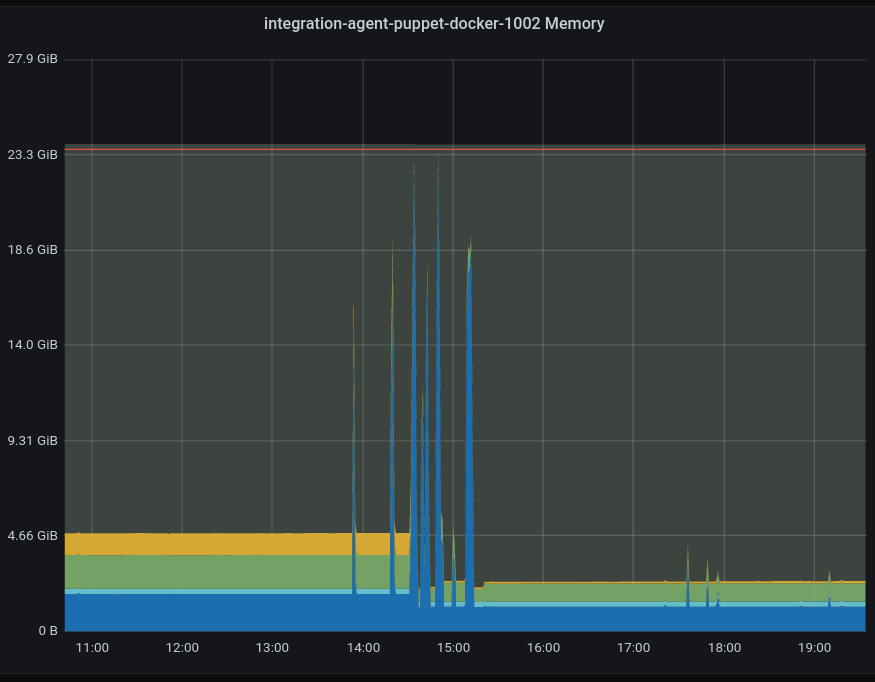
Has anything on the CI images changed which may prevent this fork. or is the CI job now using up all the available memory

Event Timeline

From contint2001:

$ grep -l 'Cannot allocate'  /srv/jenkins/builds/*puppet*/*/log
operations-puppet-tests-buster-docker/27249/log
operations-puppet-tests-buster-docker/27256/log

Which are:

So it is rather "rare". Might be an issue with the change or the instance. The instance is dedicated to jobs triggered for puppet.git and it had a few jobs running concurrently at that time:

cipuppetdocker1002.png (608×977 px, 93 KB)

The instance has 24 GB RAM. I checked it this morning and memory is empty:

$ free -m
              total        used        free      shared  buff/cache   available
Mem:          24105        1117       21630         259        1358       22378
Swap:             0           0           0

The memory usage is collected and can be find at https://grafana-labs.wikimedia.org/d/000000059/cloud-vps-project-board?orgId=1&from=now-2d&to=now&var-project=integration&var-server=integration-agent-puppet-docker-1002 the memory view:

ciagentpuppetdocker1002-memory.png (682×875 px, 33 KB)

So the instance is empty, some user process (aka the docker run of the test suite) does explode the memory usage and that sounds related to the test suite / this particular change.

We had an issue in the paste with a big process (like mediawiki test) forking an external command that is itself lightweight. But Linux still checks whether there is enough memory available for the fork and might gives us cause there is not enough RAM free. For example with 24G of physical memory, a process currently using 20G would not be able to fork a command (even if that is just /bin/true), cause Linux considers that the forked process might well use that forked memory and thus check whether it can be copied. TLDR: can be tuned by vm.overcommit_memory.

That has hit us twice in the past, the most recent being Phan (static analyzer for PHP) shelling out to the lightweight tput command. T219114#5084302 has the summary, we fixed it by removing the fork call in the upstream project and thus did not set vm.overcommit_memory:

integration-cumin:~$ sudo cumin --force '*' 'cat /proc/sys/vm/overcommit_memory'
...
0                                                                                                                                                           
...

But in this case I guess it is an issue with the test suite consuming too much memory :-\

My suspicion is that it is due to multiple concurrent builds of the job AND us running tests in parallel.

If the changes triggers running spec for several modules/profiles, parallel_tests runs as many process as there are CPU available and the the instance has 8 CPU. So you can get up to 3 builds * 8 spec tests running = 24 runs and I guess that ends up overloading the instance. I don't have a solution for that though beside limiting parallel_tests. And since we split by modules, we might be adding even more parallel processes, one of the failing job has:

00:00:08.943 ---> spec:base
00:00:08.950 ---> spec:bacula
00:00:08.950 ---> spec:etcd
00:00:08.950 ---> spec:install_server
00:00:08.950 ---> spec:jenkins
00:00:08.950 ---> spec:nrpe
00:00:08.950 ---> spec:profile
00:00:08.950 ---> spec:puppetmaster
00:00:08.950 ---> spec:query_service

Then:

00:00:10.549 1 processes for 1 specs, ~ 1 specs per process
00:00:10.648 3 processes for 3 specs, ~ 1 specs per process
00:00:10.721 5 processes for 5 specs, ~ 1 specs per process
00:00:11.777 5 processes for 5 specs, ~ 1 specs per process
00:00:12.261 4 processes for 4 specs, ~ 1 specs per process
00:00:12.341 7 processes for 7 specs, ~ 1 specs per process
00:00:12.968 3 processes for 3 specs, ~ 1 specs per process
00:00:18.118 1 processes for 1 specs, ~ 1 specs per process
00:00:19.641 1 processes for 1 specs, ~ 1 specs per process

So I suspect we initialize a parallel_tests instance per module, each independently trying to use up to 8 CPU. So that build would end up with 30 rspec instances running in parallel, if the other builds do the same it is clearly entirely overloaded :-\

I don't have a good solution to that problem though :\

Thanks Hashar, I am mresurecting https://gerrit.wikimedia.org/r/c/operations/puppet/+/649684 which is i think the correct solution

@hashar i have now merged #649684 and things feel smoother to me i think we can close this task now. however it would be usefull (for me) to see if the resource usage on theses instances has gone down, or if the average job run time has decreased. I was unable to see anything obvious in grafana and couldn't find anything useful in Jenkins. Any pointers would be most appreciated :)