One of our quarterly goals was "Define a metric to track OpenStack system availability". Despite the weak phrasing, we elected to not only pick something to measure but also to actually measure it.
I originally proposed this goal based on the notion that VPS creation seems to break pretty often, but that I have no idea how often, or for how long. The good news is that several months ago Chase wrote a 'fullstack' testing tool that creates a VM, checks to see if comes up, makes sure that DNS and puppet work, and finally deletes the new VM. That tool is now running in an (ideally) uninterrupted loop, reporting successes and failures to graphite so that we can gather up long-term statistics about when things are working.
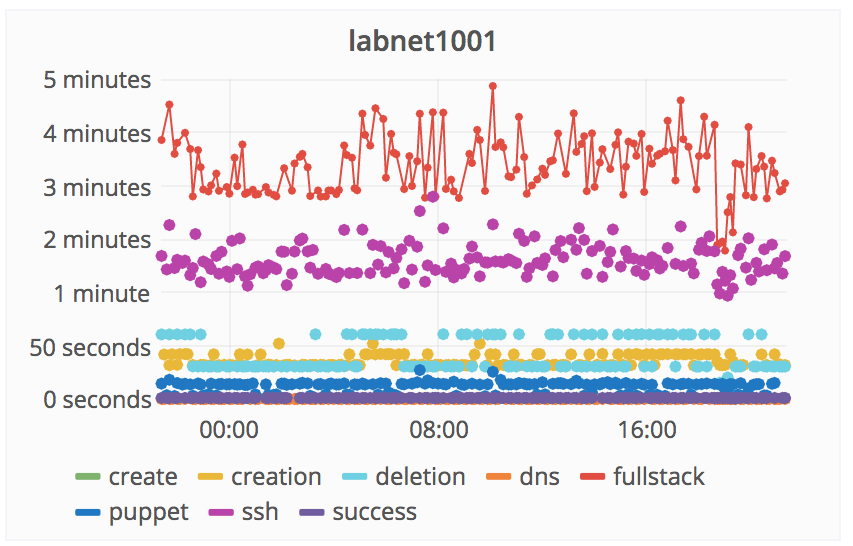
In addition to the fullstack test, I wrote some Prometheus tests that check whether or not individual public OpenStack APIs are responding to requests. When these services go down the fullstack test is also likely to break, but other things are affected as well: Horizon, the openstack-browser, and potentially various internal Cloud Services things like DNS updates.
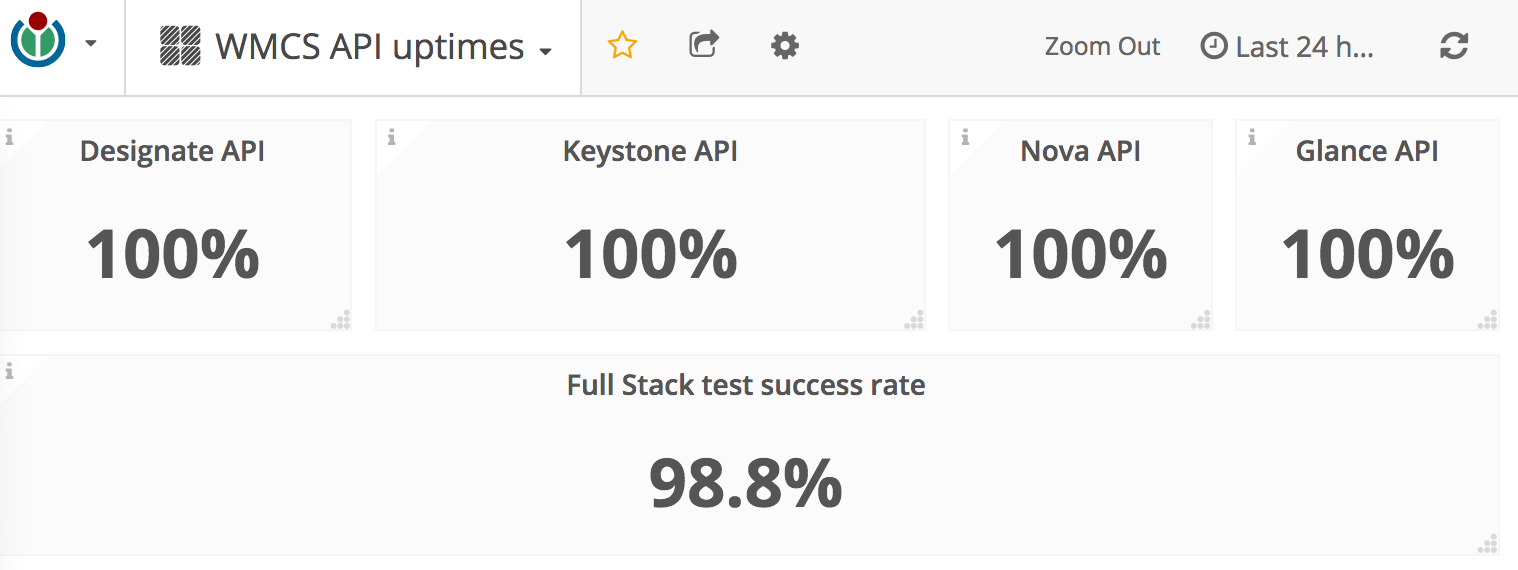
All of these new stats can now be viewed on the WMCS API uptimes dashboard. The information there isn't very detailed but should be useful to the WMCS staff as we work to improve stability, and should be useful to our users when they want to answer the question "Is this broken for everyone or just for me?"
- Projects
- Subscribers
- None
- Tokens