Footfall analytics and POI characterization through Big Data are being used by different business sectors in order to make smarter business decisions and thereby maximize their revenues and optimize their costs.
Case Study: POI analysis of N1 City Mall in Cape Town, South Africa
At PREDIK Data-Driven we conducted a detailed study of N1 City Mall, a regional area filled with diverse retail outlets ranging from shopping malls, such as N1 City Mall, one of the leading profitable malls in Cape Town since it opened its doors in 1990, Ampath hospitals and laboratories, Hyundai, Volkswagen, McCarthy Toyota car dealerships, fast-food restaurants such as McDonald’s, Burger King, Nando’s, Dis-Chem and Clicks pharmacies, to large retail stores such as Pick n Pay, Food Lover’s Market, Plumblink, among many others.
Through a POI and footfall analysis, we identified the people who visited the area of interest, estimated the foot traffic, identified the most and least crowded places, create a profile of the visitors, live or work in the area, number of observations per day, as well as their relative wealth index characteristics.
In this case study, we analyze the foot traffic and the immediate surroundings of the point of interest, with the objective of identifying the behavioral patterns of the people who visit this establishment. This analysis aims to answer the following questions:
Which areas and locations have the highest concentration of foot traffic?
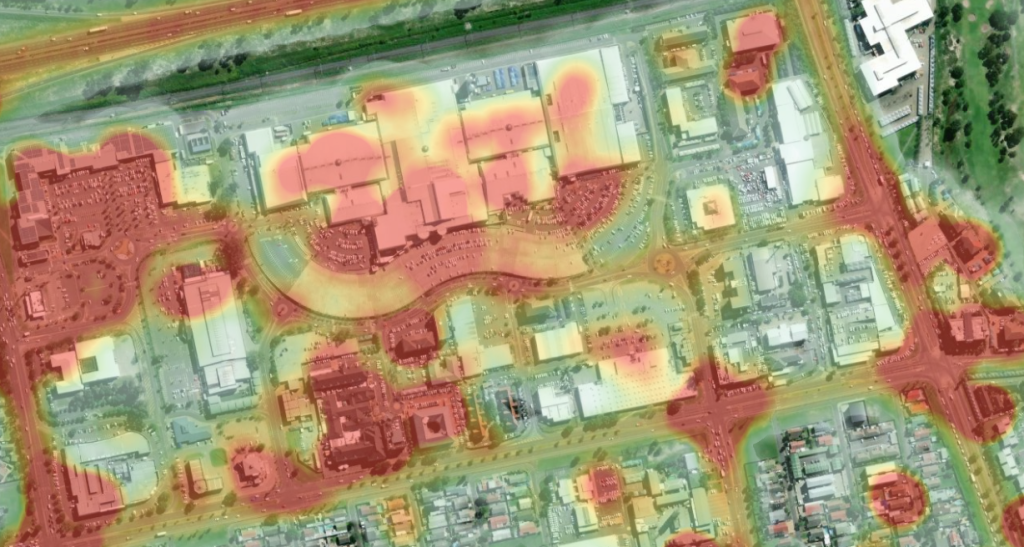
By generating a heat map that covers the entire POI analyzed, we were able to identify the most important areas of foot traffic density in and around the region, where we can identify the areas whit the highest mobility concentration.
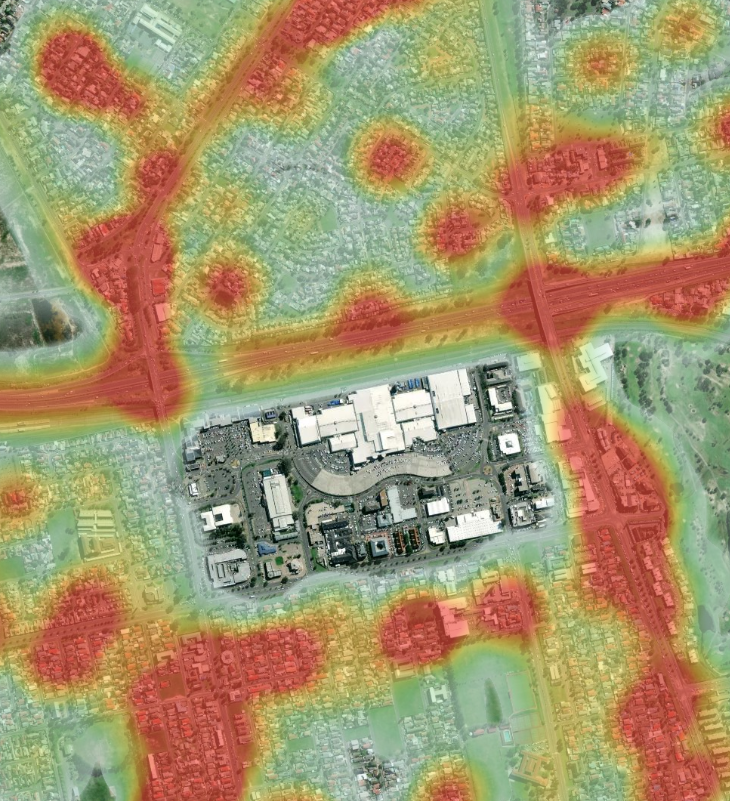
This type of analysis also allows to identify mobility concentrations in streets and avenues, this helps to identify bottlenecks in urban mobility or even to determine where to place the exit or entrance of a shopping mall.
How are visits distributed in N1 City?
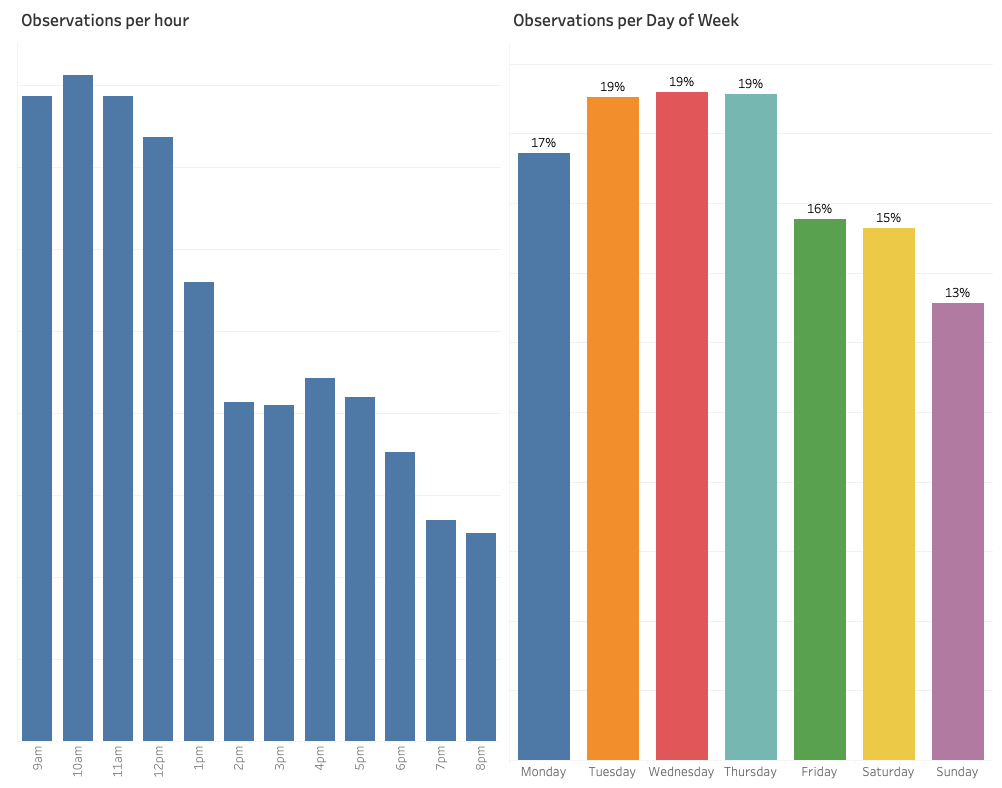
The distribution by the hour, day, month, and year is an important segmentation when characterizing and analyzing a POI, since it allows: estimating the times and schedules of certain premises or locations and knowing when they are more and less crowded, estimating the average time that certain records are spent in or near specific areas, finding the times of day that are more and less favorable for implementing a product or service.
Which is the profile of the people who visit N1 City?
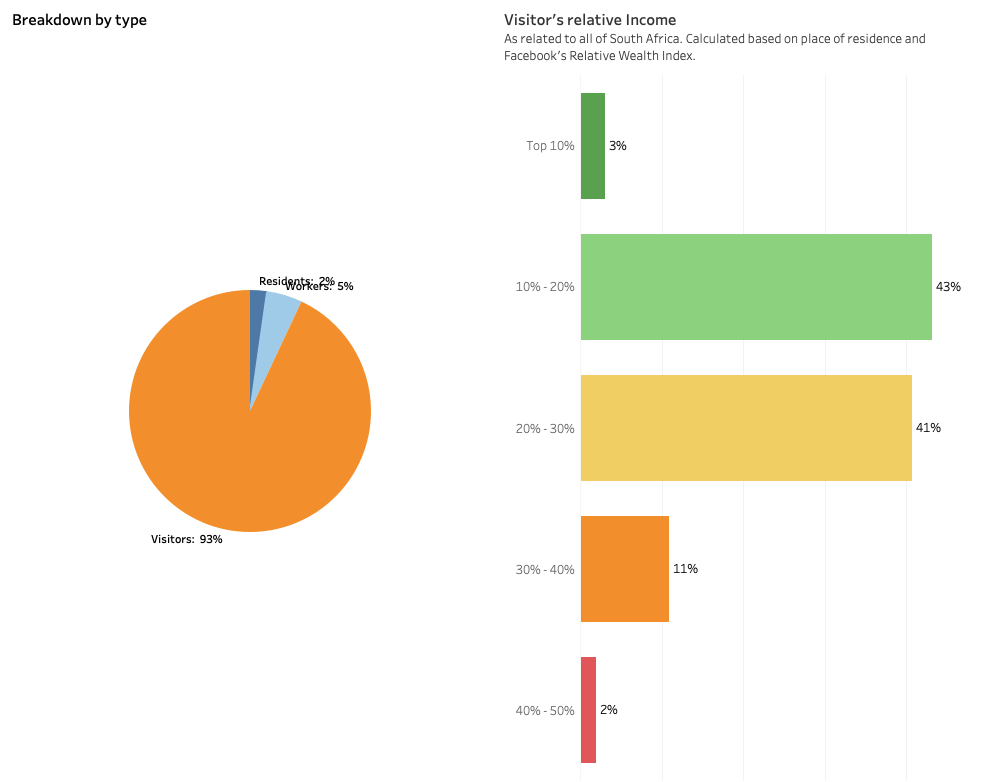
With a Global Relative Wealth Index data layer, collected by Facebook, the socioeconomic levels of the inhabitants and their status were estimated. In parallel, applying spatial data analysis techniques, corporate buildings, residential areas, schools, etc. are located; the combination of these two analyses allows classifying visitors as students, workers, residents, or “floating or instant population”, i.e. people who only transit through that area to reach another location.
These analyses reach such a level of detail that they even allow us to identify the places where the people who visited a POI come from, and where they go after they have visited the POI.
