

Investigating a performance improvement
By Gilles Dubuc, Engineering Manager, Wikimedia Performance Team
Last week Jon Robson pinged me by email about a performance improvement his team noticed for large wiki articles on the mobile site in our synthetic tests run on WebPageTest.
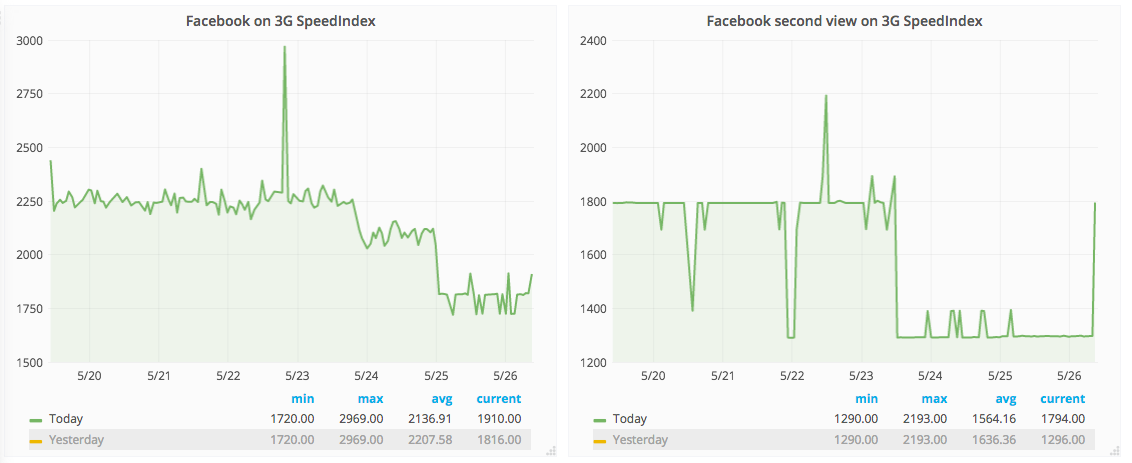
SpeedIndex is described this way by Pat Meenan, the author of WebPageTest:
The Speed Index is the average time at which visible parts of the page are displayed. It is expressed in milliseconds and dependent on size of the view port.
The actual mathematical definition is a bit more complicated, but essentially it captures, from an end-user perspective, a score of how fast visual completeness is reached above the fold, for a given viewport size and a given internet connection speed. In the case of the WebPageTest run spotted by Jon Robson, the viewport is mobile phone-sized and the speed is simulated 3G. We run different profiles in WebPageTest that represent different kinds of devices and internet speeds, because sometimes performance changes only affect some devices, some types of connection speeds and some types of wiki pages, even.
As we do for every suspected performance improvement or regression from an unknown cause, we filed a task for it, tagged Performance-Team tag and began investigating: T166373: Investigate apparent performance improvement around 2017-05-24. Creating a task directly and tagging us is also a good way to get our attention.
Comparing synthetic testing and real user metrics
When a change like this happens in synthetic testing, we first verify whether or not a similar change was seen in our real user metrics. Specifically, Navigation Timing in Grafana.
SpeedIndex can’t be measured on real users. Real user metrics are limited by the APIs available in browser, which are very basic compared to what WepPageTest can do. There’s no way to tell the visual completeness of the whole page from client-side code.
The main real user metric we track is firstPaint. However firstPaint measures something very different than SpeedIndex. FirstPaint is when the web browser starts painting anything on the page. Whereas SpeedIndex is about how fast visual completion in the viewport happens. Essentially, SpeedIndex is about the phase that happens after firstPaint, which real user metrics can’t measure. But since they’re on the same timeline, it’s common for a SpeedIndex change to come with a variation in real user metrics like firstPaint. When that happens, it makes the investigation easier because we know it’s not an issue in our telemetry, but a real effect. When there’s no correlation between synthetic testing metrics and real user metrics, we just have to keep investigating more in depth.
This fundamental difference means that some performance improvements can improve SpeedIndex, while not changing firstPaint or any other Navigation Timing metric. It’s unfortunate in the sense that we know performance has improved, we just can’t measure how much it did in the real world for our users. This is exactly what we were seeing here, real user metrics didn’t improve during that period. Which doesn’t mean that performance didn’t really improve for people. As we’ll see later, it did. It’s also fundamental to understand that Navigation Timing is only a partial view of performance, and that some performance changes simply cannot be measured from real user data at this time.
Comparing WebPageTest runs
The next logical step was to compare WebPageTest runs before and after the performance change. Our synthetic tests, which run continuously, can be consulted on our public WebPageTest instance. WebPageTest’s UI isn’t the best suited for our use case, so here’s a walkthrough of where to look.
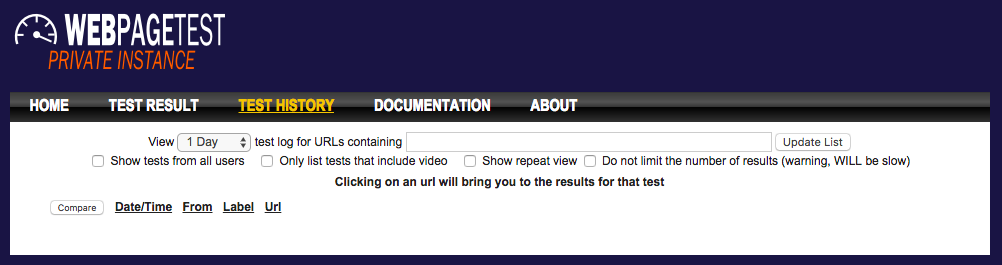
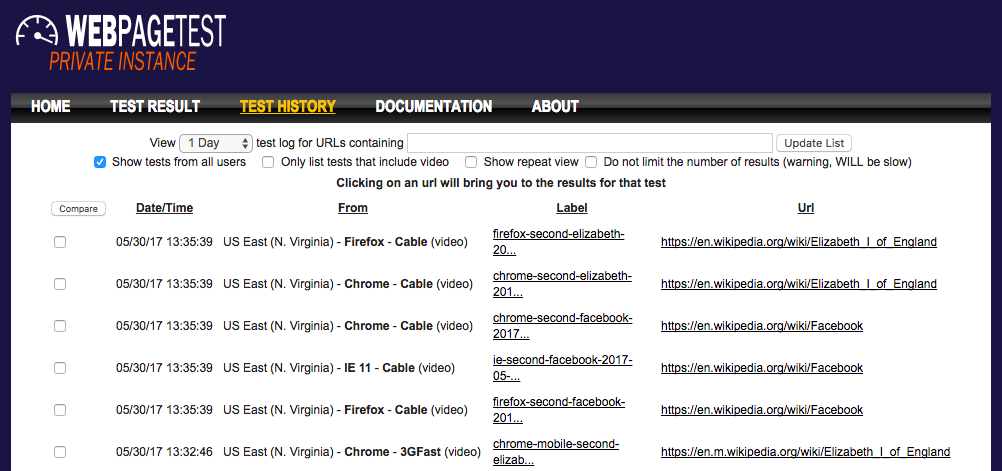
We test a number of pages for the desktop and mobile site, using various simulated internet connection speeds, etc. Finding the tests you’re interested in in this history view requires manual labour, as you need to manually search for the labels you’re interested in, the search box only applying to the URL.
WebPageTest supports a great feature to compare different runs from the history view. We won’t get into that here, though, as the difference is visible from the screenshot of the runs alone. After combing through the history view, I found two runs of the same test (the Sweden article on English Wikipedia, browsing the mobile site on Chrome with a simulated 3G connection.) before and after the SpeedIndex drop.
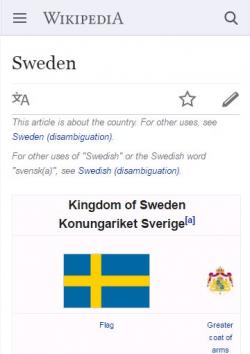
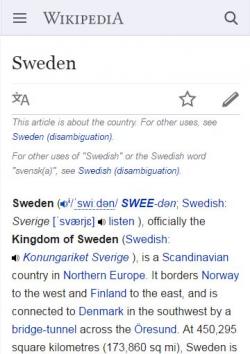
It’s obvious that the content above the fold changed. The new version displays mostly text above the fold, where the old version had images. This explains the SpeedIndex improvement: it’s faster to load text than an image, which means that users get content they can consume above the fold faster. This is more dramatic on slow connections, which is why this performance improvement showed up on our synthetic testing that simulated a 3G connection.
Deliberate or accidental change?
The next part of the investigation was to determine whether that was an accidental change, or a deliberate one. For this, the first place to look is the Wikimedia Server Admin Log. Whenever changes are deployed to Wikimedia production, log entries are added there. Deployments can be individual patches or our weekly deployment train. This part of the investigation is simple: we’re simply going through the log, looking for anything that happened around the time the performance change happened.
And sure enough, we found this log entry around the time of the performance change:
18:31 thcipriani@tin: Synchronized wmf-config/InitialiseSettings.php: SWAT: mobileFrontend: Move first paragraph before infobox T150325 (duration: 00m 41s)
The task quoted in that log entry, T150325: Move first paragraph before infobox on stable, is a deliberate change to improve the user experience by showing the first section of an article at the top rather than the infobox. While making this change, Sam Smith also improved the performance for users on slow internet connections, who will now see the first section of an article above the fold, which they can start reading early, instead of a mostly empty infobox whose images are still loading.
About this post
This post was originally published on the Wikimedia Performance Team Phame blog.
Featured image credit: Barack Obama through a magnifying glass, Pete Souza, public domain