Introduction and summary
Demographics are not destiny, but steady and predictable changes to the electorate play an important role in defining the landscape of American politics. Just as the country’s population has changed substantially over the last several decades—growing older, more educated, and more racially diverse—we expect those changes to continue over the next several decades. At its heart, the States of Change project takes these changes seriously and tries to understand how they might influence American politics.
In our 2018 report, we examined an array of future presidential election scenarios—from 2020 through 2036—that could arise as the demography of the nation and its 50 states changes over the next several decades.1
In this 2020 report, we update our electoral scenarios in several important ways. First, we have produced a new set of underlying demographic projections for the nation and all 50 states plus the District of Columbia based on the latest census data. These projections trace the probable path of demographic change across the country—both for the population as a whole and, importantly, for eligible voters.
Second, we have explicitly incorporated gender into our projections and scenarios for the first time. This is not because the population distribution between men and women is likely to change but because gender has become a more prominent dividing line in vote behavior both overall and within many demographic groups.
Finally, and most importantly, we have included generations in our partitioning of the electorate and built electoral simulations that explicitly grapple with narratives about the likely evolution of generational cohorts over the next several decades.
We use the term electoral simulations quite intentionally. This report and those that came before it are not about predicting the future. If we carried any illusions about the feasibility of foreseeing what lays ahead, the tumultuous events of the last four years have surely robbed us of this notion.
Instead, the point is to try and map out the potential influence of the pieces of the future that are relatively knowable. That allows us to provide rigorous baselines for thinking about how a given phenomenon might shape things under several plausible scenarios. While we may not know whether the election of 2024 will take place during a recession or an economic boom, we can nevertheless paint a reasonably accurate portrait of the nation’s underlying demographic landscape for that election.
In our previous reports, our electoral simulations assumed that party preferences for a given demographic group defined by age, race, education, and state—say, Hispanic Californians with a college degree between the ages of 45 and 64—would hold constant throughout a given simulation. The reason elections produced different results over time in these simulations was due to the fact that these groups were growing and shrinking as a share of all eligible voters—not that their preferences for a Democratic or Republican candidate were changing.
Beyond judging whether a simulation like this is realistic or unrealistic, it is better to think of it as being an exploration of a very particular idea: What would election results look like in the future if the only thing that changed was the relative size of different demographic groups defined by race, age, education and state?
In this year’s report, we explore a different idea. In contrast to our previous reports—which held the political preferences of these demographic groups constant—we simulate what would happen if cohorts of voters defined by their birth year, such as Millennials or Baby Boomers, held onto their political preferences as they aged.
To put this scenario in context, one common narrative about American voters is that they are liberal and Democratic leaning in their youth and grow more conservative and Republican leaning as they age. The most coherent version of this story is that certain types of life events like home ownership, marriage, and raising children lead people to become more conservative and Republican leaning as they age.
This idea has led some to dismiss the salience of generational cohorts in modern politics. At some level, they are assuming that the political leanings of America’s youngest generations will shift substantially as they age and simply recreate the current political equilibrium rather than changing the political landscape. However, this ignores a number of ways in which the trajectory of today’s youngest cohorts may be different than their predecessors.
First, not all generations start out equally liberal and Democratic leaning in their youth. Notably, Millennials and Generation Z appear to be far more Democratic leaning than their predecessors were at the same age. Even if today’s youngest generations do grow more conservative as they age, it’s not at all clear they would end up as conservative as older generations are today.
Second, it’s clear that younger generations are on a different trajectory than older generations when it comes to some of those conservatizing life events such as home ownership, marriage, and raising children. All of those milestones are, on average, occurring later in life for these cohorts—if they are occurring at all. Hypothetically, this means that the conservatizing effect of aging apparent in some earlier generations may be muted. To date, this is consistent with the data we have. For example, there has not been a significant shift among Millennials, the oldest of whom are now in their late 30s.
Third, America’s youngest generations are more racially and ethnically diverse than older generations. This is important because it would appear that nonwhite Americans are somewhat less affected by cohort effects than white Americans. Thus, the kinds of changes and effects we are accustomed to talking about among generations that are overwhelmingly white may not apply cleanly to more racially and ethnically diverse generations.
In the case that any or all of these caveats are applicable—and only time will tell if they are—it suggests that the potential impact of generational change could be far greater than that assumed by the conventional “liberal when young, conservative when old” model of American political behavior. This means that the generational simulations in this report likely provide some very relevant insights into how the incentives of American politics could change as the generational landscape changes.
In this report, we show that incorporating generational cohorts into one’s analysis has a potentially substantial impact on the political landscape of future elections. We do this using four scenarios:
- No generational effects. This simulation assumes voting and turnout patterns from the 2016 presidential race remain the same in future elections for all demographic groups defined by race, age, education, gender and state. The only thing that changes is the size of these various groups among eligible voters. Such a scenario takes no account of the changing generational composition of the electorate and serves as a baseline for judging the impact of incorporating generational preferences.
- Full generational effects. This simulation assumes that generational political preferences will remain the same in future elections. Put simply, instead of assuming that younger voters vote exactly like older groups as they age, this scenario assumes that each generational cohort will continue to vote in future elections like they did in the 2016 presidential election. Like the first scenario, this scenario also accounts for changes in the underlying composition of the electorate by race, education, gender, and state. Age-related turnout rates for various groups are held constant at the levels assumed in the age-based simulation.
Table 1
- Generation effects decline with age. This simulation assumes that generational political preferences will carry forward into future elections, as in the second simulation, but also assumes that generations will become more conservative as they age. Like the first two scenario, this scenario also accounts for changes in the underlying composition of the electorate and holds the age-related turnout rates of groups constant over time.
- Post-Millennial generations more conservative. This simulation assumes that generational political preferences will fully carry forward into future elections but assumes that Gen Z and the as-yet unnamed generation following them will be more conservative than the Millennial generation. As in our other scenarios, this scenario also accounts for changes in the underlying composition of electorate and holds the age-related turnout rates for various groups constant going forward into future elections.
There are two key findings from these scenarios.
First, the underlying demographic changes our country is likely to experience over the next several elections generally favor the Democratic party. The projected growth of groups by race, age, education, gender and state tends to be more robust among Democratic-leaning groups, creating a consistent and growing headwind for the Republican party. This will require the GOP to improve their performance among key demographic groups, election after election, just to keep their vote share competitive as illustrated by our first, age-based simulation that includes no generational effects. That simulation finds Michigan and Pennsylvania moving Democratic in 2020, with later elections in the 2020s adding Florida, Wisconsin, Georgia, and North Carolina to the Democratic column.
Second, incorporating generational cohorts into this analysis dramatically accelerates the rate at which America’s political terrain could potentially shift, as shown by our second, generation-based, scenario. That scenario finds Michigan, Pennsylvania, Wisconsin, Florida, and Arizona moving Democratic in 2020, with later elections in the decade adding Georgia, North Carolina, Texas, and Ohio to the Democratic tally.
Even under scenarios where cohorts grow more conservative as they age or younger generations are substantially more conservative, these changes are still far faster than with simulations that consider only age groups and ignore the way generational changes can reshape the electorate.
The States of Change project has always argued that demographic change is important for understanding the future of American politics. This year’s report shows that the potential influence of generational growth and decline needs to be integrated into that understanding.
About the project
The States of Change: Demographics and Democracy project is a collaboration supported by The William and Flora Hewlett Foundation and the Democracy Fund that brings together the Center for American Progress, the Bipartisan Policy Center, demographer William H. Frey of the Brookings Institution, and Rob Griffin of the Democracy Fund Voter Study Group. The views expressed in this and other States of Change reports are those of the authors and not the institutions sponsoring the project.
The project’s goals are:
- To document and analyze the challenges to democracy posed by the rapid demographic evolution from the 1970s to 2060
- To project the race-ethnic composition of every state to 2060, which has not been done in more than 20 years
- To promote a wide-ranging and bipartisan discussion of America’s demographic future and what it portends for the nation’s political parties and public policy.
This report explores how demographic changes could shape the next five presidential elections using national and state projections. The demographics we look at are race, age, education, gender, and generation, using a new set of projections for the nation and all 50 states. We focus on what those projections imply for the presidential elections between 2020 and 2036 under different assumptions about future turnout and voter preference patterns by these demographics, with a particularly close look at generational change.
Demographic changes
The national story
Over the last several decades, the United States has experienced a number of powerful demographic shifts. We have every reason to believe those changes will continue.
First, the eligible voter population—by which we mean American citizens who are 18 years of age and older—will continue to become more racially and ethnically diverse. Younger, incoming generations of Americans are more racially diverse than prior generations. As they come of voting age, they will slowly but surely alter the makeup of the electorate. Whites made up 69 percent of eligible voters in 2016—a figure expected to drop to 67 percent by 2020 and 59 percent by 2036. During this time period, the Hispanic population is expected to grow by 7 points—going from 12 percent in 2016 to 19 percent in 2036—while Asians and other racial groups grow by 3 points, or 7 percent to 9 percent. The share of eligible voters who are Black will be mostly stable at around 13 percent between 2016 and 2036.
Second, the eligible voter population is aging. Those 65 years old and older will make up a larger share of eligible voters—going from 21 percent in 2016 to 23 percent in 2020 and to 28 percent in 2036—while those ages 18 through 64 will shrink. While seniors will continue to be less racially diverse than younger age groups over this period, the share of seniors who are white will decline from 79 percent in 2016 to 70 percent in 2036.
Third, the electorate is becoming more educated. This change is particularly important among white voters, where the political and behavioral differences between those with and without college degrees tend to be largest. While whites without a college degree made up 46 percent of eligible voters in 2016, this group is expected to drop to 43 percent by 2020 and 34 percent by 2036.
Table 2
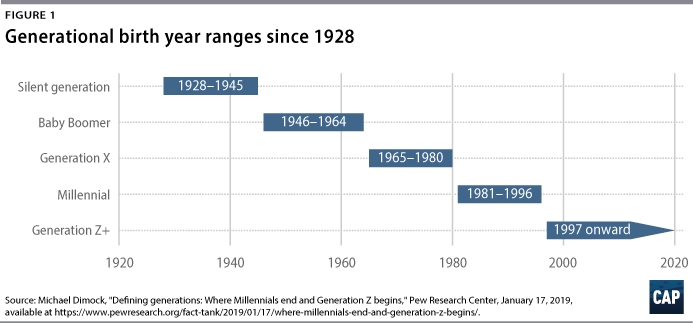
Finally, there are vast shifts in the generational composition of the country. The Baby Boomers—a generation that has constituted a larger share of the electorate than any other for more than 30 years—is about to be eclipsed by younger and more diverse cohorts of Americans. While it is already the case in 2020 that Millennials and Gen Z make up a larger share of eligible voters than Boomers (38 percent versus 28 percent), it is likely that, by 2024, these younger cohorts will also outnumber Boomers among voters.
By 2036, Millennials, Gen Z, and as-yet named generation that follows Gen Z will constitute 60 percent of the electorate. By that time, Boomers will be down to 17 percent of eligible voters and the Silent generation, already under 10 percent in 2020, will almost completely vanish.
Figure 2
The state-by-state story
Naturally, all of the demographic changes happening nationally must play out in the states as well. These changes are not evenly distributed geographically— some places are changing quickly and others much more slowly. Among the most prominent are racial and ethnic shifts as well as generational changes.
Substantial increases in racial and ethnic diversity can be highlighted by looking at those states where people of color currently constitute more than 40 percent of the eligible voters. In 2020, there should be seven states over this threshold: four states—Hawaii, New Mexico, California, and Texas—where communities of color are more than half of the eligible voter population as well as Nevada, Maryland, and Georgia, where those groups will make up between 40 percent and 50 percent. By 2036, 10 additional states should cross the 40 percent threshold: Arizona, Alaska, Delaware, Florida, Illinois, Louisiana, Mississippi, New Jersey, New York, and Virginia. In addition, communities of color should make up more half of eligible voters in three other states: Nevada, Maryland, and Georgia.
Figure 3
At the other end of the spectrum, the number of states where white voters exceed 80 percent of eligible voters is likely to be reduced from 19 states in 2020 to just 10 states in 2036. In 2036, the 10 still heavily white states should include the three upper New England states of Maine, Vermont, and New Hampshire; the Southern states of West Virginia and Kentucky; the Midwestern states of North Dakota, and Iowa; and the Western states of Montana, Idaho, and Wyoming. Notably, by 2036, the traditionally heavily white state of Utah should no longer be part of this group, as people of color will comprise 23 percent of its eligible voter population due to the projected growth of Hispanics, Asians, and other racial groups throughout the state.
In contrast to racial and ethnic change, generational change will be more evenly distributed across states. States today are more evenly matched in their generational composition than in their racial composition, and that will continue to be true in the future.
That said, there are still significant differences across states. Generally, slow-growing Northeastern and Midwest states currently having the lowest levels of Millennial and Gen Z eligible voters and the highest levels of Baby Boomer and Silent Generation eligible voters. Conversely, faster-growing Sunbelt and western states tend to have the highest levels of Millennial and Gen Z eligible voters and the lowest levels of Boomer and Silent eligible voters. One notable exception is Florida, whose generational composition is more similar to Northeastern and Midwestern states.
This pattern will look roughly similar by 2036. There will naturally be substantial increases in the share of eligible voters who represent America’s youngest cohorts and decline among older generations. Still, these changes will preserve the regional patterns just noted in generational composition.
For example, in Michigan, the number of eligible voters belonging to the Millennial and Gen Z+ generations will go from 36 percent in 2020 to 59 percent by 2036. Meanwhile, the Boomer/Silent contingent will decline from 40 percent in 2020 to 20 percent in 2036. In Texas, currently higher levels of Millennial/Gen Z+ and lower levels of Boomer/Silent voters will see similar changes over the time period. Millennial/Gen Z+ eligible voters will rise from 42 percent to 64 percent and Boomer/Silents will decline from 33 percent to 16 percent.
Figure 4
Electoral simulations
To assess how these change might influence future elections, we have performed four different electoral simulations. Each has two shared assumptions. First, that the nation’s underlying eligible voter population will change in accordance with our projections. For every state, we produce estimates for how the race, age, gender, education, and generational composition of eligible voters will change. Second, these simulations assume that the age-related turnout rates observed in the 2016 presidential race for each of those small demographic groups—say, Black, noncollege Pennsylvanian women between the ages of 30 and 44—will remain constant going forward into the future.
The simulations only differ in the assumptions they make about how generational change may—or may not—affect demographic groups’ political preferences. For example, the rate at which they support a Democratic or Republican candidate for president.
However, it is worth considering the value of these exercises and what can reasonably be learned from them. These are simulations—not predictions. When talking about results under a given set of assumptions, we are not expressing the belief that this is what will happen in a given presidential election. At heart, these are thought experiments—revealing the potential influence of some underlying factors that will affect the political terrain in future presidential races.
Notably, the assumptions in these simulations will almost certainly be wrong in ways both big and small. While the expectations we have about the underlying race, age, gender, education, and generational makeup of the electorate are probably the soundest of our assumptions, those pertaining to voter behavior are more likely to stray from reality. This is not a problem unique to this endeavor—the future itself is inherently uncertain—but it is one worth keeping in mind. As such, the results presented here are best thought of as baselines for imagining the future rather than anything approaching an ironclad prediction.
With these caveats in mind, this report investigates four scenarios to see how the electoral future might be shaped by different assumptions about the role of generation.
Table 3: Underlying assumptions of four generational scenarios
Results
All four simulations suggest a future electoral landscape that is more favorable to the Democratic Party. Under those assumptions, demographic change, especially by generation, creates a consistent and large headwind for the Republican party—shrinking the size of the groups that support them and increasing the size of those that oppose them. It does not mean that Republicans are doomed to lose but it does suggest that in the absence of substantial changes in the voting behavior of American demographic groups, the political terrain will continue to change in ways that make their success more difficult.
Figure 5 below summarizes the results of these simulations, presenting both the national population vote margin and the electoral college vote margin. In the sections below, we walk through those simulations in detail.
Figure 5
Simulation 1: No generational preferences
In 2016, Hilary Clinton won 48.2 percent of the vote nationally while Trump won 46.1 percent—a net margin of 2.1 for the Democratic candidate. Using the support and turnout rates from the 2016 presidential election, we find that a Democratic candidate’s popular vote margin in 2020 would rise from 2.1 points to 3.5 points. Going out further, the Democratic margin increases every election cycle by a little over 1 point, resulting in a 7.9 point margin by 2036.
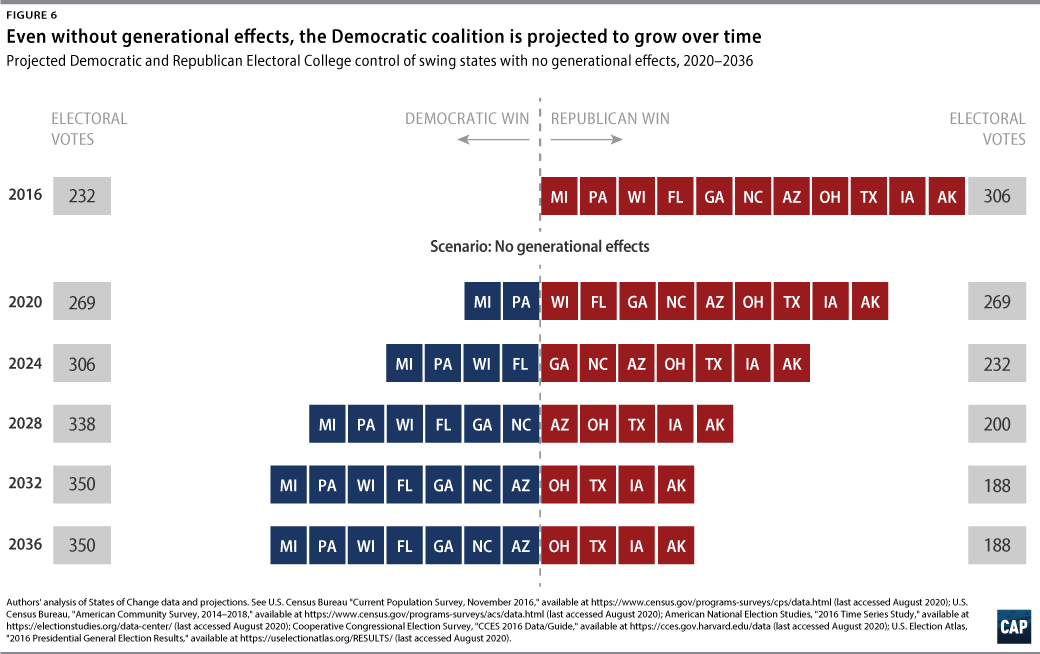
The primary reason for the projected rise in the Democratic popular vote margin is that the underlying racial and education composition of the electorate has undergone significant change between 2016 and 2020. Specifically, there has been a decline in the share of eligible voters who are white noncollege and a rise in the share of eligible voters who are nonwhite and white college graduates. These changes are projected to continue throughout the 2020s and into the 2030s. Since white noncollege voters are strongly Republican while nonwhites are even more strongly Democratic and white college voters now lean Democratic, these demographic shifts create a more favorable electoral environment for a Democratic candidate.
Figure 7
However, elections are not determined by the popular vote. Victory relies on candidate’s ability to navigate the Electoral College. Using the support and turnout rates from the 2016 presidential election, we find that a Republican candidate would lose Michigan and Pennsylvania in 2020 but just barely take Wisconsin, resulting in a dead heat of 269-269 in the Electoral College (allocating congressional district-specific votes in Maine and Nebraska to the respective winners of those states).
But going out further, Florida and Wisconsin are added to the Democratic column by 2024; Georgia and North Carolina by 2028; and Arizona by 2032. Although it doesn’t flip, a Republican candidate would win Texas by less than one point in 2036 under the assumptions of this simulation. Thus, even in a scenario where generational preferences do not count, the electoral college quickly becomes more difficult terrain for a Republican candidate.
Simulation 2: Full generational effects
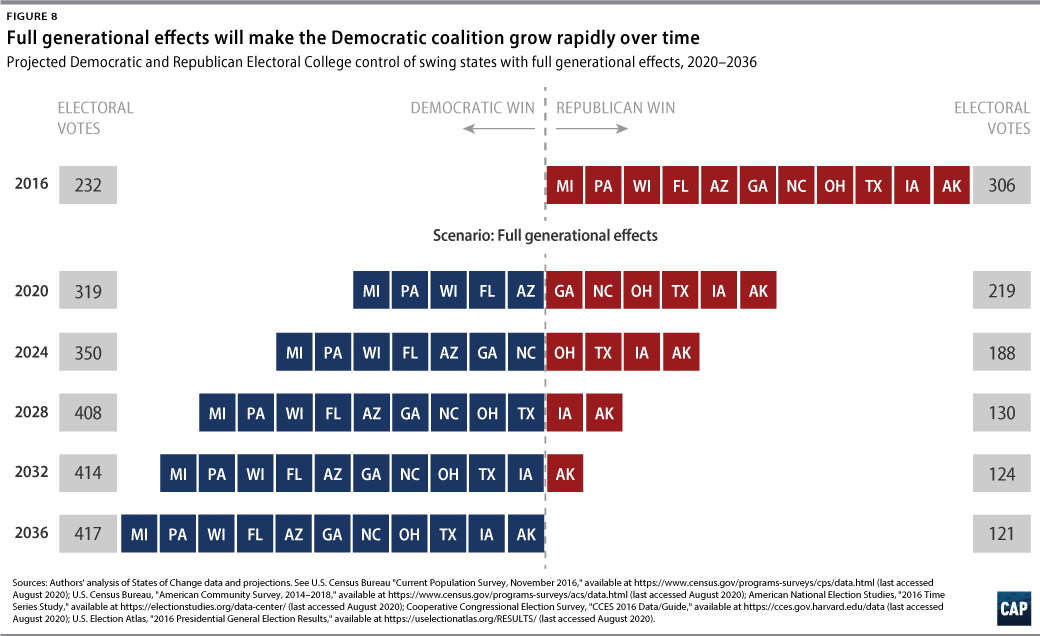
The U.S. electorate is not just changing by race and education but also by generation. In this simulation, we assume that the turnout rates of different race, education, gender, and age groups within states hold steady at the levels observed in the 2016 presidential election. We make a similar assumption about political preferences, but they are held steady among different race, education, gender, and generation groups within states. Only the underlying composition of the eligible electorate changes, with different groups growing and shrinking in size over time.
The result is striking. While the no generational effects simulation anticipates that the Democratic win margin in the national popular vote would shift from 2.1 points in 2016 to 3.5 points in 2020, this generational simulation forecasts a 5.7-point margin in 2020. Going out further, the Democratic margin increases every election cycle by about 3 points, resulting in an 18.3-point margin by 2036.
These results illustrate the incredibly powerful effects that generational change could have under the assumption that generations hold their political preferences as they age. This is because generational change is so large and today’s youngest generations are so much more Democratic-leaning than older generations within any given demographic.
As these younger generations age—making up a larger share of voters as their turnout increases and older generations decline in size—they work to reshape the American political landscape. This contrasts with the first scenario where the political preferences of different age groups were assumed to be relatively stable and only subject to change because of shifts in their racial, educational, and gender compositions over time.
The 30- to 44-year-old age group in the first no generational effects scenario starts out at +16 Democratic in 2020, rising very gradually to +20 Democratic in 2036. But in the full generational effects scenario, that same group starts out at +20 Democratic in 2020 and shifts to +35 Democratic by 2036. Similarly, in the higher turnout 45- to 64-year-old group, the no generational effects simulation starts at +3 Republican in 2020 and moves to just +3 Democratic by 2036. But in the full generational effects simulation, this age group goes from dead even in 2020 to +18 Democratic in 2036.
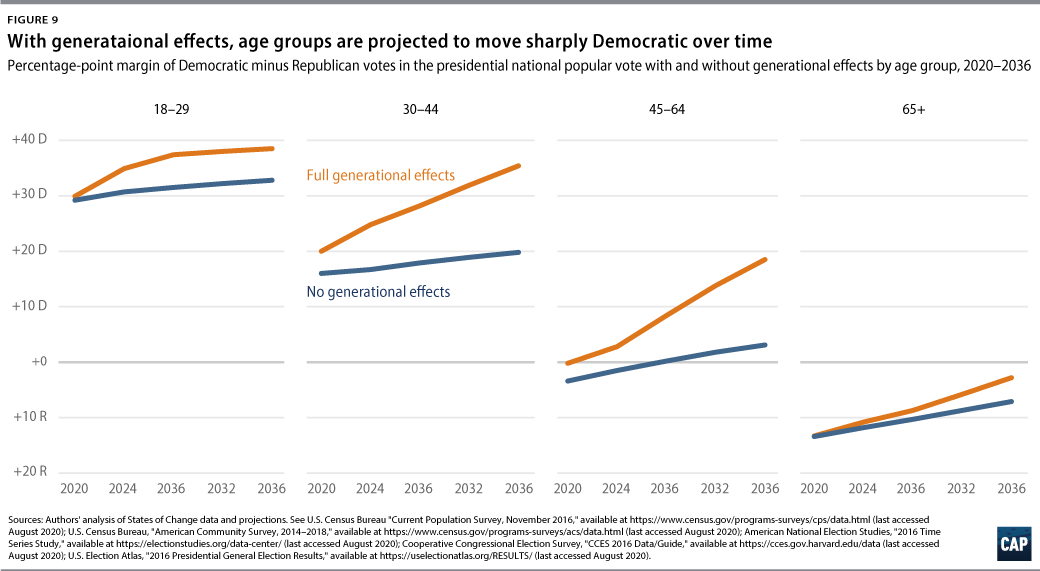
Powerful generational effects can also be seen by looking at white voters, who are at +14 Republican in 2020 but at only +3 Republican in this simulation by 2036. But in our first scenario, where there are no generational effects, white voters barely budge over the time period, starting at +17 Republican in 2020 and winding up at +16 Republican in 2036.
Given these dramatic effects of incorporating stable generational preferences, it is not surprising that the simulation projects a very substantial reordering of the Electoral College. Under these assumptions, we find that a Democratic candidate in 2020 would win 319-219 in the Electoral College by flipping not only Michigan, Pennsylvania, and Wisconsin—the states that President Donald Trump won so narrowly in 2016—but also Florida and Arizona.
Going out further, Georgia and North Carolina are added to the Democratic column by 2024 (making the electoral vote split 350-188); Ohio and Texas by 2028 (408-130); Iowa in 2032 (414-124); and the previously red state of Alaska in 2036 (417-121).
Simulation 3: Generational effects decline with age
Our third simulation modifies the full generational effects scenario to allow for the possibility that generations may become more conservative over the course of the life cycle. In this scenario, generations start in different places in terms of their political preferences but they undergo a similar conservatizing process as they age. Specifically, we assume all generations grow more conservative at a rate of a 1.2 percentage-point Republican margin swing per presidential election cycle. That is, +0.6 points Republican and minus 0.6 points Democratic.2
This scenario produces results intermediate between the first two scenarios, forecasting a 4.6-point Democratic popular vote margin in 2020. Going out further, the Democratic margin increases every election cycle by about 2 points, resulting in a 13.3-point margin by 2036.
Even with a conservatizing trend built in, generational change still exerts a powerful force on electoral results going forward. And, as in the full generational effects scenario, we can see generational effects at play in how age groups move Democratic by substantial margins over time. The 30- to 44-year-old group moves from +19 Democratic in 2020 to +32 Democratic in 2036, while the 45- to 64-year-old group starts at +1 Republican in 2020 and winds up at +12 Democratic in 2036.
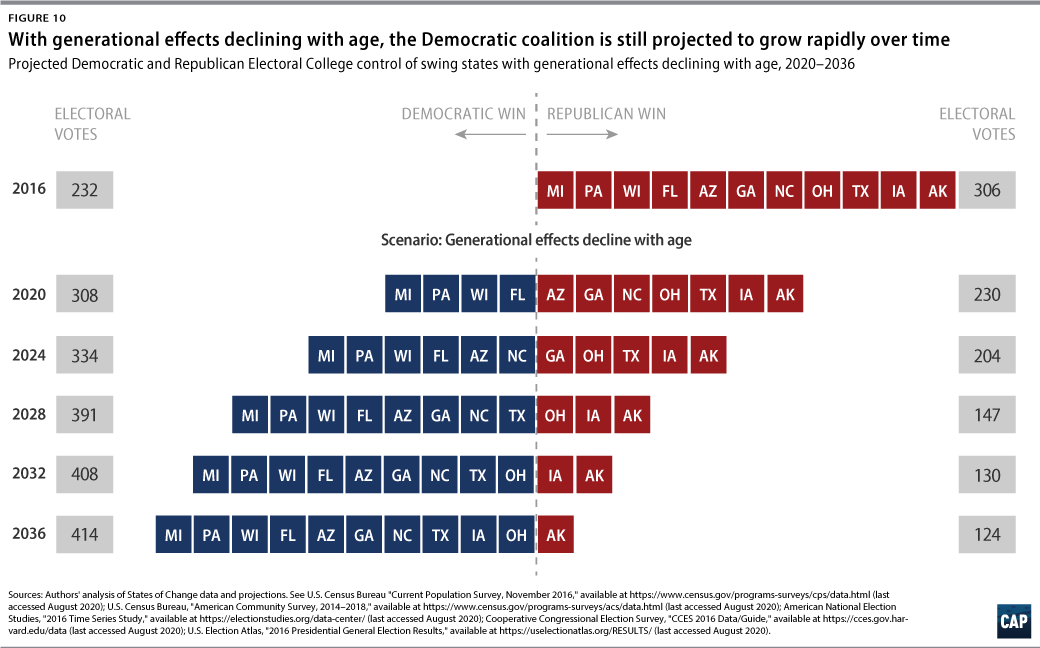
Under these assumptions, we find that a Democratic candidate would win 308-230 in the Electoral College in 2020 by flipping Michigan, Pennsylvania, Wisconsin, and Florida. In later elections, we continue to see states added to the Democratic column, including Arizona and North Carolina by 2024 (making the electoral vote split 334-204); Georgia and Texas by 2028 (391-147); Ohio in 2032 (408-130); and Iowa in 2036 (414-124).
Simulation 4: Post-Millennial generations more conservative
Our fourth simulation considers the possibility that newer generations not yet fully in the electorate may not be as pro-Democratic as the Millennial generation. Specially, we assume that Gen Z members (and the as-yet unnamed generation behind them) will exhibit greater Republican preferences than the Millennials. In this scenario we set that difference to be +10 points Republican and -10 points Democratic.
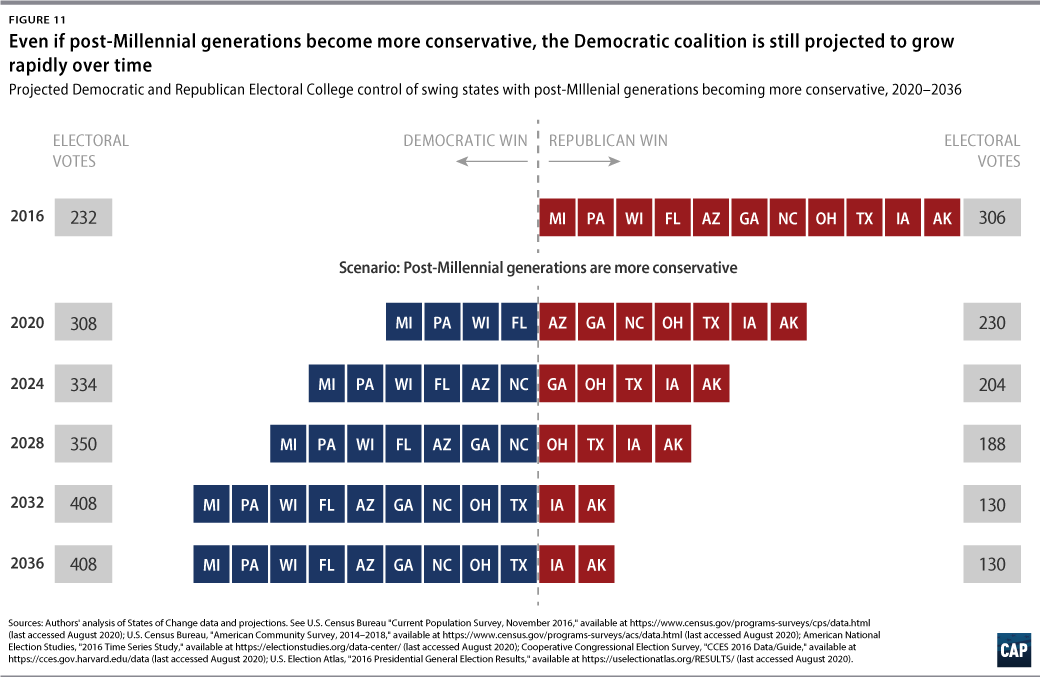
This scenario also produces results intermediate between the first two simulations but quite close to the third simulation. This generational simulation would forecast a 4.2-point margin in 2020. Going out further, the Democratic margin increases every election cycle by about 2 points, resulting in a 12.5-point margin by 2036.
Here, too, we see age groups moving Democratic over time through generational change but with an interesting difference. The 30- to 44-year-old group in this scenario barely moves over the time period, going from +20 Democratic in 2020 to +22 Democratic in 2036. This reflects the assumption about more conservative post-Millennial generations. But the 45- to 64-year-old group still evolves rapidly from even in 2020 to +18 Democratic in 2036. Similarly, the 65 and older group starts at +13 Republican in 2020 and ends at just +3 Republican in 2036.
Under these assumptions, we find that a Democratic candidate would win 308-230 in the Electoral College in 2020 by flipping Michigan, Pennsylvania, Wisconsin and Florida. In later elections, we continue to see states added to the Democratic column, including Arizona and North Carolina in 2024 (334-204); Georgia in 2028 (350-188); and Texas and Ohio in 2032 (408-130).
Conclusion
In our earlier report from 2018, we found that demographic change—even without generational effects taken into account—had the potential to reshape the political landscape in favor of Democratic candidates. We also found that strong movement toward Republicans among white noncollege voters—their strongest, albeit declining, demographic group—could potentially counter these underlying changes.
In this report, we have calculated the potentially game-changing effects of generational change in the electorate. Generational change—working in tandem with other underlying changes by race and education—has the potential to create much stronger headwinds for future GOP candidates than we have found previously.
This is not to say that Republican candidates cannot win in the future. As we have repeatedly emphasized, the estimates presented here are simulations that explore very specific ideas about how the electorate might evolve. We generate them not to predict the future but rather to estimate the potential impact of underlying demographic changes in shaping election outcomes.
But, while none of the estimates presented here are predictions in the conventional sense, they are suggestive of the kinds of advantages and disadvantages parties might face in the not too distant future. For Democrats, they tell us that their ability to shore up and hold onto America’s youngest cohorts may well pay substantial dividends, adding to their potential advantage from other demographic changes.
For Republicans, they tell us that any plan for future success almost certainly must include capturing a higher percentage of voters from America’s youngest generations. Even under scenarios where these generations grow more conservative as they age, the current political disposition of these groups is so lopsided toward the Democratic party that the party would not be wise to rely solely on the conservatizing effects of age.
Thus, while demographics are not destiny, it is fair to say that demographic, especially generational, change is likely to have profound effects on the competition between the parties in this decade and beyond. We cannot say which party will best handle these changes, only that they will have to do so.
About the authors
Robert Griffin is the research director of the Democracy Fund Voter Study Group, focusing on demographic change, public opinion, and American political behavior. He also serves on the editorial committee of PS: Political Science and Politics, the journal of record for the American Political Science Association. He has taught courses on research methodology, statistics, public opinion, and political advocacy for The George Washington University, Pennsylvania State University, and Loyola University Chicago.
Ruy Teixeira specializes in the study of demographic change, voting behavior, and public opinion. He is a senior fellow at the Center for American Progress and co-director of its Politics and Elections program. He is also a co-director of the States of Change project. His latest book is The Optimistic Leftist: Why the 21st Century Will Be Better Than You Think. His other books include The Disappearing American Voter; America’s Forgotten Majority: Why the White Working Class Still Matters; The Emerging Democratic Majority; and Red, Blue, and Purple America: The Future of Election Demographics.
William H. Frey is an internationally regarded demographer, known for his research on urban populations, migration, immigration, race, aging, and political demographics, as well as his expertise on the U.S. census. He is a senior fellow at the Brookings Institution, a research professor in population studies at the University of Michigan, and a co-director of the States of Change project. His most recent book is Diversity Explosion: How New Racial Demographics are Remaking America.
Methodological appendix
Eligible voter projections
The eligibility rates for the different populations presented in this report are projections. The first step in this process was taking data from multiple years of the American Community Survey (ACS) and dividing up the American population into groups based on state, race, age, and gender —for example, Hispanic men ages 30 to 34 in Colorado. Multilevel statistical models were then used to estimate the unique eligibility rates—the rate of citizenship among a given group—and naturalization rates—the rate at which these groups gained citizenship over time—for each state, race, and age group. These groups were then tracked forward in time and had those unique naturalization rates applied to them as they moved into older age groups. Additionally, these estimates account for the influx of migrants and immigrants into each state, race, gender, and age group and the effect it has on those groups’ overall eligibility rates. The rates of eligibility for those migrant and immigrant group was based on a similar multilevel modeling process. The end result is a procedure that is sensitive to the different rates of naturalization experienced by each of these groups, as well as the migration and immigration rates each state is predicted to experience in the future.
From there, the educational attainment of these eligible voter groups is projected in a similar fashion. Data was taken from multiple years of the ACS—2014 to 2018—and then the U.S. population was divided up into groups based on state, race, age, and gender. We then used multilevel statistical models to estimate the unique education rates (the rate of college education among a given group) and attainment rates (the rate at which these groups gained education over time) for each state, race, and age group. Using the eligible voter projections as a baseline, these groups were then tracked forward in time and had those unique attainment rates applied to them as they moved into older age groups. Additionally, our estimates account for the influx of migrants and immigrants into each state, race, gender, and age group as well as the effect it has on those groups’ overall education level. The rates of education for those migrant and immigrant group was based on a similar multilevel modeling process. Note, however, that we assume that entering cohorts (i.e., individuals younger than 18) will complete college educations at the same rate as the most recent cohorts completed them—an assumption that may bias our overall change results downward, since that assumption does not correspond to recent trends.
The end result of the process employed in this paper is eligible voter composition projections—by state, race, age, gender and education—that are sensitive to the changing demographics of the country as well as the changes in eligibility and education that might occur due to group-specific increases changes over time, immigration rates, and migration rates. These groups—which, along age lines, exist as 5-year groupings at the lowest level—are then divided on a yearly basis to simulate the size and composition of different generational cohorts which are used throughout the report.
Turnout and support estimates
For this project, we developed original turnout and support estimates by combining a variety of data sources. We did this in order to deal with what we believe are systematic problems with some of the most widely available and widely cited data about elections.
One of the underappreciated problems in the world of election analysis is that some of the most reliable sources of data available on demographics, turnout, and support do not play very well together. For example, if we combine some of the best data we have on demographics with the best data we have on turnout, we find that they vary from the actual levels of turnout observed on Election Day. Furthermore, if we combine those data with the best data we have on vote choice, we get election results that do not line up with reality. This is not due to any one source of information being particularly biased; rather, each has points of weakness.
Our goal was to do better. To deal with these issues we had three guiding principles:
- Incorporate as much information from as many sources as possible
- Lean on the strengths of individual data sources while accounting for their weaknesses
- Make sure that our results matched up with election results from the real world
For our analysis, we broke the U.S. population down to the county level into 64 demographic groups: four racial categories—white, Black, Latino, and Asian and other races; four age groups—18 through 29, 30 through 44, 45 through 64, and 65 and older; two education groups—people with a four-year college degree and people without a four-year college degree; and two genders—men and women. The product of this analysis is the following for each of those 64 groups:
- County-level estimates of EV composition
- County-level turnout estimates
- County-level estimates of voter composition
- County-level party support estimates
These estimates are fully integrated with one another and, when combined, recreate the election results observed in 2016. Below is a more detailed description of how each was created.
County-level eligible voter composition
We started off our process by collecting detailed demographic data at the county level from the U.S. Census Bureau’s ACS. The goal of this process was to produce reasonable estimates about the composition of EVs within a given county. Specifically, we wanted to know how many EVs in each county fell into each of our 64 demographic groups.
Here we ran into our first problem: Data this detailed aren’t available at the county level. For example, data on the race and age distribution as well as data on the age and education level distribution within a county are available separately. However, there aren’t data available on the race-, age-, gender- and education-level distribution.
To overcome this problem, we employed a two-stage estimation process. First, we collected these disparate pieces of data on race, age, gender, education level, and citizenship from the 2018 five-year ACS. We then used iterative proportional fitting (IPF) to make these various pieces of data that are available line up with one another. IPF is a form of adjustment that allowed us to make individual group counts—for example, the number of EVs in a county who are Black women, ages 18 through 29 and have a college degree—line up with known population margins, such as the number of EVs who are Black and have a college degree; the number of EVs who are ages 18 through 29 and have a college degree; and the number of EVs who are Black and ages 18 through 29.
At this point in the process, we have estimates on the EV composition of each county, but there were several notable problems. First, the use of the five-year ACS was necessary in order to obtain estimates for every county in the United States, but it provides a somewhat blurry image of the year in question. Data from the 2018 five-year ACS are an amalgamation of data from 2014 through 2018. In short, the ACS provides the necessary coverage but at the expense of giving us an accurate picture of the population as it existed in 2016
Second, the IPF process tends to spread certain characteristics—say, citizenship—somewhat indiscriminately across groups so long as the totals line up with other margins. This is particularly problematic for something like education groups where—outside of the non-Hispanic white population—we see different rates of citizenship.
Third, the IPF process inevitably generates estimates that are logically consistent within a county given the margins that have been provided but does not collectively add up to the number of people one can expect to belong to a given group in a state as a whole.
To address all three problems, we included an additional corrective step. Using the individual-level data from the 2016 one-year ACS, we estimate the real state-level race, age, gender, and education level composition of eligible voters. Logically, the numbers of eligible voters who fall into our 64 groups in the counties must add up to the number observed at the state level. We once again employed IPF to make the frequencies in the counties collectively line up with the frequencies at the state level. These were used as our final estimates for EV composition in each county.
County-level turnout rates
The process of creating county-level 2016 turnout rates for each of our 64 demographic groups began by generating state-level estimates for these groups. Using data from the 2016 November Supplement of the Current Population Survey (CPS), we ran cross-nested multilevel models that estimated the turnout rate for each state, race, age, gender, and education level group represented in the data. Many of these groups can be very small, but this approach provides more realistic starting estimates of turnout for low-sample populations by partially pooling data across individuals’ geographic and demographic characteristics.
We then fed those state-level turnout estimates into the eligible voter counts we generated in the previous step. This provided us with an initial estimate of how many people turned out to vote in a particular county in each year. At this point the difficulties we previously described became apparent: The estimated number of voters from a given county will inevitably deviate from the real number who voted. Once again, we employed IPF at the county level to force these counts to match up with one another, increasing or decreasing the turnout rates for our 64 groups until the two aggregate vote counts aligned.
That said, it is worth discussing how we use and think about these estimates. While we did generate county-level turnout rates that accurately recreate the aggregate turnout numbers observed in each county, there’s good reason to believe that they contain error. Instead of treating the numbers as completely accurate, we view this process as something that helps us generate more precise state-level estimates.
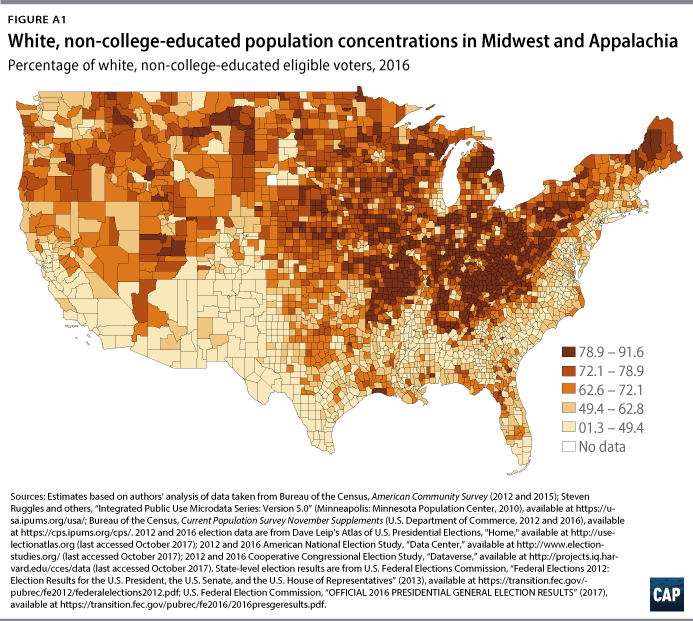
This process takes advantage of geographic segregation at the county level to selectively adjust turnout rates between demographic groups rather than applying a blanket correction at the state level. Looking at Figure A1—which shows the share of EVs in each county who are white and do not have a college degree—we can see that there are some places where more than 80 percent of the population falls into that demographic category. To the extent that our 64 demographic groups are nonrandomly distributed across a state, this process will selectively push and pull their turnout rates. While the estimates within any given place may be off, we believe this discriminatory adjustment provides a better state-level picture.
These county rates are aggregated to the state level and applied to the demographic projections for each scenario. In contrast to the generational support levels described in the next section, all the estimates of turnout in this report are based on a group’s age-composition. So, for example, let’s consider a given demographic group—say, Black men in Pennsylvania with college degrees who belong to the Baby Boomer generation. In 2016, this youngest member of this group would have been 52 while the oldest was 70. As such, this group straddles both the 45 to 64 and 65 and older age groups. The overall turnout of this generation would be calculated by taking the two distinct turnout rates of Black men in Pennsylvania with college degrees belonging to those age groups, calculating the percent of this group that fell into those two age groups, and applying those turnout rates to those two groups.
County-level party support estimates
The process of creating county-level 2016 Democratic and Republican support rates began by generating state-level party support estimates for each state, race, generation, gender, and education group—with generational groupings limited to the Millennial, Gen X, Boomer, and Silent cohorts. Using publicly available data from the American National Election Studies and the Cooperative Congressional Election Study in 2016, as well as one of the postelection surveys from 2016 by Center for American Progress, we ran cross-nested multilevel models that estimate the party support rates for each state, race, generation, gender, and education group represented in the data. Many of these groups can be very small, but this approach provides more realistic starting estimates of party support for low-sample populations by partially pooling data across individuals’ geographic and demographic characteristics.
We then fed those state-level support estimates into the voter counts we generated in the previous step. This provided us with an initial estimate of how many people voted Democratic, Republican, and third party in a particular county in each year. Once again, the difficulties we described above became apparent—the estimated number of Democratic, Republican, and third-party votes from a given county will inevitably deviate from the real election results. We employed IPF at the county level to force these counts to match up with one another, increasing or decreasing the support rates for our demographic groups until the aggregate vote counts aligned.
That said, it is worth discussing how we use and think about these estimates. While we did generate county-level support rates that accurately recreate the aggregate election results observed in each county, there is good reason to believe that they contain error. Instead of treating the numbers as completely accurate, we view this process as something that helps us generate more precise state-level estimates than previous methodologies.
We see the strengths and weaknesses of this process in the same light as we previously described in the turnout explanation above. Geographic segregation at the county level lets us selectively push and pull the support rates of our groups around rather than applying a blanket correction at a higher geographic level. The estimates within any given place may be off, but we believe this discriminatory adjustment provides a better state-level picture.
These county rates are aggregated to the state level and applied to the demographic projections for each scenario.
However, this process notably leaves out the country’s youngest generation—Gen Z (as well as the as-yet unnamed generation that will follow it into the electorate). While technically part of the electorate in 2016, this group was far too small to feel confident about the Democratic and Republican support rate estimates that we generated in the process described about. To generate estimates for this generation, we used two pieces of information: 1) The estimates generated for various demographic groupings of Millennials and 2) The difference in partisan lean estimated from the Democracy Fund and UCLA Nationscape survey.
Nationscape is a large weekly survey that has interviews more than 6,000 US residents every week since July 2019. Though the portion of Gen Z that is eligible to vote is still quite small, the size of this survey provides us with tens of thousands of interviews with this small cohort.
Using that data, we employ multilevel models to estimate the partisan lean—i.e. the percent of each generation that identifies as Democratic or leans towards the Democratic party minus the percent that identifies as Republican or leans towards the Republican party—of both Millennial and Gen Z respondents belonging to different racial and gender groups. The difference in partisan lean between Millennials and Gen Z was then applied to the relevant subgroup within each generation.
Put more simply: We used the original estimates for Millennials generated by the process described about and then used Nationscape as a bridge for understanding the relative political differences between the two generations.
Table A-1
Acknowledgments
We would like to thank the William and Flora Hewlett Foundation and The Democracy Fund for their generous support of this project and our board of advisers for helping shape the direction and output of the project. We would also like to acknowledge some of the numerous people who helped us conduct this research and produce this report. Special thanks to Cathy Sun of the University of Michigan Population Studies Center for programming the new projections presented in this report. Will Beaudouin, Shanee Simhoni, Bill Rapp, Chester Hawkins, and the entire CAP Art and Editorial team did a stellar job with report production. Claudia Montecinos of CAP, Alejandro Marquez of the Bipartisan Policy Center, and David Lanham of Brookings helped with publicity.