


Ideology, Valence and the Electoral Failures of Centrist Parties
In recent years centrist-liberal parties, such as the German Free Democratic Party (FDP) in 2013 and the British Liberal Democrats in 2015 and 2017, suffered enormous electoral defeats. These defeats highlight a prominent puzzle in the study of party competition and voting behavior, namely the empty center phenomenon. Empirical evidence suggests that most parties do not converge to the median voter's position, despite the centripetal force of the voters’ preference distribution and the predictions of formal models (for example Adams, Merrill, and Grofman Reference Adams, Merrill and Grofman2005; Iversen Reference Iversen1994). Since the seminal work of Downs (Reference Downs1957), extensive formal and empirical studies have tried to explain whether (or when) parties converge toward the median voter's position. In two-party competition the formal result suggests that vote-seeking parties indeed converge to the median voter (see Banks, Duggan, and Le Breton Reference Banks, Duggan and Le Breton2002; Banks and Duggan Reference Banks, Duggan, Austen-Smith and Duggan2005; Calvert Reference Calvert1985), while a variety of spatial models have reached similar conclusions for multi-party competition (Adams Reference Adams1999; Adams and Merrill Reference Adams and Merrill2006; Hinich Reference Hinich1977; Lin, Enelow and Dorussen Reference Lin, Enelow and Dorussen1999; but see a review of non-convergence outcomes in Adams Reference Adams2018; Grofman Reference Grofman2004).
These formal results seem to contradict the empirical reality of parties’ off-center positions in most West European countries (Adams and Somer-Topcu Reference Adams and Somer-Topcu2009; Budge and Laver Reference Budge and Laver1992; Budge, Robertson, and Hearl Reference Budge, Robertson and Hearl1987). Moreover, European parties diverge from the center despite the centrally dense voter distributions. For example, Adams and Somer-Topcu (Reference Adams and Somer-Topcu2009) show that in twenty-five post-war democracies, the distribution of voters’ self-placements is unimodal, fairly symmetrical and concentrated around the center of the scale. These distributions imply that we should expect vote-maximizing parties to converge toward the center, yet most of them do not. The lack of congruence between voters’ demands for centrist ideologies and the supply of non-centrist policies that political parties offer has been characterized as a major problem for democratic representation (Adams, Merrill, and Grofman Reference Adams, Merrill and Grofman2005; Bølstad and Dinas Reference Bølstad and Dinas2017; Iversen Reference Iversen1994; Kedar Reference Kedar2005; among many others).
While most of the literature focuses on the causes for parties’ radicalism relative to the center of voters’ preferences (Adams, Merrill, and Grofman Reference Adams, Merrill and Grofman2005; Kedar Reference Kedar2005; Macdonald, Rabinowitz, and Listhaug Reference Macdonald, Rabinowitz and Listhaug2007; Matthews Reference Matthews1979; Merrill and Grofman Reference Merrill and Grofman1999; Rabinowitz and Macdonald Reference Rabinowitz and Macdonald1989), Adams and Merrill (Reference Adams and Merrill2006) and Hazan (Reference Hazan1995, Reference Hazan1997) examine centrist parties. Hazan explains party system polarization and democratic consolidation as a function of centrist parties’ electoral success. Yet, he concluded that ‘the impact of the center is indeed an enigma’ (Hazan Reference Hazan1995, 441). Thus, the current literature stops at the point of offering explanations for vote-seeking parties’ divergence from the center, without accounting for the electoral outcomes of parties that take centrist positions.
This article argues and empirically shows that large parties’ divergence from the center of the voter distribution is not a major problem for democracy because voters are offered, and often consciously reject, more centrist alternatives. The announced policy positions of centrist parties are the closest to the preferred positions of a large segment of the electorate, but few of these parties are electorally successful. Therefore, we should pay special attention to the electoral outcomes of parties that take centrist Left-Right positions.
To reach this positive conclusion about democracy, I develop a four-stage argument. First, I present theoretical arguments and empirical analyses to show that centrist parties are near their vote-maximizing positions, hence changes in their electoral success from one election to the next must primarily reflect non-positional factors. I show that the deterioration of centrist parties’ valence images, conceived in terms of their non-policy attributes including their images for competence, integrity and leadership ability, leads to a collapse of their vote shares. Specifically, I examine the collapse of the German Free Democratic Party (FDP) in 2013, the British Liberal Democrats in 2015, the Finnish Center Party (KESK) in 2011 and the Canadian Liberal party in 2011.
Second, I present theoretical and empirical analyses to show that non-centrist parties are often not located near their vote-maximizing positions. That is, in recent years parties such as British Labour and the German SPD took positions that are well to the left of their vote-maximizing positions, and the same is true for parties such as the British Conservatives and German CDU on the right.
Third, I demonstrate that centrist parties cannot – while non-centrist parties can – use spatial strategies to compensate for their valence declines. This is due to two strategic disadvantages that centrist parties confront: (a) when a party is located between two parties, gaining votes by moving in one direction entails losing votes on the other side, and (b) because of the similar concentration of voters to the left and the right of the centrist party's position, the vote share lost to one side is often comparable to the vote share gained on the other side.Footnote 1 By contrast, I show that centrist parties can substantially increase their vote shares by improving their valence images. I conclude that for centrist parties, realistic changes in valence, but not policy, determine changes in vote shares.
Fourth, my findings have important implications for parties’ campaign strategies, because there are many examples of parties sharply changing their perceived positions (such as Labour under Tony Blair, the Conservatives under Margaret Thatcher and the German Social Democrats under Gerhard Schroeder). These parties were able to capitalize on their leader's valence image to shift their positions without electoral punishment. Changing positions to compensate for valence declines is a realistic, viable strategy for non-centrist parties, but my findings imply that this will not work for centrist parties. The results imply that centrist parties should not waste resources on changing their moderate positions but should instead focus on improving their valence images.
Lastly, this article illuminates political representation as the results imply that voter–party relations are rational. The political center is often perceived as empty not because parties misrepresent voters’ preferences, nor because voters are ‘fooled’ into voting for parties that misrepresent them, but because voters prefer voting for higher valence (but less spatially proximate) parties.
Valence as a Determinant of Centrist Parties’ Electoral Outcomes
Since Downs (Reference Downs1957), scholars have offered several explanations for the lack of association between voters’ preference and parties’ ideological positions. For example, Adams, Merrill, and Grofman (Reference Adams, Merrill and Grofman2005) argue that a combination of factors (such a partisanship and abstention from voting) allows parties to take positions that are away from the center, without compromising their vote shares. Specifically, they argue that parties’ vote-maximizing position is between the median voter and the positions of their core partisans. Other explanations for the empty center come from the ‘directional voting’ literature. With some variation in model specification, in this vein of the literature, voters prefer parties that move public policy toward their side of the issue (that is, voters with left-leaning preferences prefer parties on the left, and right-wing voters are biased toward right-wing parties). Also, as the voter holds more extreme positions on Left–Right ideology, the intensity of the views increases (see Macdonald, Rabinowitz, and Listhaug Reference Macdonald, Rabinowitz and Listhaug2007; Matthews Reference Matthews1979; Rabinowitz and Macdonald Reference Rabinowitz and Macdonald1989). A similar, but distinct argument is made by Bølstad and Dinas (Reference Bølstad and Dinas2017), who argue that in addition to proximity calculation, voters also use parties’ categories (whether the party is on their side of the Left–Right continuum).
Other non-policy considerations, such as party activists and financial resources, allow the parties to take off-center positions while still maximizing their vote share (for example, Schofield Reference Schofield2003; Schofield and Sened Reference Schofield and Sened2005). Parties and voters also consider future coalition bargaining positions when taking positions, and thus might announce positions that diverge from the median voter (Kedar Reference Kedar2005; Merrill and Grofman Reference Merrill and Grofman1999; Schofield and Sened Reference Schofield and Sened2006). Lastly, following Stokes (Reference Stokes1963), parties’ (non-centrist) policy positions are explained by voters’ non-policy considerations (for example, Clark Reference Clark2014). While there are ample theoretical and empirical explanations for the divergence of parties from the center, centrist parties are understudied (however, see Kirchner Reference Kirchner1988; Margulies Reference Margulies2015). Nagel and Wlezien (Reference Nagel and Wlezien2010) demonstrate that the vote share of the British Liberal Democrats is related to the ideological distance between the Conservatives on the right and Labour on the left. However, Margulies (Reference Margulies2015) does not find support for this argument in a comparative setting, both for centrist parties that take more neo-liberal economic positions and those supporting government intervention in the economy.
I argue that centrist parties’ positions are close to their vote-maximizing positions, and therefore changes in their popular support reflect changes in their valence images. Valence, as recently revisited in the literature, is defined as party (candidate) attributes that almost all voters approve such as competence, integrity, leadership ability and party unity. Valence is also related to other non-positional characteristics of the parties, such as their ability to run effective campaigns, recruit motivated activists or raise campaign contributions. Parties are differentiated by the degree to which voters perceive them as possessing these desirable attributes, which are not directly related to their policy positions. The difference between a valence issue and a policy position issue can be explained as follows – all voters prefer a ‘good’ economy over a ‘bad’ economy, thus the state of the economy is a valence issue. However, the mechanism to improve the economy (increase or decrease taxes) is a policy issue (Stokes Reference Stokes1963).
Current research provides empirical observations that bad valence image hurts parties’ electoral results. Abney et al. (Reference Abney, Adams, Clark, Easton, Ezrow, Kosmidis and Neundorf2013) find that valence influences West European parties’ support, predominantly before the election. Clark (Reference Clark2009, Reference Clark2013) and Clark and Leiter (Reference Clark and Leiter2014) find that negative valence-related media reports depress European parties’ vote shares. In the American context, incumbent vote shares have been shown to be related to their valence (Mondak Reference Mondak1995; Stone Reference Stone2017; Stone and Simas Reference Stone and Simas2010; Stone, Maisel, and Maestas Reference Stone, Maisel and Maestas2004, among others). In short, voting behavior is motivated, at least in part, by parties’ image of holding attributes such as competence, integrity and unity. Based on this research, I argue that one possible solution to the empty center puzzle is that centrist parties’ vote share is sensitive to the parties’ valence image. Voters, even those who are ideologically proximate to the centrist party, prefer a non-centrist party when the latter is perceived as more competent or unified. As the valence image of a centrist party decreases, the odds of voting for that party decrease as well. Moreover, the crucial effect of valence deterioration should be true both for parties that are generally understood as long-term high valence parties that experience a short-term deterioration of their valence image (the Liberal party in Canada 2011 or the Center Party in Finland 2011), and for parties that have been historically valence disadvantaged, but suffered additional valence deterioration in recent years, changing from unfavorable to catastrophic valence image (Liberal Democrats in the UK and FDP in Germany). A testable hypothesis in line with this argument is the valence deterioration hypothesis:
Hypothesis 1
Centrist parties’ vote share collapses when their valence image deteriorates, despite their popular Left–Right position.
Once their vote share collapses, what can centrist parties do? From a formal perspective, Adams and Merrill (Reference Adams and Merrill2009) and Schofield and Sened (Reference Schofield and Sened2005) model parties’ reaction to deteriorating exogenous valence image: While Schofield and Sened demonstrate that a vote-maximizing party should move toward a more extreme position, Adams and Merrill (Reference Adams and Merrill2009) show that a policy-seeking party should move toward the center. These contrary results hold under the specified conditions in each model, but in both studies the center is empty because the larger parties diverge as a function of their positive valence image.
Adams and Somer-Topcu (Reference Adams and Somer-Topcu2009) find that parties can increase their vote share by moderating their Left–Right position. Clark (Reference Clark2014) demonstrates that parties moderate their Left–Right position as their character-based valence attributes worsen. However, unlike extreme parties, centrist parties cannot compensate for a bad valence image by taking a different Left–Right position. As mentioned before, voters’ preference distribution is unimodal and peaks around the center. If voters are more concentrated around the center of the scale than at the extremes, and other parties are dispersed along the Left–Right continuum, the centrist party cannot improve its position by unilaterally moving to a radical position. Moreover, it can only modestly improve its vote share by taking a position somewhere between the major-Left and -Right parties and has no electoral incentive to leap-frog these parties. The exact vote-maximizing position depends on the specifics of the voter distribution and on rival parties’ positions.
To illustrate this point, consider a deterministic spatial model where all voters vote for the most spatially proximate party, with a normally distributed, unidimensional electorate with a median voter at 5 and a standard deviation of 2, and five parties distributed as follows: Far-Left party at 1, a Major-Left party at 4, a Centrist party at 5.2, a Major-Right party at 6 and a Far-Right party at 9. In this illustrative example, the Centrist party can only marginally increase its expected vote share, from 19.72 to 19.74 per cent, by shifting to its vote-maximizing position at 5.0. The Major-Right party, by contrast, can unilaterally move to its vote-maximizing position (just to the right of the Centrist party) to increase its expected vote share by over 5 per cent. Similarly, if the Major-Left party moderates its position all the way to the position just to the left of the Centrist party, its vote share is also expected to increase by over five percentage points. With some important caveats, this result should extend to a probabilistic spatial voting model in which voters’ party utilities include – in addition to spatial utility – an additional, unmeasured component that renders their decisions probabilistic from the parties’ perspectives.Footnote 2 Because centrist parties are already close to their vote-maximizing position, a further moderation of their Left–Right position will increase their vote share very little; while taking a more extreme Left–Right position will depress their vote share. Thus, I hypothesize that (inconsequential moderation hypothesis):
Hypothesis 2
Centrist parties cannot increase vote share as much as non-centrist parties can through policy moderation.
Note that both hypotheses were presented and confirmed by Zur (Reference Zur2017) for the case of the German FDP in the 2013 Bundestag election. Moving beyond the single party case allows this article to generalize Zur's findings. At the same time, the argument presented in this article is at odds with the findings of Clark and Leiter: ‘when parties are more ideologically distant from the mean Left–Right voter position, then voters weigh parties’ character-based valence attributes more heavily’ (Clark and Leiter Reference Clark and Leiter2014, 147). Simply put, while Clark and Leiter argue that valence-based voting is more consequential for extreme parties than for moderate ones, I argue that it is not the case when major-Left or -Right parties are distinguished from centrist parties.
The second hypothesis and the results presented below are related to the findings presented by Adams and Somer-Topcu (Reference Adams and Somer-Topcu2009) and Ezrow (Reference Ezrow2005). These authors find that most parties are modestly rewarded for moderate policy positions. Yet, these results might be driven to some extent by the lack of electoral rewards for centrist parties, and not by the electoral success of major-Right and -Left parties. That is, if centrist parties were treated as a different category of parties, the authors above might have found greater rewards for moderate policy positions.
It is important to note that both theoretical arguments presented above are conditioned on the distribution of voters’ preferences and the location of parties’ perceived policy positions. If the voter distribution is polarized or peaked closer to one of the extremes (similar to the case of the United States), centrist parties are not expected to be electorally successful. However, as both the data used in this article and previous research (such as Adams and Somer-Topcu Reference Adams and Somer-Topcu2009) have shown, the distribution of voters’ preference is indeed single-peaked around the middle of the Left-Right scale.Footnote 3
Even if the voter distribution is moderate and peaked around the center, centrist parties can be squeezed between their competitors on the Left and on the Right. Holding their valence image constant, taking distinct policy positions is crucial for parties’ electoral success (Spoon Reference Spoon2011; Zur Reference Zur2019a). The further apart the centrist party's competitors are, the larger the spatial interval in which the centrist party is expected to win votes. Thus, one alternative explanation for the collapse of centrist parties is that they were simply squeezed by other parties. Put differently, one reason for the electoral failures of centrist parties could be that non-centrist parties have spatial strategies to compensate for their valence declines by moving toward the center of the voter distribution.
It is important to note that there are examples of non-centrist parties changing their perceived positions (see Adams, de Vries, and Leiter Reference Adams, de Vries and Leiter2012; Adams, Green, and Milazzo Reference Adams, Green and Milazzo2012; Seeberg, Slothuus, and Stubager Reference Seeberg, Slothuus and Stubager2017), and such positional change might imply that centrist parties have been squeezed by larger parties on the Left and Right. However, according to the data analyzed in this article parties’ policy positions (as perceived by voters) have not changed enough to account for the large changes in centrist parties’ vote shares.
Varieties of Centrist Parties
This article examines the importance of valence in both Proportional Representation (PR) and in Single-Member District Plurality (SMDP) systems, with respect to both successful (large) and not-so-successful (small) centrist parties. By successful parties I mean parties that (on average) are not disadvantaged by their valence and are able to gain enough seats to serve as the Prime Minister's party. I focus on four political systems and their centrist party. The two SMDP systems are Canada and the UK, while the PR systems are Germany and Finland. In addition to the variation of electoral systems and long-term electoral success, the parties in this research vary in the pre-collapse role as incumbent parties (as the party of the Prime Minister or junior coalition partners) and opposition parties.
The parties examined are presented in Table 1, where the columns represent the electoral system and the rows represent the parties’ long-term success. What all four parties have in common is that, among the top three parties (both in terms of vote- and seat-earnings) in their countries, they are perceived as the most moderate on the Left–Right dimension. The selection of cases in this article is twofold. First, cases were selected among Western democracies where one of the top three vote-winning parties is neither historically a left-wing party (that is, belongs to Social-Democratic or Labour party family), nor historically a right-wing party (that is, belongs to the Christian-Democratic or Conservative party family). Cases were selected based on available data among this group of countries. That is, countries where the national election survey asked respondents to place themselves and the major parties on the Left–Right scale, and to report their vote in the most recent national elections.
Table 1 Centrist Parties in Different Electoral System
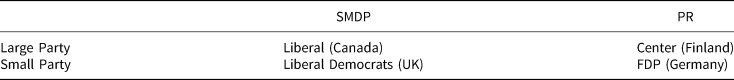
In PR systems, the large party comes from Finland, where the Center Party (KESK) is usually one of the two largest parties and a regular contributor of cabinet ministers and the Prime-Ministerial party in Finland. Yet, in 2011 the Center Party lost about a third of its seats. KESK had been the Prime-Ministerial party consecutively since June 2003. Matti Vanhanen, the party leader and Finnish Prime Minister for almost seven years, resigned a year before the election (replaced by Mari Kiviniemi), presumably due to police investigations (and some indictments) related to irregularities of party and campaign financing. These financing scandals hurt the governing coalition parties’ valence image in general, but specifically they hurt the valence image of the Center Party. Moreover, KESK's leadership seemed to lack charisma, especially relative to Toni Soini, the leader of the populist Finns Party (Nurmi and Nurmi Reference Nurmi and Nurmi2012).
It is important to note, in the context of the competition between the Center party and the Finns Party, that the political center in Finland is denser than in other countries. The Green League, Center Party and the Finns Party are all perceived by voters and experts as moderate on both economic and social issues. Given this party distribution, the importance of Finnish parties’ valence images becomes stronger as voters will have difficulty ideologically differentiating between parties.
The small centrist party in a PR system comes from Germany. In most of the post-World War II period, the FDP had an essential role in the German political system. It held the balance of power between the two largest parties for most of the post-war era and took a ‘corrective’ policy stand between the left and the right (Abedi and Siaroff Reference Abedi and Siaroff2011; Kirchner and Broughton Reference Kirchner, Broughton and Kirchner1988; Thurner Reference Thurner2000). Despite this important role in German politics, in the 2013 election, the FDP failed to reach the legal threshold of 5 per cent for the first time in its history. Between the 2009 and 2013 elections its valence image was hurt by several events including: losing battles over economic issues (which hurt the party's image of competence and unity), increasing public dissent over the management style of the party leader (Guido Westerwelle), revealing of secret information by Westerwelle's employee, accusations of anti-Semitism and the party's inability to recruit popular leadership after Westerwelle's resignation (Zur Reference Zur2017).
In SMDP systems, the successful centrist party case comes from Canada. The Liberal party of Canada served as the Prime Minister's party more than any other party in the post-World War II era. Yet, in 2011 the Liberal party was defeated, and for the first time the Liberal party came third. According to Fournier et al. (Reference Fournier, Cutler, Soroka, Stolle and Bélanger2013) this drop in the Liberals' vote share can be associated with the ‘Orange wave’, meaning the popularity gap between Jack Layton (leader of the New Democratic Party) and other party leaders. Moreover, Michael Ignatieff (leader of the Liberal party) was heavily criticized for living outside Canada for extended periods of time (LeDuc Reference LeDuc2012).
The small centrist party in SMDP is the UK's Liberal Democrats. Before the 2015 election, the Liberal Democrats regularly gained 15–20 per cent of the votes. However, in 2015 they suffered their worst electoral defeat, gaining only 7.9 per cent of the votes. Coming into the 2015 election, the Liberal Democrats’ voters felt betrayed by the party's entrance to a Conservative-led coalition. In addition, Nick Clegg, the most popular leader of the 2010 election, had become the least popular by the 2015 election. Most importantly, the party's bet on electoral system reform was a huge competence failure when 68 per cent voted against it in the 2011 referendum (Cutts and Russell Reference Cutts and Russell2015; Johnson and Middleton Reference Johnson and Middleton2016).
Comparing these four parties (each before and after the election of its collapse) allows us to test the hypotheses above under a variety of electoral rules, government positions, long-term valence image and other contexts. Another important variation is the parties’ ability to regain their electoral support in the next election period. The Liberal party regained its parliamentary majority in the following election (2015), receiving its highest vote share since 1980. According to Clarke et al. (Reference Clarke2017), this electoral success is associated with the party's improved valence image (specifically Justin Trudeau's leadership). Similarly, the Finnish Center party regained its Prime-Ministerial position and the plurality of votes in the 2015 election. In 2017, the German FDP returned to the Bundestag after more than doubling its 2013 vote share. The Liberal Democrats’ vote share further declined in 2017. As I will show below, the Liberal Democrats were the only party out of these four parties that could not improve their valence image before the election following its collapse.
The variations in context, electoral systems, incumbency status and financial resources are related to both the parties’ necessity to change their valence and policy image, and their capacity to do so. On the one hand, the electoral punishment for a governing party might be larger than an opposition party when its valence image deteriorates. On the other hand, a governing party might have a larger capacity (in terms of resources and policy making) to combat the deterioration of its valence image. The results presented here are consistent for the Prime Minister's party (Finnish Center 2011), junior coalition partners (FDP 2013, Lib Dems 2015) and opposition parties (Canadian Liberals). The arguments presented above are also supported by the empirical analyses in different electoral systems, where the dynamics of party competition might be different at the local level and between small and large district magnitudes. The results hold even when specific regions are omitted from the analysis (such as Quebec in Canada, Scotland and Wales in the UK), leading to the conclusion that the case-specific context does not drive the explanation for centrist parties’ electoral collapse.
Data and Methods
In order to demonstrate that the collapse of centrist parties’ vote share is associated with deterioration of their valence image, I examine individual-level national post-election surveys of three elections in each country; the election of the collapse, the preceding and following elections.Footnote 4 I utilize these surveys to test the extent to which voters’ reported vote choice is related to their ideological proximity to each party, parties’ valence image (Hypothesis 1), and parties’ possible electoral gains by changing their policy position (Hypothesis 2).Footnote 5 In all surveys, respondents were asked to recall which party they voted for in the recent election. The answer to this question is used as the dependent variable in this article.
Voters’ decision rule is represented in the analyses below as a simple utility function with two components: ideological proximity and valence image.Footnote 6 Therefore, the data were manipulated to represent the voter–party proximity relationship. In all the surveys, respondents were asked to place themselves and the parties on a 0 to 10 Left–Right continuum. I use these questions to compute the distance between the respondents’ self-placement and parties’ mean perceived Left–Right position (see Table A1 in the Appendix for numeric representation). As the distance between a voter and a party increases, voter's utility from voting for that party decreases, and so does the likelihood of voting for the focal party. In all the analyses shown below the models are unidimensional (Left–Right), the loss function is linear and parties are placed in their mean perceived position.Footnote 7
Because I argue that the electoral collapse of centrist parties is associated with their valence image, and not changes related to ideology, I expect that the coefficient on the Left–Right proximity variable would not change significantly from one election to the other. However, this is not to say that ideology does not affect voters’ decisions. On the contrary, I expect this coefficient to be negative (that is, voters punish parties that are distanced from their self-reported Left–Right position) and highly significant.
While the salience of Left–Right proximity is not expected to change from one election to the other, centrist parties’ valence image does. To proxy parties’ aggregated valence image, I use party-specific coefficients, where the baseline category is the centrist party. Party-specific coefficients are a good proxy for parties’ valence image as they capture broad non-policy-related (dis)advantages (Adams and Merrill Reference Adams and Merrill2005; Adams, Merrill, and Grofman Reference Adams, Merrill and Grofman2005; Zur Reference Zur2017). When these party-specific coefficients are positive, they imply that the valence image of the centrist party (baseline category) is worse than the other parties' valence images. Thus, an increase of the coefficients means that the centrist party's valence image deteriorated. If the theory presented above is correct, the analyses below should show larger party-specific coefficients in the election in which the collapse occurs than in the preceding election. When a centrist party's vote share increases in the following election, the coefficient should decrease.
The proximity and valence components of voters' utility function are used to evaluate a conditional logit model calculating the voter's probability of voting for each of the parties. The parties’ reported vote share is represented by the average probability of receiving the vote of each voter. Then, I test hypothesis 2 (inconsequential moderation) using the simulation method described in Adams, Merrill, and Grofman (Reference Adams, Merrill and Grofman2005). Based on the estimated salience of ideological proximity and parties’ valence image, I simulate two scenarios. First, I simulate parties’ counterfactual vote share increase due to change in their policy position. In this scenario, each party unilaterally changes its policy position along the Left–Right scale, while all other parties’ Left–Right position and voters’ decision rules are fixed. Then, a party's vote-maximizing position is defined as the Left–Right position which maximizes its computed vote share. In the second scenario, I test how realistic changes in parties’ non-positional attributes are related to their counterfactual electoral growth. I compute the parties’ counterfactual vote share increase from improving their valence image by one unit. The one unit increase of valence image is a realistic value as it is the observed centrist party's valence change between elections in the dataset used in this article.
Results
Figure 1 exemplifies the centrist party's problem. In this figure one can see a simple vote choice model that estimates the probability of voting for a focal party given the probability of voting for any other party. Vote choice in this model is based on the proximity of the voter to each party, and a valence term for each party (where the centrist party is the baseline category). The loss function is linear, and valence is estimated by party-specific coefficients. Other model specifications, including voter specific attributes, directional components and quadratic loss functions, are discussed in the Appendix. The substantive results hold through all model specifications, both for the linear and the quadratic loss functions. In addition, model's fits estimations and descriptive statistics are discussed in the Appendix. In all four panels the election in which the parties’ vote share collapsed is marked with black, the preceding election is marked with dark gray and the following election is marked with light gray. Nodes describe conditional logit coefficients and bars represent 95 per cent confidence intervals.
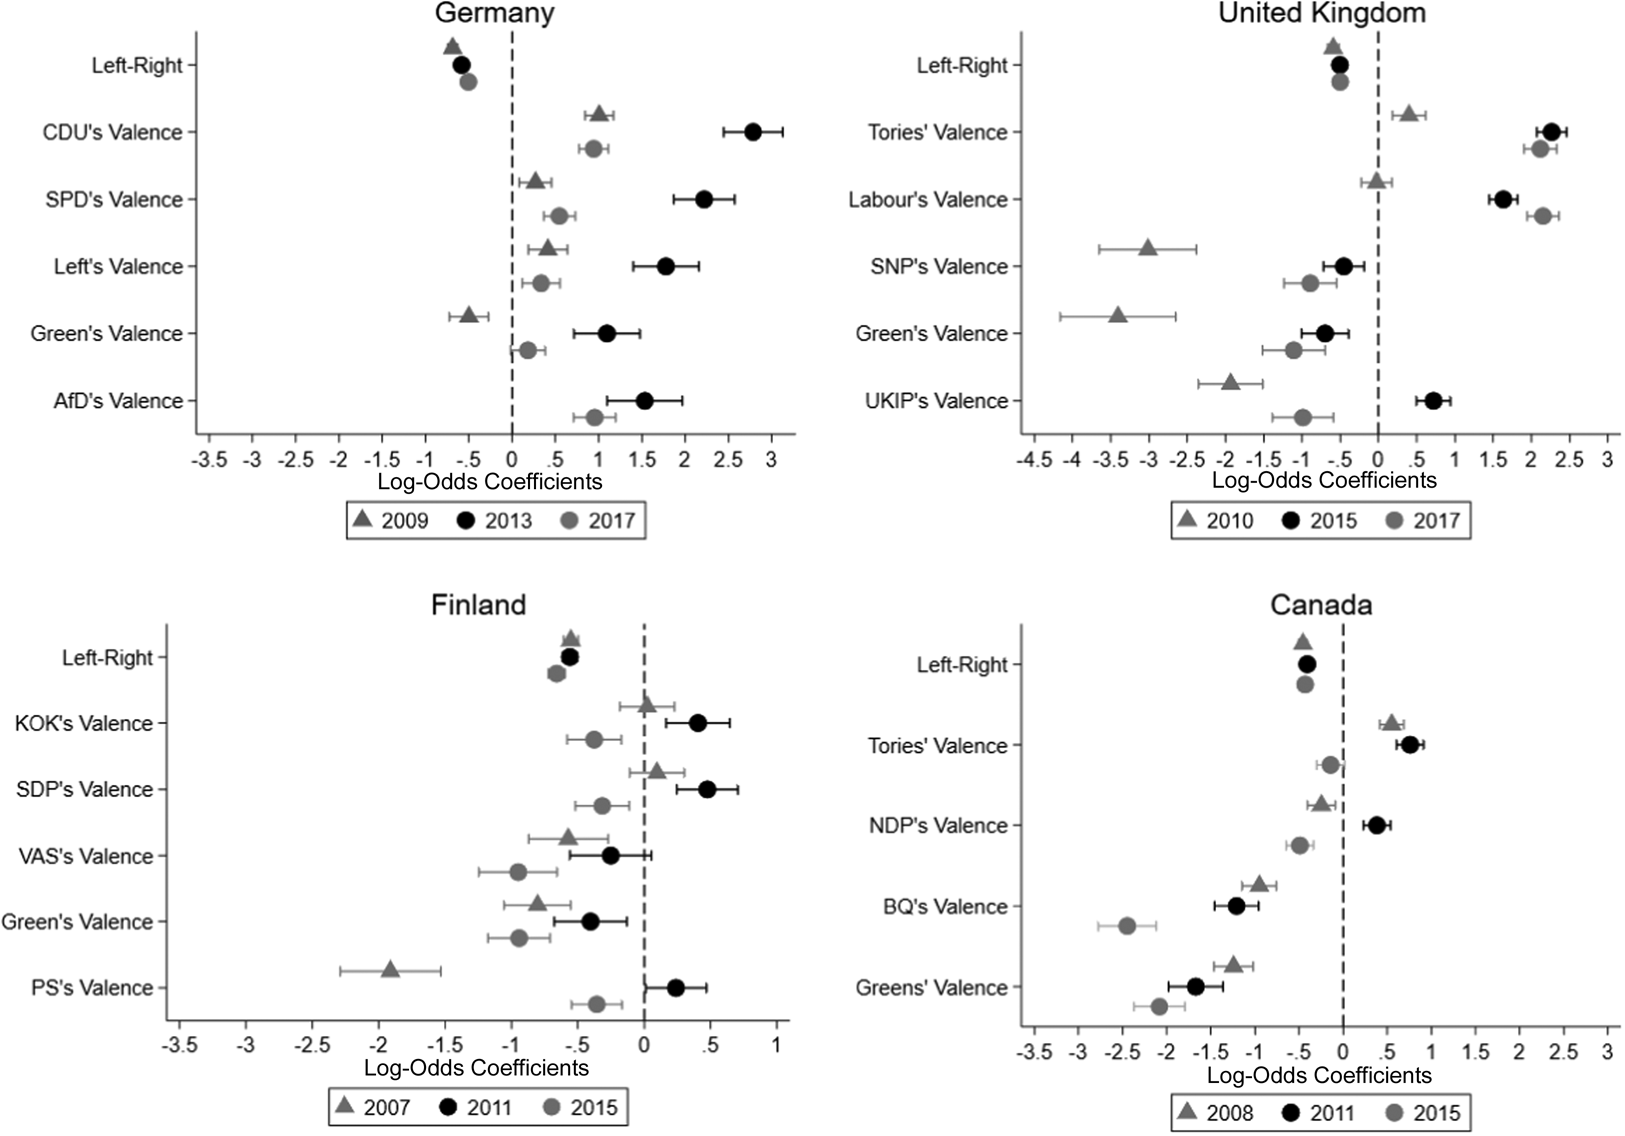
Fig. 1. Ideology and Valence Effects on Vote Choice.
Note: The dependent variable in these models is respondents’ reported vote choice. Each panel includes the election of the collapse (in the middle) and the elections before and after the collapse. Left–Right proximity is a linear (absolute) term. Parties’ valence is relative to the baseline (centrist) party. Nodes show Conditional Logit Log-Odds coefficients. Bars show 95% confidence intervals. Model fit information is shown in the appendix.
The results in Figure 1 support the main argument of this article. In all four cases, the collapse of the centrist party (the middle election in each panel) is associated with the collapse of its valence image. The coefficient on Left–Right proximity is, as expected, negative and does not change significantly between years. This implies that in all four cases, voters place similar emphasis on Left–Right ideology in their decision rule. Given the lack of major changes in parties’ perceived positions or the distribution of respondents’ self-placements on the Left–Right continuum, the collapse of centrist parties cannot be associated with their policy positions. A similar picture rises from the following election after the centrist party collapses. Parties that had witnessed vote share increase (FDP, KESK and the Canadian Liberals) were also perceived as higher on valence.
Parties’ valence terms in Figure 1 are calculated relative to the centrist party's valence. Positive coefficients imply that the focal party has a better valence image than the centrist party in its system, and negative coefficients imply that the centrist party has a better valence image than the focal party. Between each two elections, increase in the valence coefficient implies that the focal parties’ valence images improved relative to the centrist party. In all four panels of Figure 1 there are at least two positive valence coefficients and the valence coefficients for most parties are largest in the model representing the year of the collapse. These results imply that at least two parties in each system are perceived as higher valence parties than the centrist, when a centrist party's vote share declines. As a whole, Figure 1 supports the argument that the collapse of centrist parties is associated with deterioration of their valence image. Moreover, when centrist parties improve their valence images, their vote shares increase as well.
The collapse of centrist parties is best demonstrated by the decline of the two small centrist parties’ valence images – the German FDP (panel A) and the British Liberal Democrats (panel B). In both cases, when the centrist party's vote share crashed, all other parties’ valence image increased significantly. In the FDP's case, its 2013 valence image deteriorated to the extent that it was the worst in the system; suggesting that all other parties were preferred over the FDP based on non-policy issues. For the Liberal Democrats in 2015, the worsening of its valence means that voters preferred the Conservatives, Labour and UKIP based on non-policy considerations, independently from their ideological Left–Right position (while only the Conservatives had better valence image in 2010). More specifically, based on the simple model presented in Figure 1, Table 2 displays the likelihood of voting for a focal party over a centrist party when a voter is ideologically indifferent between them. For example, a voter that is indifferent between the CDU and the FDP on ideology is 2.82 times more likely to vote for the CDU in the German 2009 election. In 2013, the same voter is 16.47 times more likely to vote for the CDU over the FDP. Similarly, a voter that is indifferent between the Conservatives and the Liberal Democrats on Left–Right ideology is 1.51 times more likely to vote for the former in the 2010 UK election. In 2015, the same voter is 10.38 times more likely to vote for the Conservatives over the Liberal Democrats.
Table 2 Likelihood of Policy Indifferent Voter Voting Against a Centrist Party
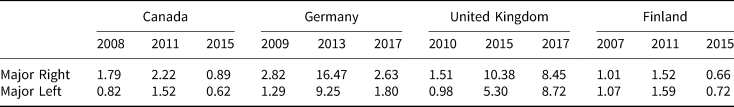
Note: This table presents the estimated likelihood of voting for a focal party over the centrist party, when the voter is indifferent between the parties on the Left–Right continuum. Confidence intervals and the full set of parties are shown in Table A5 in the Appendix.
There is an important difference between the FDP and the Liberal Democrats. While the former party's vote share increased by almost 6 per cent in the election following its collapse, the latter party's vote share decreased by another 0.5 per cent. This difference is also associated with the change of the parties’ valence image. The FDP's valence image improved significantly in the election following its collapse and, despite being worse than all other parties, it is dramatically better in 2017 than in 2013. By contrast a voter indifferent between the CDU and the FDP on ideology is only 2.63 times more likely to vote for the CDU in 2017. The British Liberal Democrats’ valence image increased relative to the Conservatives but decreased relative to Labour, making a policy indifferent voter 8.45 times more likely to vote for the Conservatives, and 8.72 times more likely to vote for Labour in 2017. These results, again, support the argument that, for centrist parties, vote shares are primarily determined by valence image, not ideological changes.
While the valence image of small centrist parties deteriorates relative to all other parties in the systems when their vote shares collapse, the dynamics with respect to large centrist parties’ valence image is more complicated. In Finland, the Center party's vote share was cut by roughly one-third (to its lowest point since World War I). Yet, it was not the only party that suffered from deterioration of its valence image. In the preceding election to its collapse (2007), the Center party had equal to or better valence image than all other parties in the system. However, in 2011, three parties’ valence term increased significantly. For the Finns Party (PS), a right-wing anti-immigrant party, the valence term increased more than any other party. As already discussed, the model presented in Figure 1 does not include any other policy dimension except the Left–Right. It is important to note that adding an immigration proximity measure to the 2011 Finnish model does not mediate the results but strengthens them (see the Appendix for an elaborated discussion of this point). More specifically, the results shown in Figure 1 imply that a voter that is indifferent between the Center party and the Finns Party on Left–Right is 7.14 times more likely to vote for the Center party in 2007, but 1.29 times more likely to vote for the Finns Party in 2011. In 2015, when the Center party regained its position as the largest party, and the party of the Prime Minister, its valence image was once again better or equal to the valence image of any other party. The voter, who was 1.29 more likely to vote for the Finns Party in 2011, is now 1.45 more likely to vote for the Center party.
In the Canadian case, the Liberal party's decrease in vote share can be associated specifically with the increase of the valence image of the New Democratic Party (NDP). Remember that the results of the 2011 election in Canada were historic both because the NDP formed the official opposition for the first time and because the Liberal party suffered its worst defeat (Fournier et al. Reference Fournier, Cutler, Soroka, Stolle and Bélanger2013). Consistent with the theme of the other three panels, the results from Canada (panel D) show that there were no significant changes in ideology between 2008 and 2011. The great increase of the NDP's valence (from negative to positive valence image relative to the Liberals) and the minor increase of the Conservatives’ valence relative to the Liberal party's valence played a major role in the Liberals’ collapse. The 2015 elections brought the Liberal party its highest vote share since 2000, not surprisingly, due to a huge increase in their valence image. In 2015 the Liberals had a better valence image than any other party, and a voter indifferent between them and the NDP was 62 per cent more likely to vote for the Liberal party.
To conclude, Figure 1 displays simple vote choice models from four countries and twelve elections. In all cases, the results imply that the collapse of the focal centrist party is associated with the deterioration of its valence image and not with changes in the salience of the Left–Right dimension. Moreover, given that the distribution of voters’ self-placements and parties’ perceived positions are similar over time, changes in centrist parties’ vote shares are explained mainly by their valence images, and not by Left–Right polarization at either the elite or the mass level. While more complicated vote choice models (including a variety of voter-specific attributes or policy issues) are discussed in the Appendix, it should be noted that they are all pointing to the same substantive conclusion. Voters’ and parties’ ideological preferences change very little, if at all, but the voters’ perception of centrist parties is crucial to their electoral success.
The empirical analyses presented above imply that centrist parties’ vote shares crash when their valence image deteriorates. The broader implication of this finding is that voters consciously disregard parties that are proximate to their ideological position. Voters are not ‘fooled’ by parties, they know that a competent party delivers more policy benefits than an incompetent one. Thus, they are better off voting for a more spatially distant, but higher valence party, than a proximate but lower valence party. The next section aims to examine what parties could have done to compensate for their low valence.
I apply the simulation method used in Adams, Merrill, and Grofman (Reference Adams, Merrill and Grofman2005), where parties’ counterfactual vote shares for alternative positional strategies are computed based on the observed voting model presented in Figure 1.Footnote 8 I have computed the expected vote share of each party in each election under the conditions in which a focal party's perceived policy position changes throughout the 0 to 10 Left–Right continuum, without any other changes to voters’ decision rules and with rival parties’ strategies fixed at their actual (perceived) positions. These simulations allow me to compute the best possible Left–Right position including those positions where a party has to leap-frog above its counterparts. Then, each party's vote-maximizing position is defined as the point where it maximizes its expected vote in this counterfactual scenario.Footnote 9 By the structure of these simulations, parties’ vote shares must increase relative to the expected vote shares computed from the model presented in Figure 1. Yet, the magnitude of the increase is a function of the parties’ distance from their vote-maximizing position, the salience of Left–Right ideology in each country-election and parties’ relative valence.
Figure 2 shows the simulated vote share gains from parties’ movement to their vote-maximizing position (holding everything else constant). Recall that the vote-maximizing position is computed by varying the party's position and computing its counterfactual vote share.Footnote 10 The figure shows box-plots of the simulated vote share gains of centrist (mean = 0.71), Green (mean = 0.69), Populist-Right (mean = 4.50), the major-Left (mean = 3.02), other Left (mean = 2.72) and major-Right parties (mean = 6.88).Footnote 11 While the number of party-election observations in each group is small (8–12), the mean vote share increase for centrist parties is statistically significantly lower than any other group of parties except the Green.Footnote 12
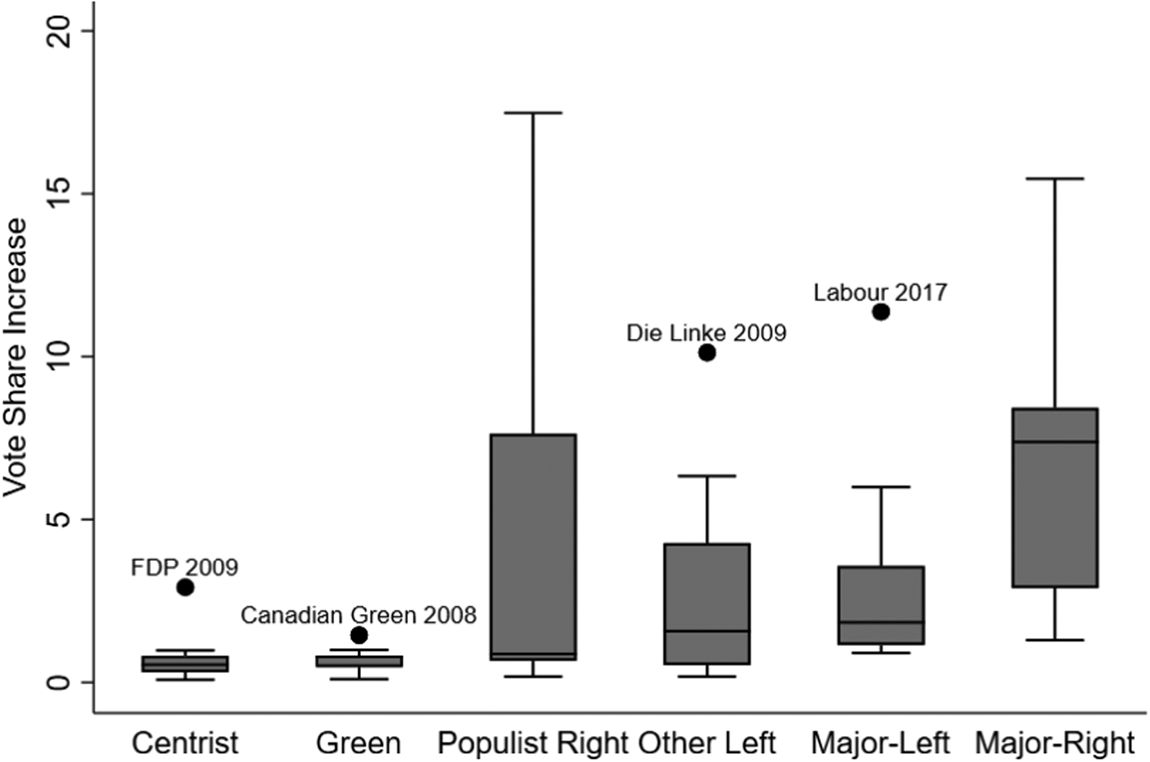
Fig. 2. Simulated Vote Share Increase from Moving to Vote-Maximizing Position.
Note: Boxes show 25th to 75th percentiles of parties’ vote share increase from changing their perceived Left–Right position to their vote-maximizing position. Each box represents 12 party-election simulations, except the populist right (8 party-election simulations).
One implication of Figure 2 is that, unlike the parties on the wings, centrist parties cannot grow significantly by altering their policy positions. As displayed in Figure 3, given the self-reported voter Left–Right positions, centrist parties' perceived Left–Right positions are much closer to their vote-maximizing position than any those of other party groups. For instance, the average centrist party needs to move only a little over one half unit away from its perceived Left–Right position to get to its vote-maximizing position, while the average Green party must move more than one full unit on the 0 to 10 scale to reach its vote-maximizing position.
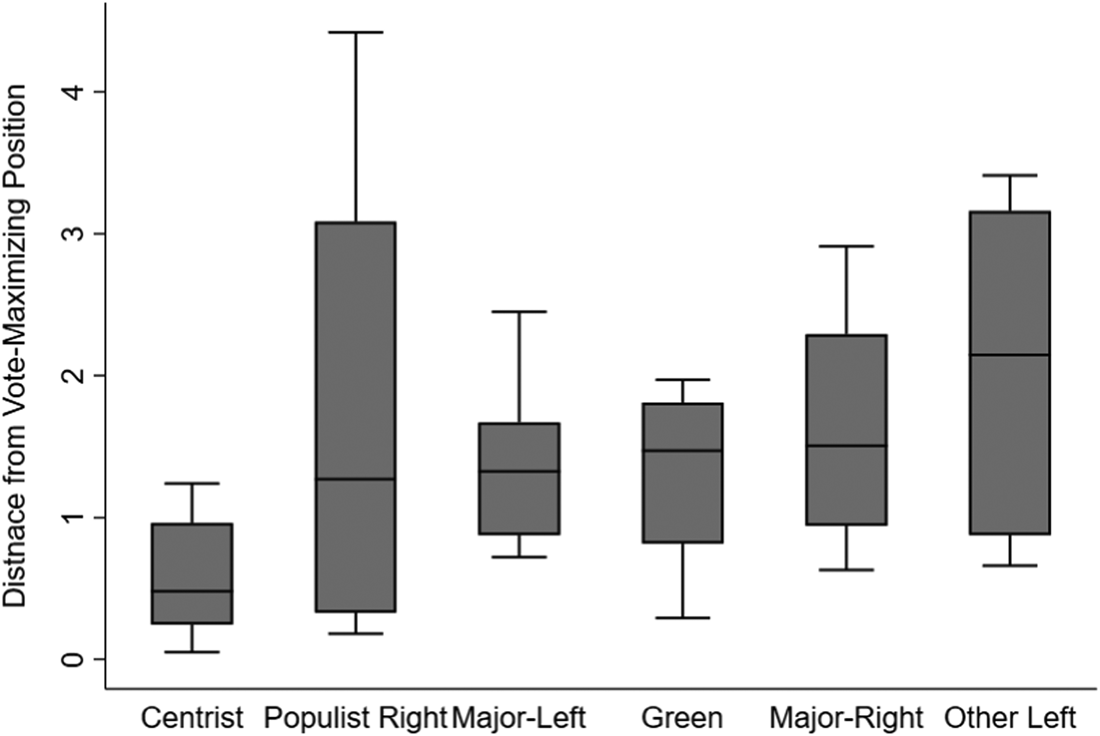
Fig. 3. Distance between Parties’ Perceived and Vote-Maximizing Left–Right Position.
Note: Boxes show 25th to 75th percentiles of parties’ absolute distance between their perceived Left–Right position and their vote-maximizing position. Each box represents 12 party-election simulations, except the populist right (8 party-election simulations).
The mathematical simulations also imply a non-linear relation between valence and potential vote share growth. However, this relationship does not apply to centrist parties. Figure 4 shows parties’ valence (relative to the Green party in their country) on the x axis, and their counterfactual vote share increase from moving to their vote-maximizing position on the y axis. All party groups except the centrist parties can increase their vote share by a larger margin as their valence increases. Yet, for centrist parties (excluding the FDP in 2009) the vote share increases from taking a vote-maximizing position does not exceed 1 per cent. That is, even when their valence image is better than other parties’, centrist parties cannot grow by moderating their positions even further or by taking extreme positions. It should be clarified that the marginal vote share increase means that a good valence image is crucial to centrist parties’ electoral outcomes. Recall that Figure 1 suggested that center parties’ declined electoral outcomes are related to the deterioration of their valence image. Given that centrist parties cannot improve their electoral outcome by taking different policy positions, their valence image determines their electoral success. Non-centrist parties, on the contrary, can grow by moderating their ideological position and this growth is accelerated when they are perceived as high valence parties.
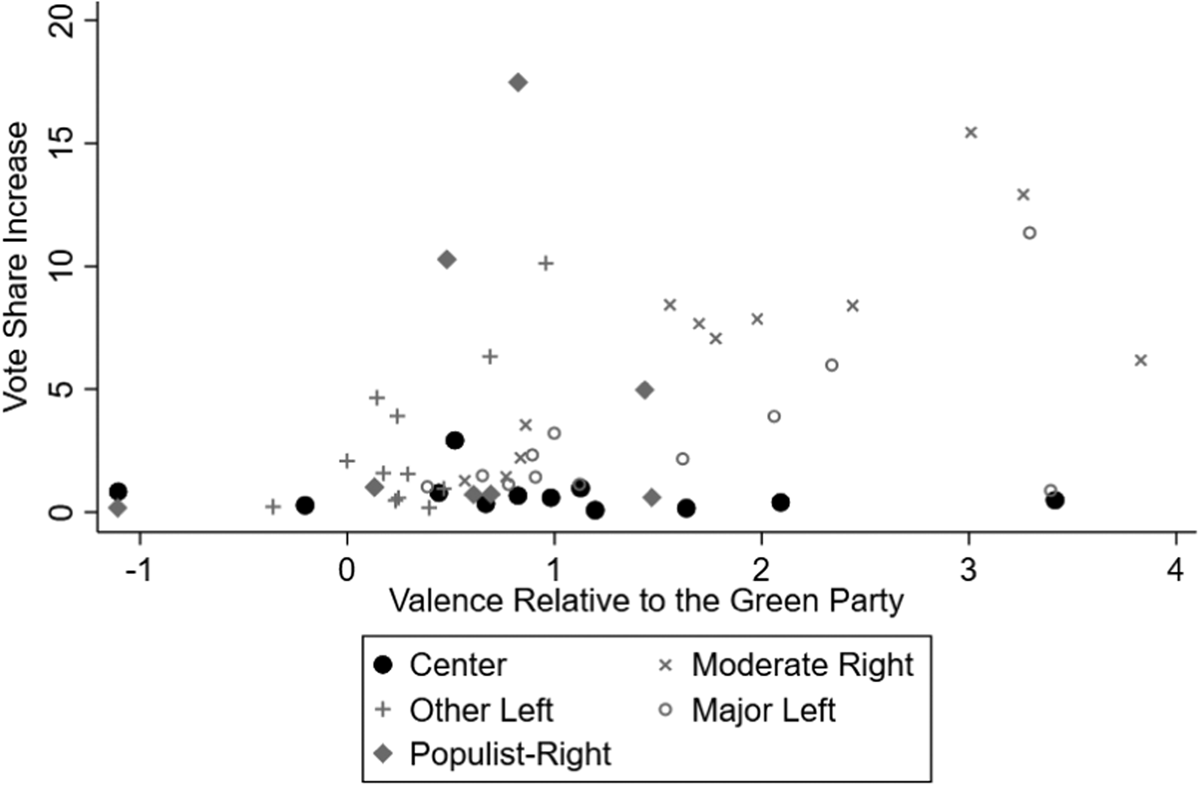
Fig. 4. Valence and Simulated Vote Share Increase at Vote-Maximizing Position.
Note: Parties’ valence image relative to the Green party in each country-election is shown on the x-axis, where values are observed from the models presented in Figure 1. The y-axis represents parties’ vote share increase from moving to their vote-maximizing position on the Left–Right dimension. Each group of parties includes 12 party-election simulations, except the populist right (8 party-election simulations).
Thus far the results are supportive of the argument that changes in centrist parties’ vote share are mainly determined by their valence image, and that they cannot grow much by presenting a different ideological position. Given these results it should be asked to what extent centrist parties can grow by improving their valence image. To answer this question, I simulate parties’ vote shares in a counterfactual scenario where a focal parties’ valence image is increased by one unit, while all other covariates are held constant. The simulations in this case assume that parties’ policy positions, voters’ decision rule and the salience of the Left–Right dimensions do not change as a function of the focal party's improved valence. It is important to note that between one election to the next parties’ valence images change to much greater magnitude than their policy positions or public opinion. Therefore, one unit increase in parties’ valence image is a realistic change. Moreover, one-unit change is the average observed change in centrist parties’ valence image relative to the major parties in the data used in this article.
Figure 5 shows the simulated vote share increase of different groups of parties when parties’ valence is increased by one unit. Unlike in the cases of changing their policy position, here centrist parties can grow substantively by improving their valence image. The figure shows box-plots of the simulated vote share gains due to realistic improvement of parties’ valence image. Centrist parties can grow in similar magnitude (mean = 16.37) to major-Right (mean = 17.39, t = 0.55) and major-Left (mean = 18.38, t = 1.15) parties. However, centrist parties’ vote share increase from improved valence is significantly larger than Green (mean = 8.75, t = −3.56), other Left (mean = 7.74, t = −4.59), and Populist-Right (mean = 9.64, t = −2.48) parties.

Fig. 5. Vote Share Increase from One-Unit Improvement in Parties’ Valence Image.
Note: Boxes show 25th to 75th percentiles of parties’ vote share increase from one-unit improvement to parties’ valence image, relative to all other parties. Each box represents 12 party-election simulations, except the populist right (8 party-election simulations).
Taking all evidence together, centrist parties seems to be stuck between parties that are advantaged in two regards. First, major-Right and major-Left parties can increase their vote shares by squeezing the centrist party. Second, they can grow by improving their valence image. Centrist parties, on the other hand, can only improve their valence in order to grow. Their observed Left–Right position is extremely close to their vote-maximizing position, and therefore they cannot grow by changing their policy positions. This might be bad news for centrist parties, as their ability to control their valence image is more limited than their ability to control their policy positions, but it is not bad news for democracy. Voters seem to reward parties for qualities such as honesty, integrity and good governance.
Conclusions
This article explains the enormous electoral defeats of centrist-liberal parties in recent years. Small centrist parties such as the German FDP and the British Liberal Democrats, and even large parties such as the Liberal Party of Canada and the Center Party of Finland, have seen their vote share collapse despite holding very popular policy positions. Since Downs (Reference Downs1957), scholars of both American and comparative politics have been engaged in research that aims to explain the lack of congruence between voters’ preference and parties’ policy positions. While these scholars have produced ample theoretical explanations and robust empirical implications, they have overlooked the parties that are ‘on point’ in representing the median voter's position. In this research I have shed light on the differences between parties that take moderate-centrist Left–Right positions and those that are off-center. Focusing on centrist parties allows for a more complete understanding of the empty center phenomenon.
I have shown that centrist parties vote shares are sensitive to realistic changes in their valence image. Differently from non-centrist parties, centrist parties cannot alter their positions to compensate for negative valence image. Moreover, when parties’ valence deteriorates, they can moderate their position to attract more voters from the crowded center of the Left–Right continuum and increase their vote shares. The magnitude of the growth, however, is contingent on two factors: the party's proximity to its vote-maximizing position, and the magnitude of the party's valence (dis)advantage.
The results presented show that centrist parties are disadvantaged twice. First, they are extremely close to their vote-maximizing position. Thus, changing their Left–Right position will insignificantly increase their vote shares. At the same time, high valence parties that take off-center positions have the potential to grow by moderating their position. This potential growth will come mainly at the expense of centrist parties. The second disadvantage centrist parties experience is related to their valence image, where the potential growth of their vote share is not larger than the potential growth of major-Left and major-Right parties.
These results are not merely about the empty center phenomenon. They have important implications for the understanding of parties’ strategies and the voters–elite linkages. From parties’ perspectives improving their valence image is always desirable, but parties’ control over their valence image is doubtable at best. Yet, the results imply that recruiting a popular leader or presenting a unified front might be more beneficial for centrist parties than for Green, Communist or populist-Right parties. For such niche parties, the saliency of issues that are not covered by the Left–Right dimension can be a potential path to electoral growth. This can be tested in a promising future research. Most importantly, this article contributes another piece of information to the understanding of the linkages between the party elites and the mass public. Voters, the results imply, are not misrepresented by the parties they voted for. Voters prefer losing some policy utility to gain much higher valence utility. These results reassure the democratic ideal.
Data sources
Canada 2015: Fournier, Patrick, Fred Cutler, Stuart Soroka and Dietlind Stolle. The 2015 Canadian Election Study [dataset].
Canada 2011: Fournier, Patrick, Fred Cutler, Stuart Soroka and Dietlind Stolle. The 2011 Canadian Election Study [dataset].
Canada 2008: Fournier, Patrick, Fred Cutler, Stuart Soroka and Dietlind Stolle. The 2008 Canadian Election Study [dataset].
Finland 2015: Grönlund, Kimmo (Åbo Akademi University) and Kestilä-Kekkonen, Elina (University of Tampere): Finnish National Election Study 2015 [dataset]. Version 1.0 (2016-06-13). Finnish Social Science Data Archive [distributor]. http://urn.fi/urn:nbn:fi:fsd:T-FSD3067.
Finland 2011: Borg, Sami (University of Tampere) and Kimmo Grönlund (Åbo Akademi University): Finnish National Election Study 2011 [dataset]. Version 2.1 (2013-01-22). Finnish Social Science Data Archive [distributor]. http://urn.fi/urn:nbn:fi:fsd:T-FSD2653.
Finland 2008: Paloheimo, Heikki (University of Tampere): Finnish National Election Study 2007 [dataset]. Version 1.1 (2012-01-05). Finnish Social Science Data Archive [distributor]. http://urn.fi/urn:nbn:fi:fsd:T-FSD2269.
Germany 2017: Roßteutscher, Sigrid, Rüdiger Schmitt-Beck, Harald Schoen, Bernhard Weßels, Christof Wolf and Aiko Wagner Nachwahl-Querschnitt (GLES 2017). GESIS Datenarchiv, Köln, 2018. ZA6801 Datenfile Version 2.0.0 (2018), doi:10.4232/1.12991.
Germany 2013: Rattinger, Hans, Sigrid Roßteutscher, Rüdiger Schmitt-Beck, Bernhard Weßels, Christof Wolf, Aiko Wagner and Heiko Giebler, Nachwahl-Querschnitt (GLES 2013). GESIS Datenarchiv, Köln, 2017. ZA5701 Datenfile Version 3.0.0 (2017), doi:10.4232/1.12809.
Germany 2009: Rattinger, Hans, Sigrid Roßteutscher, Rüdiger Schmitt-Beck, Bernhard Weßels, and Aiko Wagner, Nachwahl-Querschnitt (GLES 2009). GESIS Datenarchiv, Köln, 2017. ZA5301 Datenfile Version 4.0.1 (2017), doi:10.4232/1.12805.
United Kingdom 2017: Fieldhouse, E., J. Green, G. Evans, H. Schmitt, C. van der Eijk, J. Mellon and C. Prosser, British Election Study, 2017: Face-to-Face Post-Election Survey [data collection]. 2018.
United Kingdom 2015: Fieldhouse, E., J. Green, G. Evans, H. Schmitt, C. van der Eijk, J. Mellon and C. Prosser, British Election Study, 2015: Face-to-Face Post-Election Survey [data collection]. UK Data Service, 2016. SN: 7972, http://dx.doi.org/10.5255/UKDA-SN-7972-1.
United Kingdom 2010: Whiteley, P.F. and D. Sanders, British Election Study, 2010: Face-to-Face Survey [computer file]. Colchester, Essex: UK Data Archive [distributor], August 2014.
Acknowledgements
An earlier version of this article was presented at the 2018 annual meeting of the Midwest Political Science Association and at the 2017 EITM summer institute at University of Houston. I thank James Adams, Carlos Algara, Noam Gidron, Christopher Hare, Ireen Litvak-Zur, Matthew Shugart, the participants of the EITM 2017, and the editor and the anonymous reviewers of the British Journal of Political Science for their helpful comments. Any remaining errors are my own sole responsibility.
Supplementary material
Data replication sets are available in Harvard Dataverse at: https://doi.org/10.7910/DVN/DICJVR, and online appendices at: https://doi.org/10.1017/S0007123419000231.


 Open access