Companies register activities 2015-16
Updated 25 August 2016

© Crown copyright 2016
This publication is licensed under the terms of the Open Government Licence v3.0 except where otherwise stated. To view this licence, visit nationalarchives.gov.uk/doc/open-government-licence/version/3 or write to the Information Policy Team, The National Archives, Kew, London TW9 4DU, or email: psi@nationalarchives.gov.uk.
Where we have identified any third party copyright information you will need to obtain permission from the copyright holders concerned.
This publication is available at https://www.gov.uk/government/statistics/companies-register-activities-201516/companies-register-activities-2015-16
1. Introduction
This release provides information about the population of companies and corporate bodies in the United Kingdom. Corporate bodies and companies are specific legal forms of business that are registered at Companies House. Full definitions of both corporate bodies and companies covered by the Companies Act 2006 are provided in the separate Companies House official statistics: Definitions document. Companies form a subset of corporate bodies and are formed under the Companies Act 2006. Corporate bodies and companies are registered at Companies House regardless of whether they go on to trade actively.
This release complements the monthly incorporated companies release by providing information on both companies to which the Companies Act 2006 relates, and on wider corporate body types. Following a consultation on Companies House statistical products which ran earlier in 2016, the monthly release is being replaced with a quarterly publication.
The final monthly release was published in July 2016, reporting figures for June 2016. The first quarterly release will be published in October 2016, covering the period July to September 2016. Some figures in this release may differ to those provided in the Incorporated Companies in the UK, March 2016 publication due to the timing of the analysis. Analyses for the figures in this release are undertaken later in the year, allowing more information to be processed and added to the register. Sections 2-4 of the release focus specifically on companies, while sections 5 and 6 cover all corporate body types.
The statistics in this release include the total number of incorporated companies, newly incorporated companies, and the number of companies that were dissolved. The release focusses on the headline messages for the United Kingdom: figures for the constituent countries are contained in the supplementary tables that accompany the release.
1.1 Key points
-
In the United Kingdom in the 12 months to 31 March 2016, there were 611,372 company incorporations and 399,736 dissolutions. As a result, the number of companies on the total register – including those in the process of dissolution or liquidation (245,080) – reached 3,678,860. This was an increase of 214,704 companies (6.2%) compared to 31 March 2015.
-
The average age of companies on the total register in 2015/2016 was 8.4 years. The average age of companies on the register is relatively young, declining gradually from 10.7 years in 2000 to 8.4 years in 2016.
-
Since 2006, private limited companies have consistently accounted for over 96% of all corporate body types. During this time, the top three corporate body types of private limited companies, limited liability partnerships (LLPs), and limited partnerships have remained unchanged, accounting each year for around 99% of all corporate bodies.
-
On 31 March 2016, there were 10,938 overseas corporate bodies on the register with a physical presence in the UK. Corporate bodies incorporated in the USA accounted for 22.5% of all overseas companies.
2. Incorporated companies
In the United Kingdom in the 12 months to 31 March 2016, there were 611,372 company incorporations and 399,736 dissolutions. As a result, the number of companies on the total register – including those in the process of dissolution or liquidation (245,080) – reached 3,678,860.
This was an increase of 214,704 companies (6.2%) compared to 31 March 2015. This change was largely driven by an increase of 203,516 companies in England and Wales, with changes in Northern Ireland and Scotland adding 11,189 companies.
The effective register, which excludes companies in the process of liquidation or dissolution, stood at 3,433,780 on 31 March 2016, an increase of 230,083 companies (7.2%) since the same date in 2015.
2.1 Figure 1: Total register size of each registry, 31 March 2016
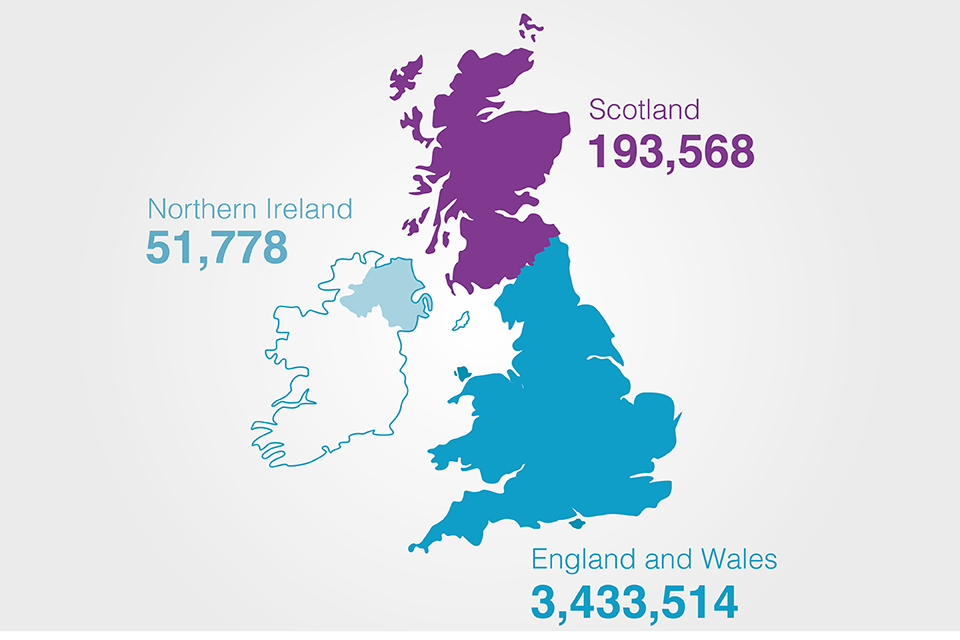
Source: Companies Register Activities 2015/16, Companies House
A full breakdown of figures for England and Wales, Scotland, Northern Ireland and the UK as a whole is provided in Table A1 in the Excel workbook that accompanies this release. Figures are provided for the years 2011-12 through to 2015-16.
3. The growth in incorporated companies
Between 1979 and 2016 the total register for the United Kingdom increased by almost 2.9 million companies, while the effective register increased by just over 2.7 million companies. Statistics for 1979 to 2008 are for Great Britain. In October 2009, the Northern Ireland register merged with the register for Great Britain to create a UK register. UK figures are from 2009/10 onwards. Figures for 1979 to 1986 are for the calendar year 1 January to 31 December. Those for 1986/87 to 2015/16 are for the financial year 1 April to 31 March.
Over this time, the total register has increased annually for 33 of the 37 years, while the effective register has increased for 31 of the 37 years. The most recent declines in the Great Britain effective register occurred in 2008/09, with a decrease of 157,700 companies; the UK total register declined a year later in 2009/10, with a decrease of 88,300 companies.
3.1 Chart 1: Total register size of each registry, 31 March 2016
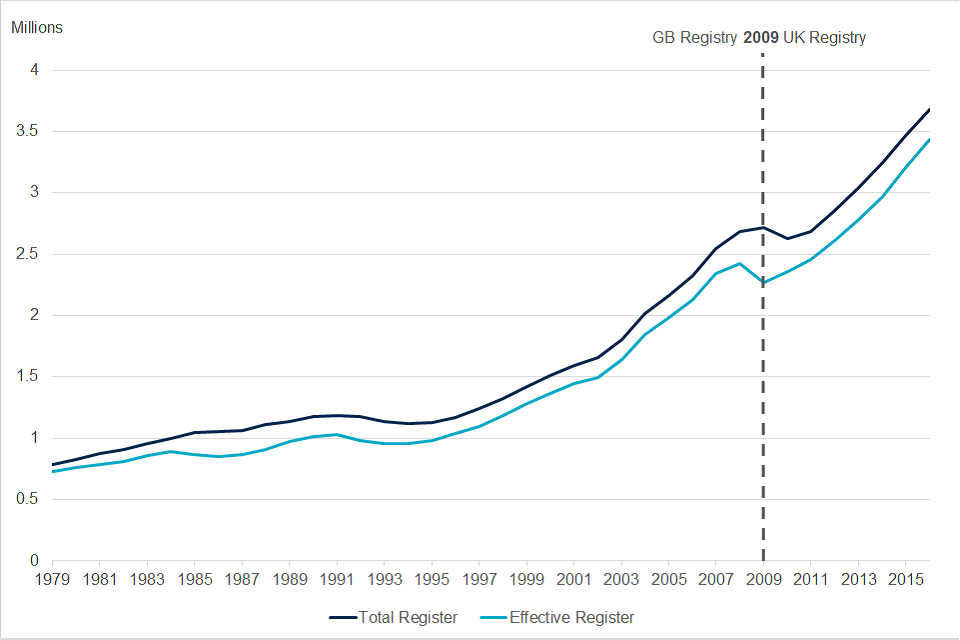
Source: Companies Register Activities 2015/16, Companies House
Despite some annual fluctuations, the numbers of incorporations and dissolutions have also increased over time: incorporations have increased from 66,500 in 1979 to 611,400 in 2015/16 and dissolutions have increased from 25,700 to 399,700.
3.2 Chart 2: Incorporations and dissolutions, 1979-2016, UK
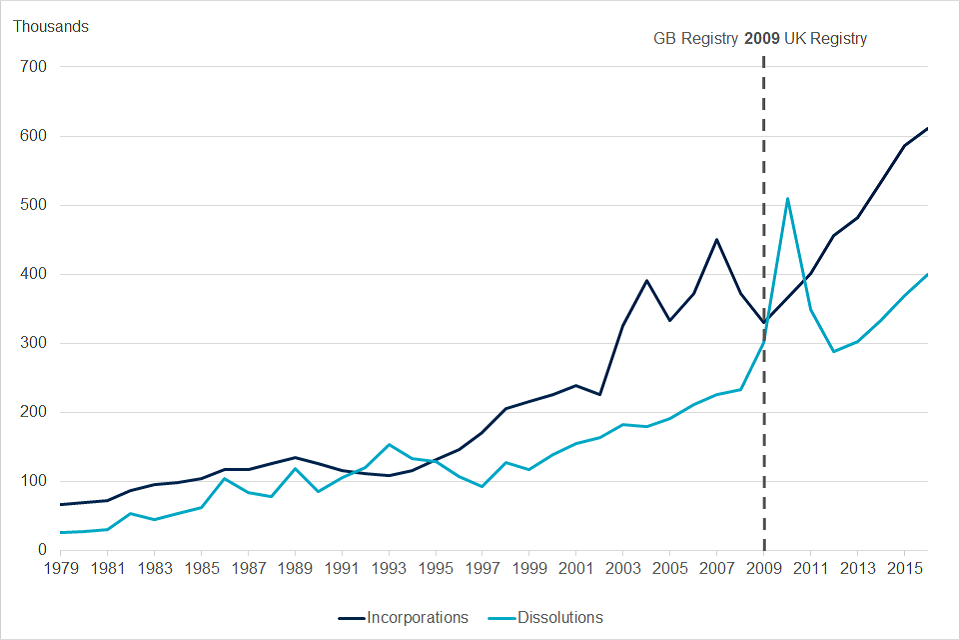
Source: Companies Register Activities 2015/16, Companies House
Between 2009 and 2010 was a period of significant change for the register:
- The Northern Ireland register was included to create a UK register;
- There was a change in the administrative system that forms the register;
- There was a purge on the register to remove defunct companies that had spent an extended period in the process of dissolution or liquidation;
- Legislative changes were introduced under the Companies Act 2006, which reduced the time taken to dissolve companies and remove them from the register.
These changes in combination are likely to have contributed to the sharp increase in the number of dissolutions between 2009 and 2010. They may also have had an impact on both the numbers of incorporations, and on the sizes of the total and effective registers.
Table A10, in the workbook that accompanies this publication, shows the total and effective register sizes from 1939 to 2015/16, as well as the annual number of incorporations, dissolutions, liquidations and insolvencies.
4. Age of companies on the register
The average age of UK companies on the total register in 2015/2016 was 8.4 years. Over half (53.4%) of companies were aged less than five years and almost three-quarters (72.5%) were aged less than 10 years. Less than one-tenth (9.7%) of companies were aged twenty years or above. The age profile of companies differed very little between the total and effective registers.
4.1 Chart 3: Age profile of companies on the total register, 2016, UK
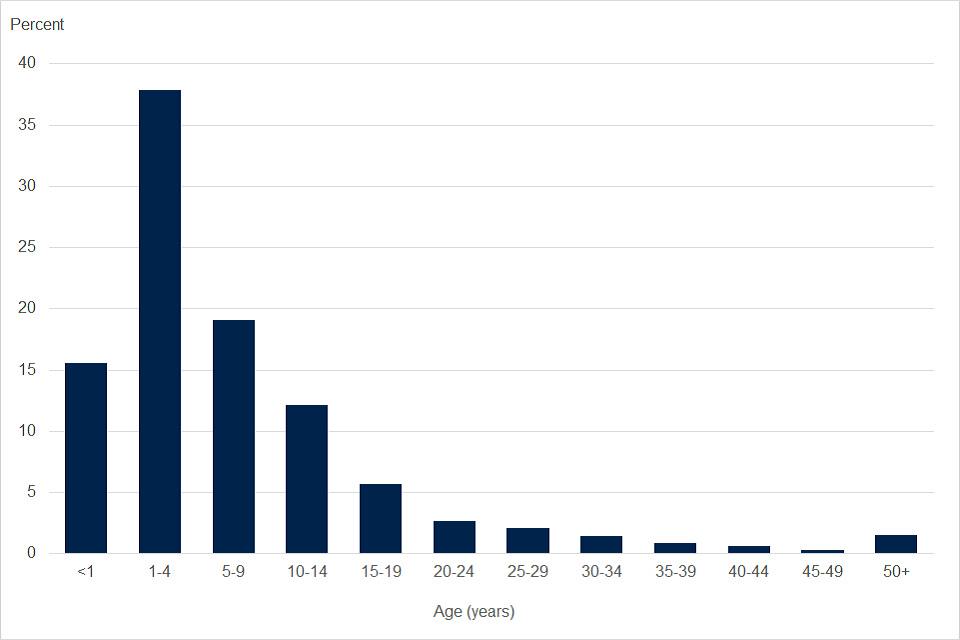
Source: Companies Register Activities 2015/16, Companies House
The average age of companies historically is relatively young, but it has been gradually declining from 10.7 years in 2000 to 8.4 years in 2016. This changing age profile may be related to the general increases in the numbers of incorporations and dissolutions, which in turn may have led to the register comprising of an increasing number of younger companies.
4.2 Chart 4: Average age of companies on the total register, 2000-2016, UK
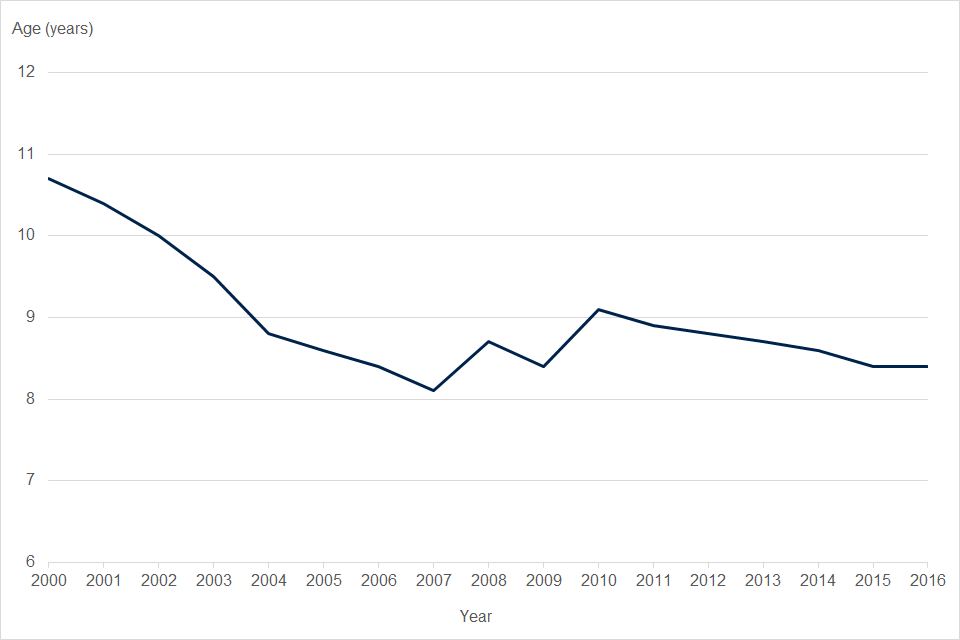
Source: Companies Register Activities 2015/16, Companies House
Table A5, in the workbook that accompanies this release, shows the age profile of companies on the total and effective registers at 31 March 2016, as well as those in liquidation or the course of dissolution. The table also shows the average age of companies from 2000 to 2016.
5. Types of corporate body on the register
There are over 23 types of corporate body held on the register. Further information on the different company types. These include a number of corporate body types in addition to those companies covered by the Companies Act 2006. Each corporate body type has its own requirements to provide information to Companies House, as outlined in various pieces of legislation and royal acts.
The composition of the register, in terms of corporate body types, has remained relatively stable over the last 10 years. Since 2006, private limited companies have dominated the register, consistently accounting for over 96%. During this time, the top three corporate body types of private limited companies, limited liability partnerships (LLPs), and limited partnerships have remained unchanged. Each year they accounted for around 99% of the register.
5.1 Table 1: Breakdown of corporate body types on the total register, 2016, UK
| Corporate body type | Number | Percentage of all corporate bodies |
|---|---|---|
| Private Limited | 3,524,747 | 92.7 |
| Private Limited by Guarantee/No Share Capital | 100,048 | 2.6 |
| Limited Liability Partnership | 60,209 | 1.6 |
| Private Limited by Guarantee/No Share Capital/(Exempt from using ‘Ltd’) | 42,295 | 1.1 |
| Limited Partnership | 39,601 | 1.0 |
| Overseas Company | 11,456 | 0.3 |
| Industrial and Provident Society | 10,077 | 0.3 |
| Public Limited Company | 7,144 | 0.2 |
| Private Unlimited | 4,601 | 0.1 |
| Other corporate body types | 3,587 | 0.1 |
| Total of corporate body types | 3,803,765 | 100 |
Source: Companies Register Activities 2015/16, Companies House
Table G1, in the workbook that accompanies this publication, shows numbers and percentages of all corporate body types on the register from 1989 to 2016.
6. Overseas corporate bodies with a physical presence in the UK
On 31 March 2016, there were 10,938 overseas corporate bodies on the total register. Overseas corporate bodies are incorporated outside of the UK and have a physical presence in the UK (such as a place of business or branch) through which they carry out their business. The profile of overseas corporate bodies has remained largely stable since 2010/11, increasing by just 449 corporate bodies in that time.
Corporate bodies incorporated in the USA accounted for 2,459 (22.5%) of all overseas companies, with the second highest originating country, the Republic of Ireland, accounting for just 839 (7.7%). The top 10 originating countries have remained unchanged since 2013/14, consistently accounting for 63-64% of all overseas corporate bodies on the total register.
6.1 Figure 2: Top 10 originating countries for overseas corporate bodies, 31 March 2016
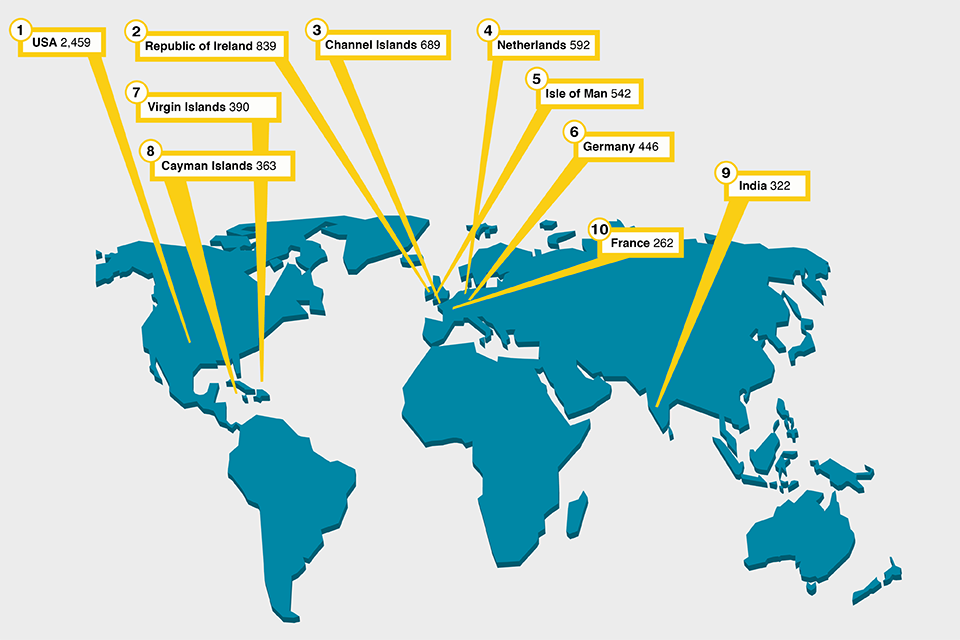
Source: Companies Register Activities 2015/16, Companies House
Seven hundred and sixty-seven new overseas corporate bodies were incorporated in 2015/16. Of these, 111 (14.5%) originated in the Channel Islands, 86 (11.2%) in the USA, and 82 (10.7%) in the Republic of Ireland. These three countries have consistently had the highest numbers of new incorporations since 2013/14.
6.2 Table 2: Registrations of corporate bodies incorporated outside the United Kingdom in 2015/16 – top 10 originating countries
| Country of incorporation | New incorporations | Percentage of all incorporations |
|---|---|---|
| Channel Islands | 111 | 14.5 |
| USA | 86 | 11.2 |
| Republic of Ireland | 82 | 10.7 |
| Netherlands | 58 | 7.6 |
| Canada | 44 | 5.7 |
| Germany | 30 | 3.9 |
| Virgin Islands (includes 1 USA Virgin Island) | 28 | 3.7 |
| Cayman Islands | 26 | 3.4 |
| France | 25 | 3.3 |
| Isle of Man | 23 | 3.0 |
| Total | 513 | 66.9 |
Source: Companies Register Activities 2015/16, Companies House
Full figures on registrations of corporate bodies incorporated outside the United Kingdom from 2013/14 to 2015/16, as well as numbers on the register at 31 March 2016, are provided in table D1.
7. Other statistics in this release
A range of other statistics are included in the tables that accompany this release, including:
- analysis of the companies register
- removals of companies from the register, including liquidations
- legal proceedings
- iInformation on other corporate bodies administered at Companies House
- workload of Companies House
- analysis of Companies House income
8. Background notes
This section provides a range of information designed to provide the user with more information about the statistics.
8.1 Definitions
You can access the definitions guidance that accompany our statistical releases.
8.2 Date of next release
Statistics for the 12 months to 31 March 2017 will be published in summer 2017. The publication date will be announced on our release calendar.
8.3 Revisions to these statistics
Revisions to these statistics will be mainly due to changes in methodologies and source data. The statistics are derived from administrative data, and changes to the underlying methods will cause revisions. These include changes in statistical methods, definitions, classifications, and geographic coverage.
Although Companies House has robust procedures in place to minimise errors in the methods used to create these statistics, errors may occasionally occur. If errors are found after the publication, their impact will be assessed. If the changes are significant, a corrigendum will be issued as soon as possible. Minor corrections will be included in the next planned release.
Any misleading or incorrect figures will be amended and a footnote added to indicate that the figures have been corrected. The nature and reason for the correction will be explained.
Revisions in this release: No revisions.
Planned revisions: No planned revisions.
8.4 Coverage
This release provides information on the size of the company population and the changes that have occurred within the year. The release includes statistics for the United Kingdom, England and Wales, Northern Ireland, and Scotland. The statistics cover companies and corporate bodies, both of which are specific legal forms of businesses that are registered at Companies House. They do not include information on sole proprietorship businesses, partnerships, and charities.
8.5 Use and users
Companies House statistics are used extensively by government, the public, public bodies and businesses. For example, they are used by:
- government in understanding the likely impact of policy changes and monitoring the impact of economic changes on companies;
- businesses in understanding their market share and planning marketing strategies;
- banks in developing an understanding of their customer base;
- foreign firms in making UK location decisions;
- academics to inform research into businesses at local and national level;
- a range of public bodies in decision making and evaluating business-related policies.
8.6 Consultation on official statistics
Companies House ran a consultation between March and May 2016 proposing to change the format and frequency of some of our statistical releases. Based on the outcomes of this consultation, the monthly Incorporated Companies in the United Kingdom release will now move to being published on a quarterly basis. The final monthly release was published at the end of July 2016, covering figures for June 2016. Statistics for July to September 2016 will be published at the end of October 2016. Late Filing Penalties Statistics will now move to being on a six monthly basis, with figures for April to September 2016 being published in October 2016.
The Annual Companies Register Activities statistic publication is unaffected by these changes.
8.7 Quality
These statistics are taken from the Companies House register. Companies House has strict quality and audit procedures around making amendments, additions and removals to the register. The compilation of these statistics has been quality assured.
8.8 Coherence
This section provides brief information on how these statistics relate to selected business statistics. More detailed information can be found in the Guide to the Business Population and Demographics statistics publications, which explores the similarities and differences between business statistics. It focusses on the differences between estimates of the business population and includes a range of related statistics.
8.9 Company incorporations and business creation
There is a range of official data sources available to monitor business creation, but each has a slightly different coverage. Taken together, they provide a good overall picture of the trend in business creation activity. Individually, each source will be suitable for different specific purposes.
Sources include:
-
Business Demography, which provides information for businesses registering for VAT or PAYE. This is an annual release that provides information on business ‘births’, defined as new registrations for VAT or PAYE. Business Demography does not capture the smallest, non-employing business start-ups which do not register for VAT or PAYE.
-
Companies House Incorporations – new company registrations, including those not actively trading. Incorporations are one source of statistics in business creation. They provide information on newly formed companies that are added to the Companies House register. Incorporated Companies can go on to trade actively, but some will be dormant companies that do not trade actively. Companies House Incorporations do not capture business start-ups of other business types such as those starting up as an unincorporated sole proprietorship or partnership.
-
Business Population Estimates, which provide the only estimate of the total UK business population. It includes information on incorporated companies and unincorporated sole proprietorships or partnerships.
-
UK Business, which provides more detail on the business population that has registered for VAT or PAYE.
-
Companies House provides information on the total number of incorporated companies that are filing documents to Companies House. Two figures are provided: the ‘total’ register, which includes companies that are trading, dormant and in the process of liquidation or dissolution, and the ‘effective’ register, which includes those trading, dormant and in receivership, but excludes those companies in the process of liquidation or dissolution.
8.10 Company insolvency and company dissolutions
The Insolvency Service reports the most complete picture on insolvency statistics, including company liquidations and individual insolvencies, as it has policy responsibility for all forms of corporate insolvency in England and Wales. Compulsory liquidations published in the tables that accompany this release differ from those published by the Insolvency Service. The Insolvency Service’s compulsory liquidations statistics are sourced from their administrative systems. All other forms of company insolvency published by the Insolvency Service are on the same basis as those published by Companies House.
8.11 Timelines and punctuality
These statistics are published on an annual basis. Statistics are published the summer following the end of the period being reported. This is the earliest publication date that allows the compilation of the statistical release ready for publication.
8.12 Accessibility and clarity
These statistics are available free of charge to the end user on the Companies House website. They are released via the Publication Hub. Historic data are also published on the National Archives website.
Views on the clarity of this publication are welcomed by emailing statistics@companieshouse.gov.uk