The Aggregate Demand and Aggregate Supply Equilibrium provides information on price levels, real GDP, and changes to unemployment, inflation, and growth as a result of new economic policy.
For example, if the government increases government spending, then it would shift Aggregate Demand (AD) to the right which would increase inflation, growth (real GDP), and employment. There are differences in two extreme cases rises from the different views on the cause of unemployment, Keynesian views unemployment as involuntary, while Monetarists view unemployment as voluntary.
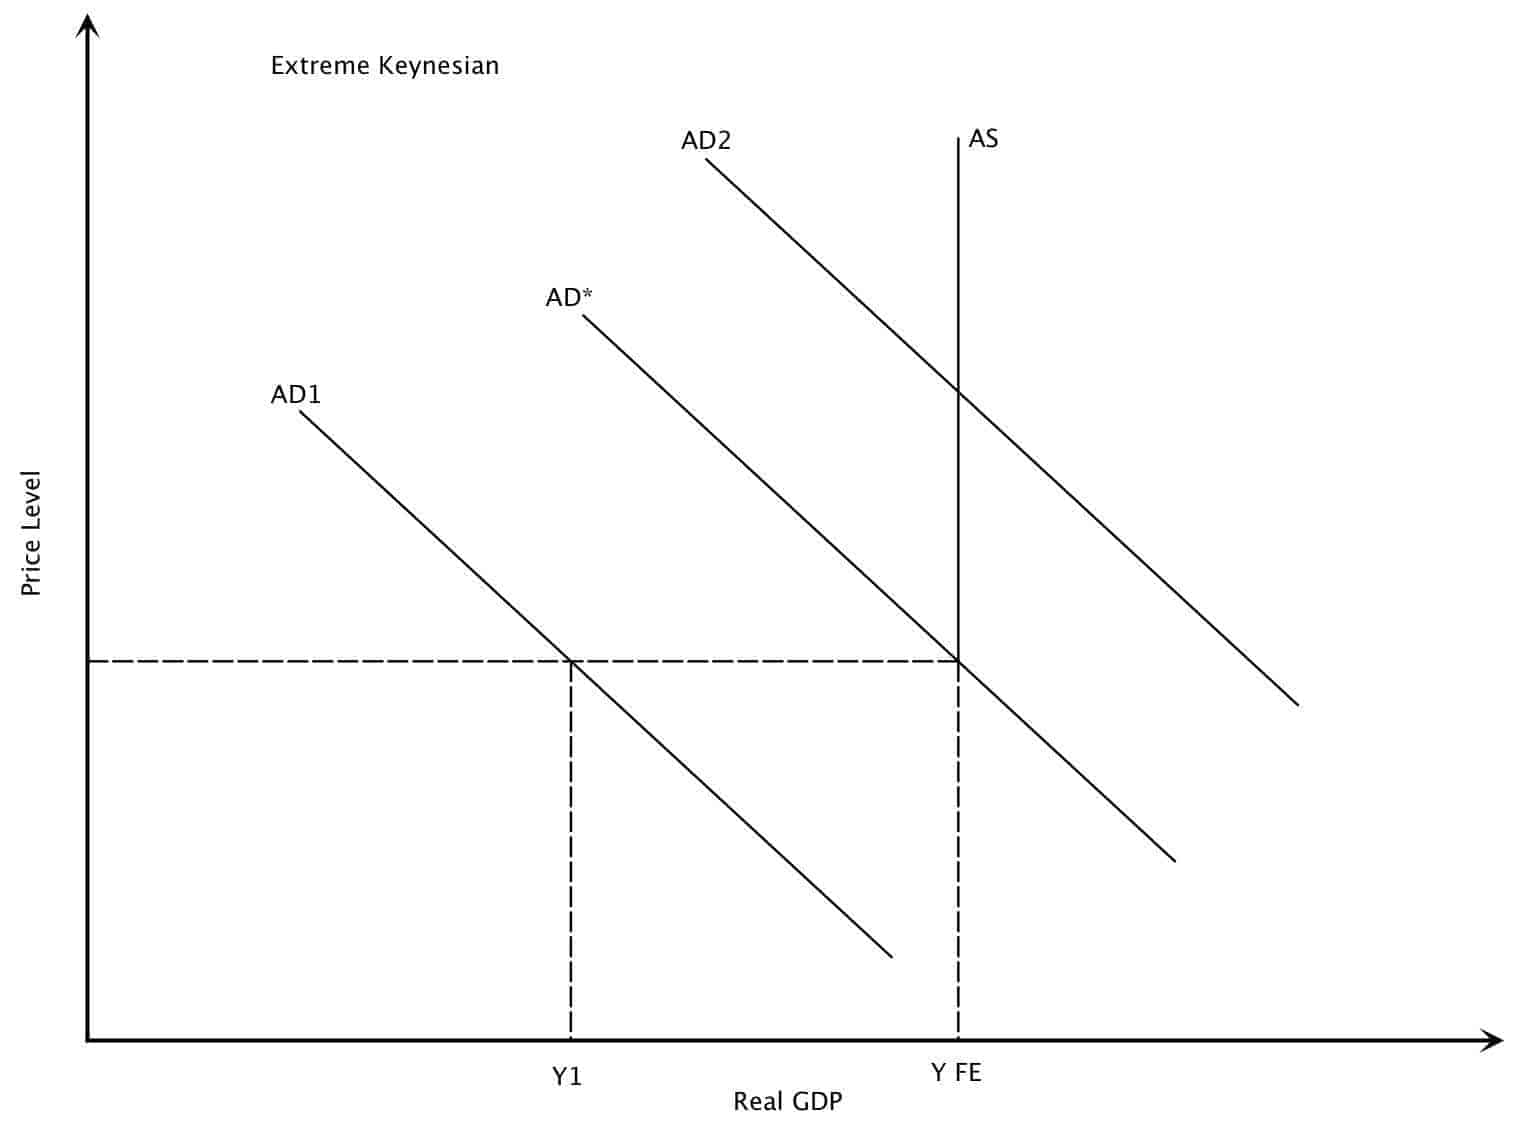
Increase in Aggregate Demand in Extreme Keynesian Case
The Aggregate Supply curve is horizontal until it reaches the point of full employment, where it becomes vertical. At AD1, the output is below full employment. There is a deflationary gap, between AD* and AD1 on the vertical AS curve, which means that equilibrium output is less than full employment. Demand-side policies can shift AD1 to AD*, however, beyond that, there is no rise in output. There is just an increase in inflation. There is an inflationary gap between AD* and AD2, the vertical distance on AS.
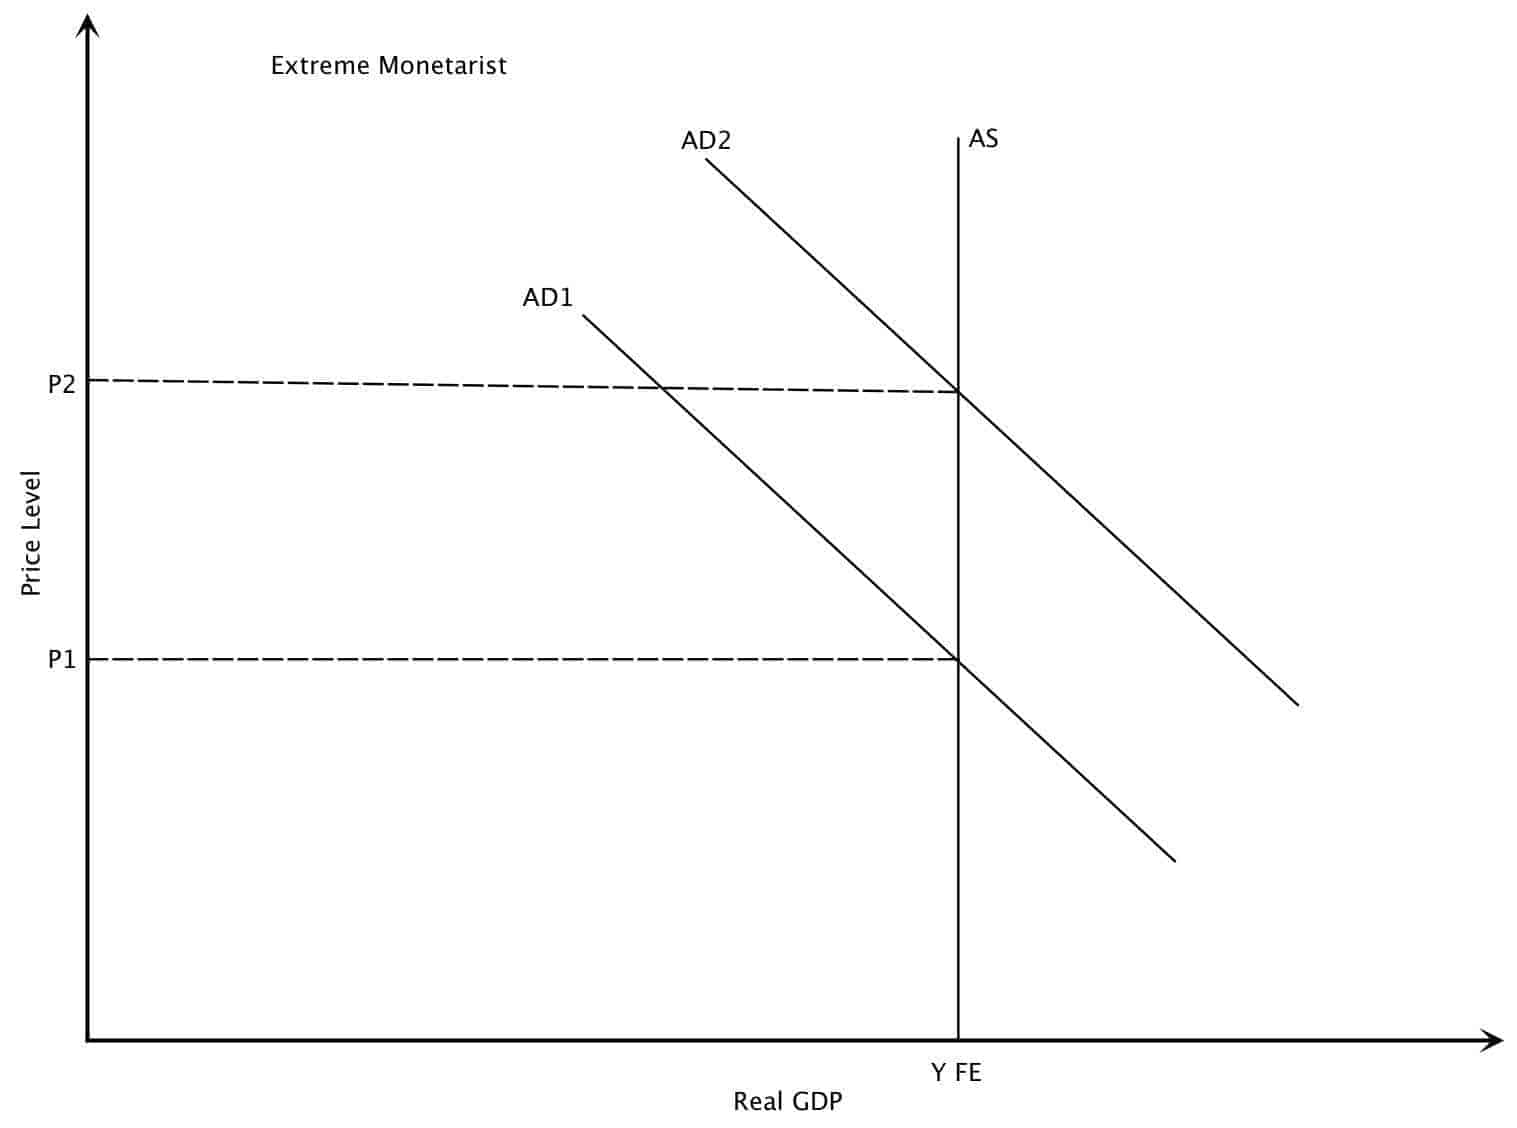
Increase in Aggregate Demand in Extreme Monetarist Case
The extreme Monetarist case reflects that an economy will always be at full employment at equilibrium (because of the concept of ‘voluntary unemployment’). Aggregate Demand only determines prices, and in any increase in AD will only result in an increase in the rate of inflation. It means that only supply side policies can increase real GDP.
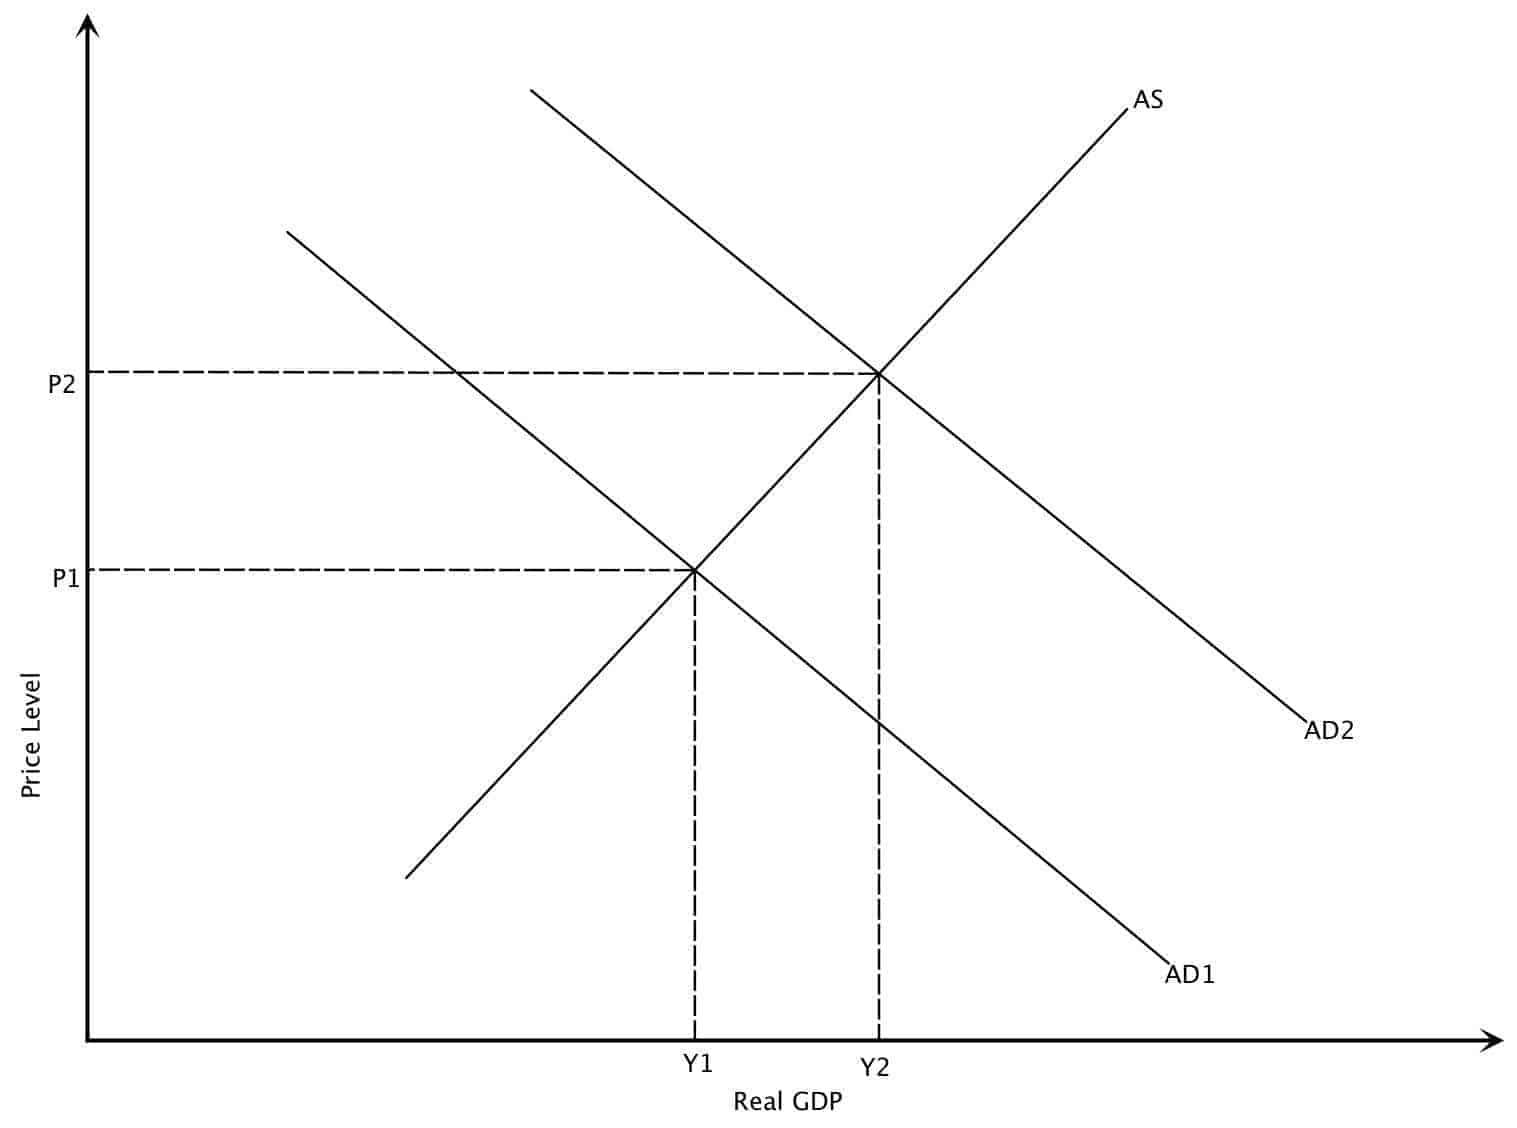
Increase in Aggregate Demand in Intermediate Graph
The equilibrium is initially assumed at P1 and Y1. An increase in Aggregate Demand leads to an increase in real GDP from Y1 to Y2, but at the cost of an increase in the rate of inflation. It shows that growth can be increased at the expense of increasing inflation.
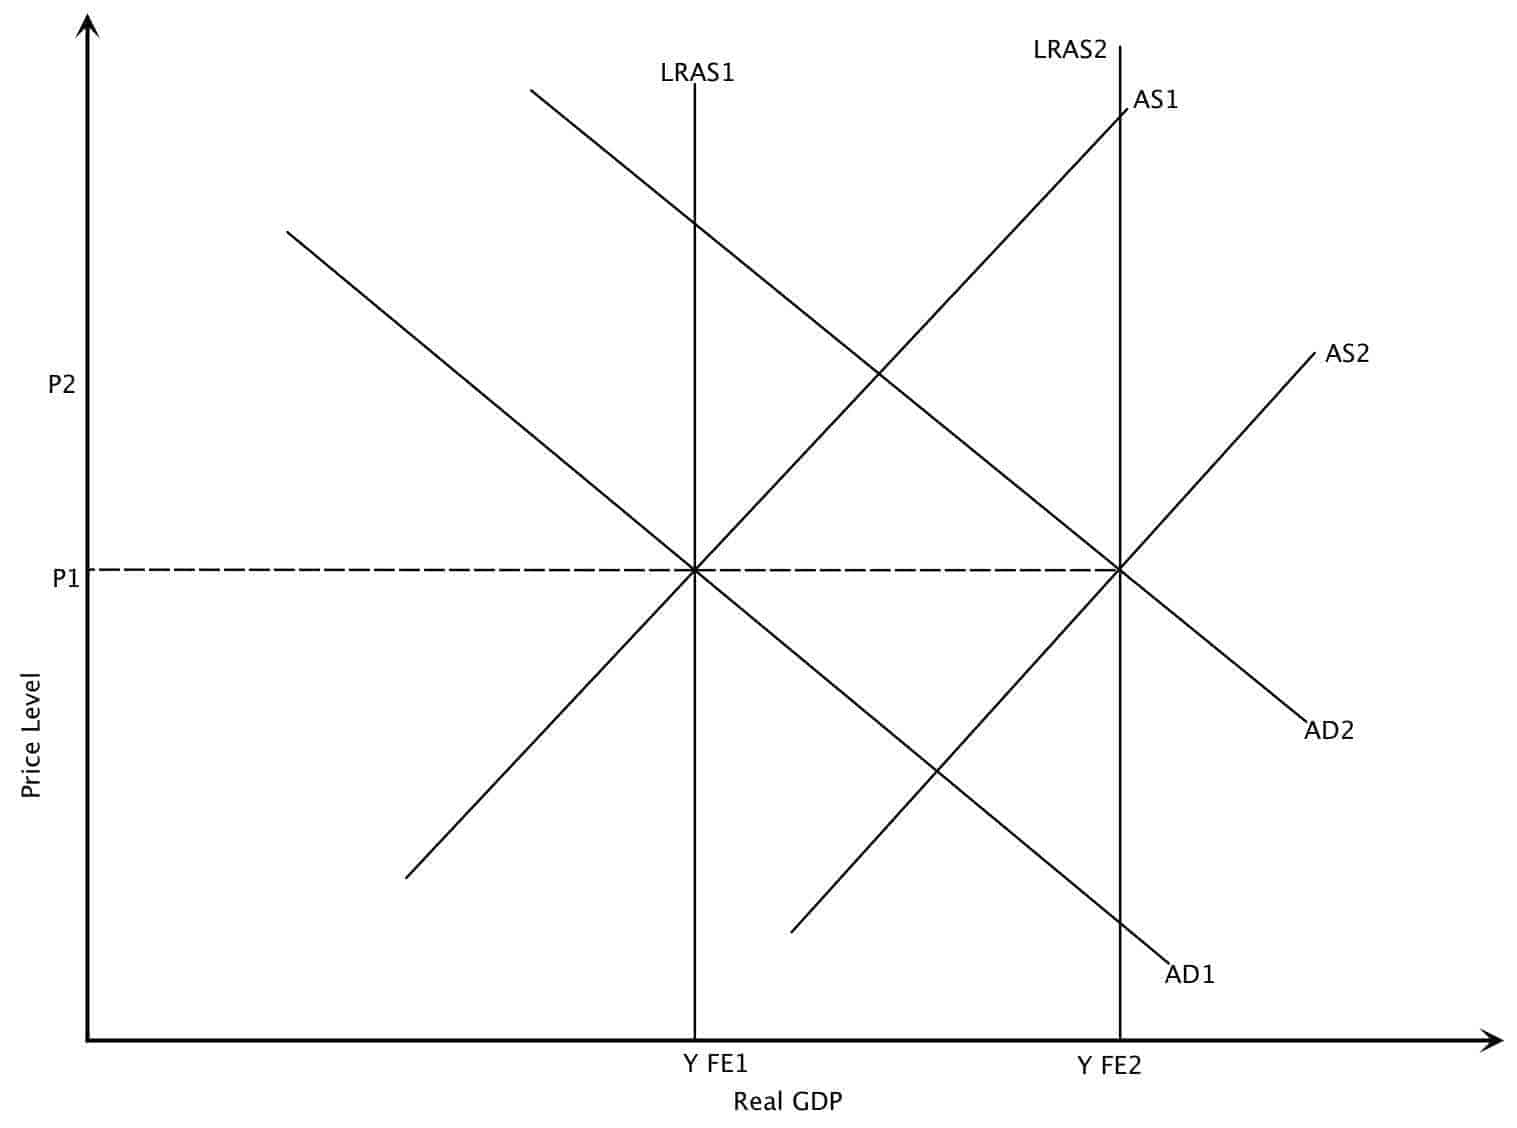
Increase in Aggregate Supply
The above graph shows the effect of a supply side policy with the assumption that AD is increasing too. The increase is a shift in the Long Run Average Supply curve from LRAS1 to LRAS2, and the increase from real GDP to Y FE2. This occurs without an increase in price levels.