The demographic transition model (DTM) shows shifts in the demographics of a population during economic and social development. This transition is two-fold: both death and birth rates go from high to low over time as development progresses. There are four key stages of demographic transition; the term “transition” refers in particular to the transient period when many fewer people die than are born, with the result of very high population growth.
Basis of the Demographic Transition Model
Having originated in the middle of the 20th century, the demographic transition model is now over half a century old. It is the product of observations regarding population growth and development across numerous countries throughout the world.
The demographic transition model operates on the assumption that there is a strong association between birth and death rates, on the one hand, and industrialization and economic development on the other. This is a safe assumption in most cases as it has been demonstrated to be consistently true by many historical instances of industrialization and development since the 19th century.
Demographic Transition Model Stages
The demographic transition model consists of four key stages. There is also a fifth stage that is a bit less established; we will explain why that is the case. Finally, the sixth stage is a much newer development in this field and demonstrates the degree to which the demographic transition model remains evolving and in flux.
Stage 1: High Population Growth Potential
This is generally a pre-industrial society in which both birth and death rates are quite high. Birth rates and death rates are effectively in balance. The lack of food availability as well as adequate medical care or effective sanitation and hygiene means the population does not grow very much due to disease and starvation.
The majority of people are concentrated in rural regions, primarily focusing on agriculture. This agricultural focus means that having more children is an economic benefit as well as a status symbol, further contributing to high birth rates and efforts to have larger families. The poor experience the highest mortality rates of any demographic, but life expectancies are short overall.
Stage 2: Population Explosion
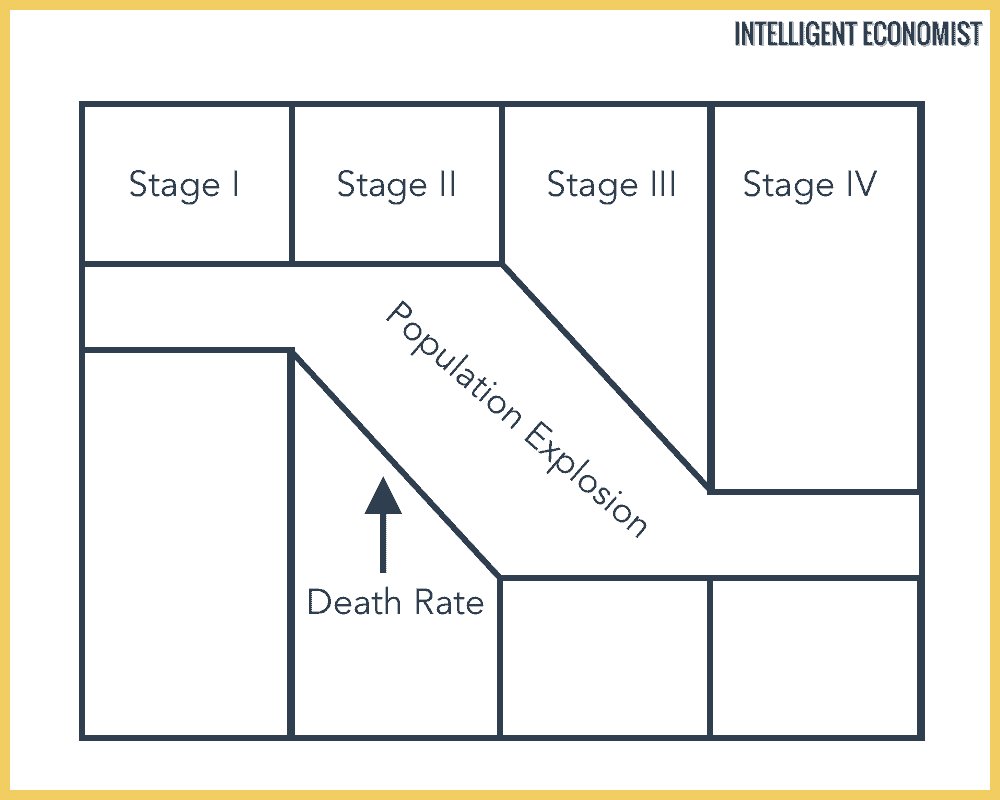
This is the point at which the country begins to experience social and economic development. With more productive agriculture (and thus more food supply), better medical care, and more effective sanitation and hygiene, death rates fall quickly and lifespans are longer. The birth rate, however, does not fall at the same time (it does not increase, but rather remains high). Birth rates far outpace death rates with the result that the population grows rapidly.
The graph below provides a visual to explain this stage—population increases as the birth rate stays the same and the death rate falls significantly:
Stage 3: Population Growth Starts to Level Off
At this stage, birth rates decline. This can be attributed to a wide array of social factors, including:
- Contraception access
- Higher wages
- Fewer families participating in agriculture (meaning less need for large families to work on farms)
- Improvement in education and social status of women
The result of this decline in birth rates, as the death rate continues to decline with further improvements in health and sanitation, is that population growth starts to decline as compared to the second stage. As an example, Mexico began to arrive at stage three at the beginning of the 21st century. Additionally, China used its One-Child Policy to attempt to move toward the third and fourth stages more quickly than the country might otherwise have done.
Stage 4: Stationary Population
Both birth and death rates are now low at this stage. As a result, the population may remain the same or even decrease as birth rates come to be lower than “replacement level”—that is, families are having an average of fewer than two children each. At this time, we would expect that the generation born during the second stage of demographic transition is aging. Meanwhile, the potentially shrinking working population must support these elderly members of society. Japan, for instance, is currently dealing with this socio-economic challenge; some consider Japan to be at the fifth stage of the demographic transition model (described below).
Stage 5: Further Changes in Birth Rates
This stage is a bit more uncertain. At this stage, some demographers say that fertility rates will experience shifts to either above or below replacement levels. While some experts argue that fertility levels will increase, others state the opposite. This depends on the society, too: while populations in China and Australia are expected to fall due to lower birth rates, those in the U.S., India, and Mexico are expected to increase. Additional stages have also been proposed—this is a contested area and theorists have quite a bit more work to do to come to some kind of consensus within the field of demography.
Summarizing the Stages
The descriptions above are quite detailed, so here is a more succinct summary of the five stages:
- Stage 1: This is a state of high birth and death rates culminating in low population growth overall.
- Stage 2: With a consistently high birth rate and decreasing death rate, population growth surges.
- Stage 3: As the birth rate falls and the death rate remains low, the population continues to increase.
- Stage 4: Traditionally considered to be the final stage, this is one of demographic stabilization, in which both birth and death rates are low. This means that the overall population stays fairly low.
- Stage 5: This final, contested stage may predict higher or lower fertility levels depending on which theorist you ask.
How Long Does Demographic Transition Take?
Although the demographic transition model establishes a general structure for what is likely to happen as societies experience economic and social development, it does not suggest any time frame for how long this will take to occur. This is a limitation in the forecasting ability of the DTM.
Historically, the rate of demographic transition has varied enormously. Certain countries have passed through multiple stages quite rapidly, including Brazil as well as China (thanks in part to their One-Child Policy, as described above). By contrast, other societies remain at the second stage of the DTM as a result of additional social obstacles and roadblocks to development, such as widespread and debilitating outbreaks of disease.
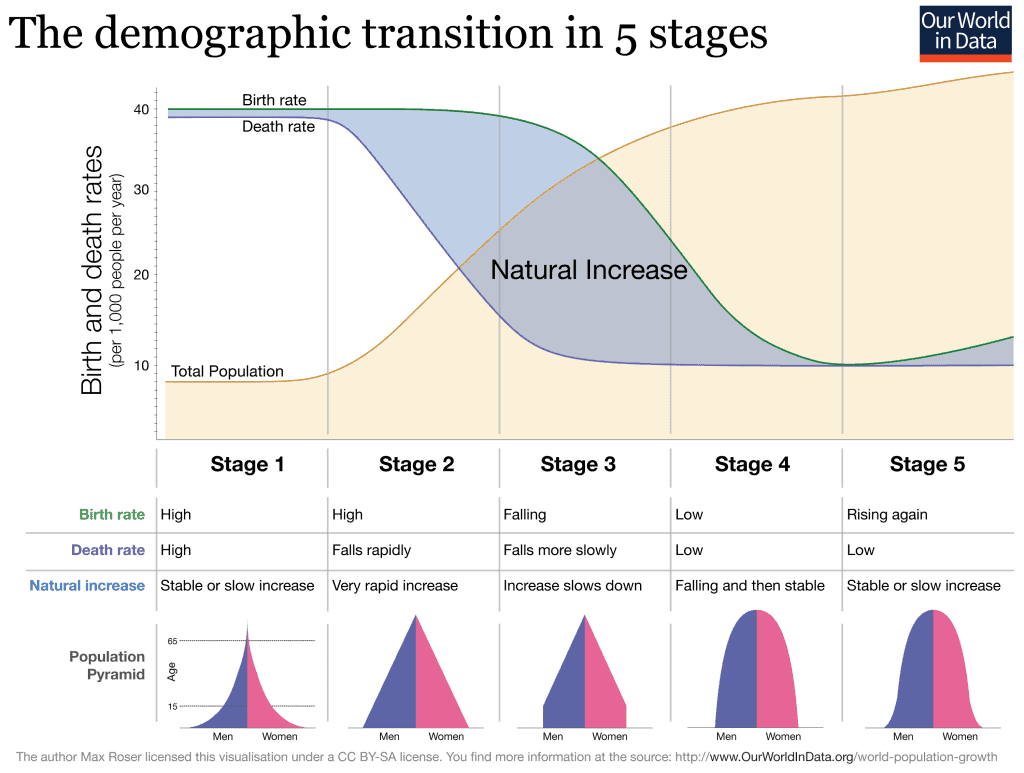
Graph of the Demographic Transition Model
The graph below summarizes the demographic transition model across the model’s five stages, showing the trajectory of death and birth rates as well as total population:
Limitations of the Demographic Transition Model
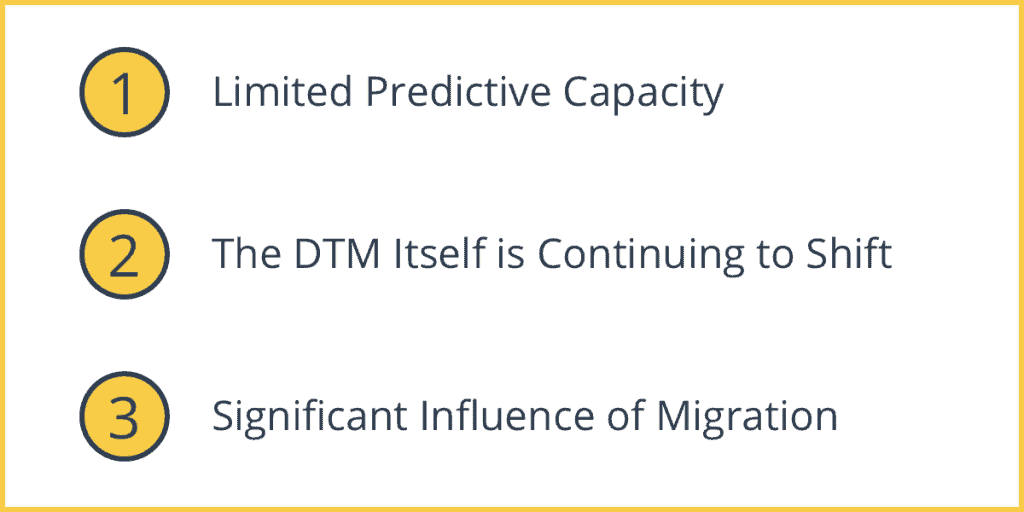
1. Limited Predictive Capacity
The demographic transition model is a highly useful model for making educated guesses about how populations are likely to shift in the future. Rooted as it is in a wide array of real-world population trends, it is considered to be an empirical model, as it is based on actual data and observation.
However, it is just that: a model. It is not an absolute equation—it cannot reliably predict what will actually happen, and certainly cannot do so in great detail. Each country has its own set of social and cultural attributes that can heavily influence its demographics, causing them to operate differently than you might expect based solely on the DTM.
One prominent example of this unpredictability is that of Russia. You might guess that their continuing economic development would mean the country’s population would follow the patterns of the DTM. However, nearly 25 percent of men in Russia do not live past roughly age 55. This devastating reality is rooted in a number of complex and interconnected social, cultural, and economic factors. The situation is simply more complicated than the DTM could possibly predict.
Furthermore, economic development does not guarantee the kind of social changes that would lead to a reduction in birth rates. For instance, a country might experience significant economic development and industrialization without providing women with widespread access to birth control. Without birth control, birth rates would remain high. For this reason they would not be likely to make it to stage 3, at which point birth rates begin to fall.
2. The DTM Itself is Continuing to Shift
As described above, when first established, the demographic transition model had just four stages. Demographers then added a fifth stage to accommodate new trends in development they had noticed. This contested status demonstrates that the model is not set in stone enough to be considered absolutely foolproof. Experts note that the DTM is likely to continue to evolve as the real world evolves.
3. Significant Influence of Migration
Migration is also a significant factor in demographic shifts, and one for which the demographic transition model does not explicitly account. Both in- and out-migration affect natural and actual increases and decreases in population. The effect of migration depends especially on migrants’ fertility, social attitudes, age, gender, and other identity factors.